| Param | Original file | Final file |
|---|---|---|
| Filename | modeM0/AS1A09_127T03_9000003820_26419cztM0_level2.evt | modeM0/AS1A09_127T03_9000003820_26419cztM0_level2_quad_clean.evt |
| Size (bytes) | 610,758,720 | 84,228,480 |
| Size | 582.5 MB | 80.3 MB |
| Events in quadrant A | 3,302,096 | 532,461 |
| Events in quadrant B | 3,463,301 | 545,106 |
| Events in quadrant C | 4,533,125 | 501,770 |
| Events in quadrant D | 6,727,108 | 486,058 |
| Mode M0 | |||
|---|---|---|---|
| Quadrant | BADHDUFLAG | Total packets | Discarded packets |
| A | 0 | 14291 | 0 |
| B | 0 | 14647 | 0 |
| C | 0 | 17942 | 0 |
| D | 0 | 24809 | 0 |
| Mode M9 | |||
|---|---|---|---|
| Quadrant | BADHDUFLAG | Total packets | Discarded packets |
| A | 0 | 11 | 0 |
| B | 0 | 12 | 0 |
| C | 0 | 12 | 0 |
| D | 0 | 12 | 0 |
| Quadrant | Total seconds | Saturated seconds | Saturation percentage |
|---|---|---|---|
| A | 6963 | 59 | 0.847336% |
| B | 6963 | 92 | 1.321270% |
| C | 6963 | 363 | 5.213270% |
| D | 6963 | 714 | 10.254201% |
Noise dominated data is calculated using 1-second bins in cleaned event files. If a bin has >2000 counts, and if more than 50% of those come from <1% of pixels, then it is considered to be noise-dominated and hence unusable.
| Quadrant | # 1 sec bins | Bins with >0 counts | Bins with >2000 counts | High rate bins dominated by noise | Noise dominated (total time) | Noise dominated (detector-on time) | Marked lightcurve |
|---|---|---|---|---|---|---|---|
| A | 7853 | 6964 | 0 | 0 | 0.00% | 0.00% | 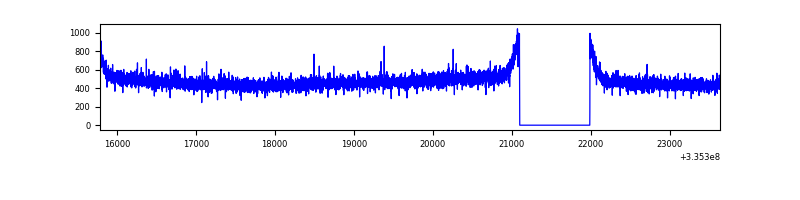 |
| B | 7853 | 6964 | 1 | 1 | 0.01% | 0.01% | 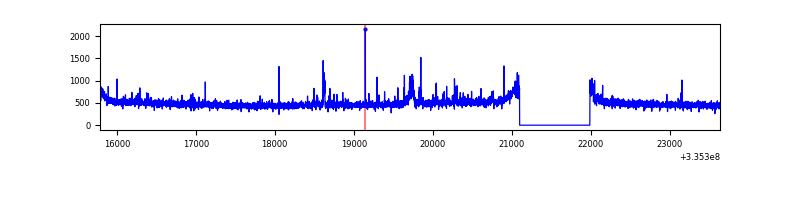 |
| C | 7853 | 6964 | 103 | 103 | 1.31% | 1.48% | 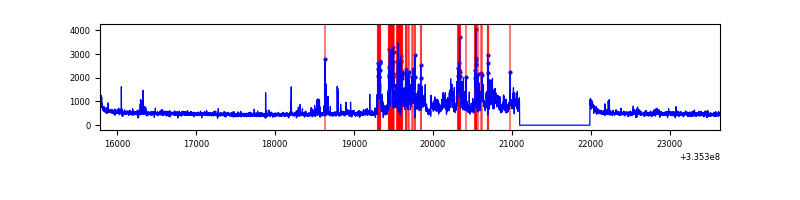 |
| D | 7853 | 6964 | 574 | 574 | 7.31% | 8.24% | 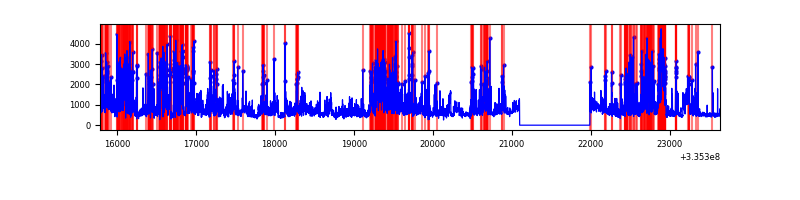 |
Top three noisy pixels from each quadrant. If the there are fewer than three noisy pixels in the level2.evt file, extra rows are filled as -1
| Pixel properties | Quadrant properties | ||||||
|---|---|---|---|---|---|---|---|
| Quadrant | DetID | PixID | Counts | Sigma | Mean | Median | Sigma |
| A | 13 | 254 | 11551 | 62.65 | 854 | 836 | 171.0 |
| A | 3 | 137 | 7648 | 39.83 | 854 | 836 | 171.0 |
| A | 0 | 226 | 7277 | 37.66 | 854 | 836 | 171.0 |
| B | 0 | 244 | 41080 | 249.3 | 858 | 838 | 161.4 |
| B | 15 | 32 | 22519 | 134.32 | 858 | 838 | 161.4 |
| B | 0 | 230 | 22421 | 133.71 | 858 | 838 | 161.4 |
| C | 3 | 233 | 1036331 | 5464.28 | 818 | 821 | 189.5 |
| C | 14 | 238 | 131124 | 687.6 | 818 | 821 | 189.5 |
| C | 4 | 254 | 110039 | 576.33 | 818 | 821 | 189.5 |
| D | 1 | 52 | 2395389 | 12607.77 | 796 | 777 | 189.9 |
| D | 12 | 233 | 561045 | 2949.84 | 796 | 777 | 189.9 |
| D | 15 | 0 | 344251 | 1808.41 | 796 | 777 | 189.9 |
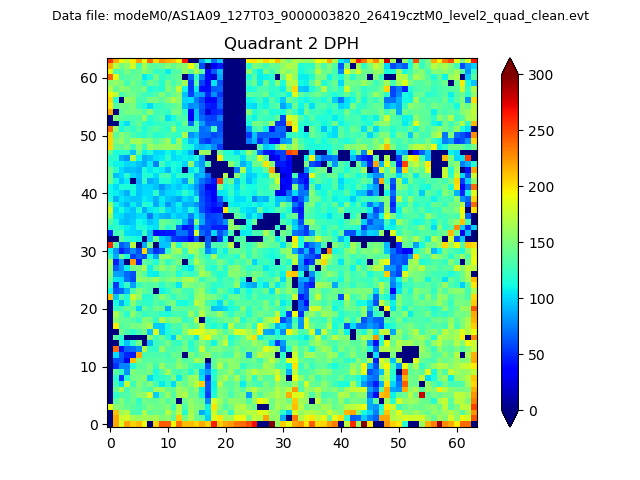
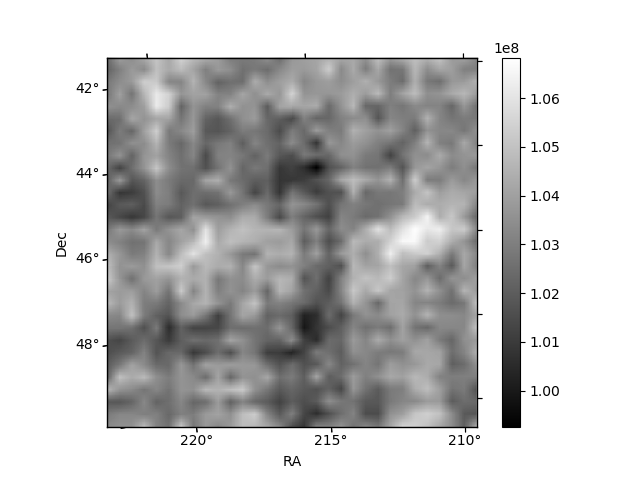
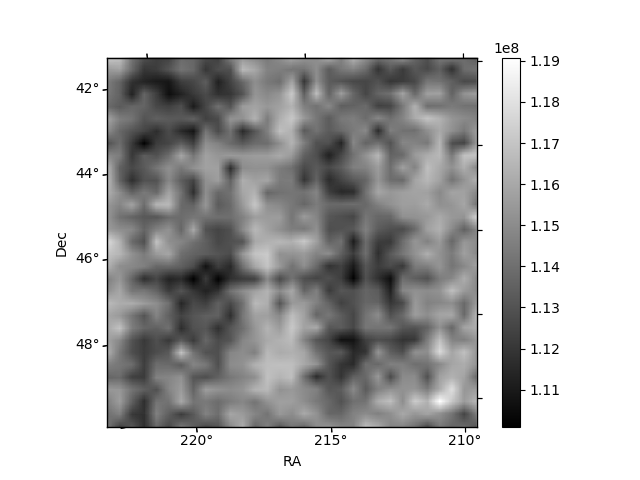
Histogram calculated using DETX and DETY for each event in the final _common_clean file
| Quadrant A | 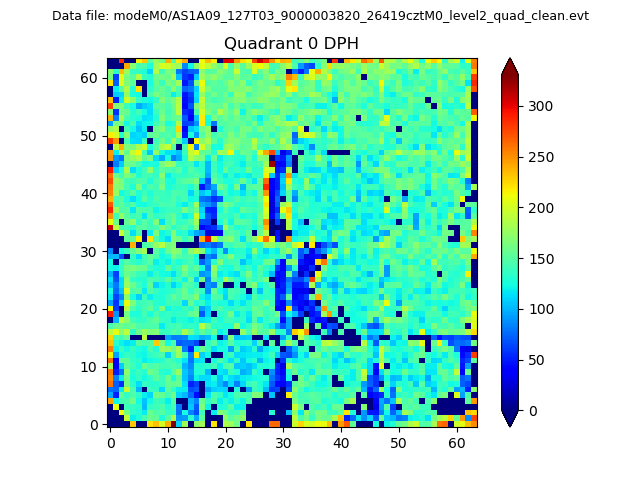 |
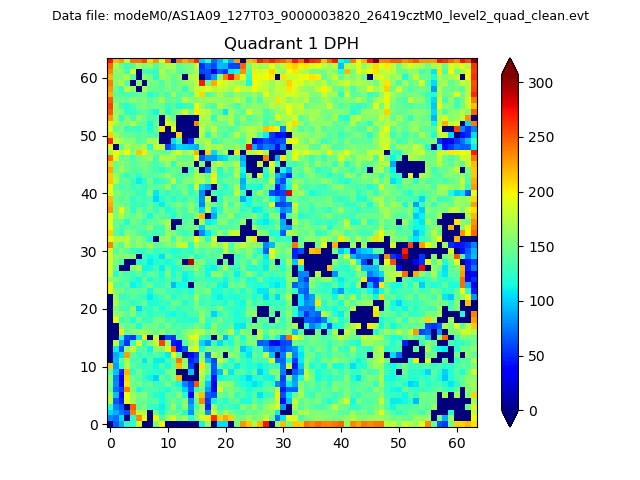 |
Quadrant B |
|---|---|---|---|
| Quadrant D | 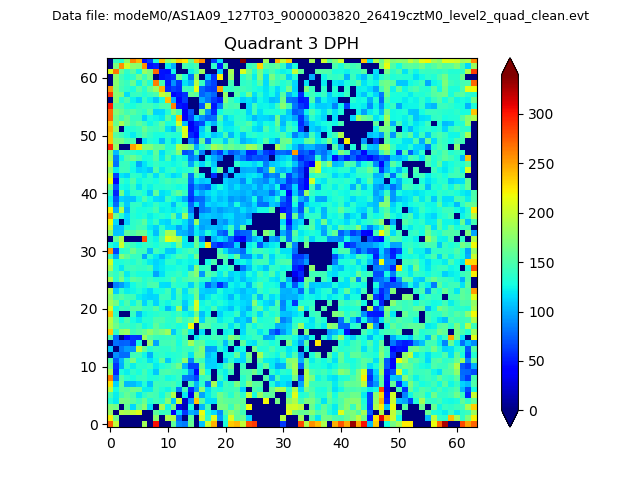 |
 |
Quadrant C |
| Plot type | Count rate plots | Images |
|---|---|---|
| Comparison with Poisson distribution Blue bars denote a histogram of data divided into 1 sec bins. Red curve is a Poisson curve with rate = median count rate of data. |
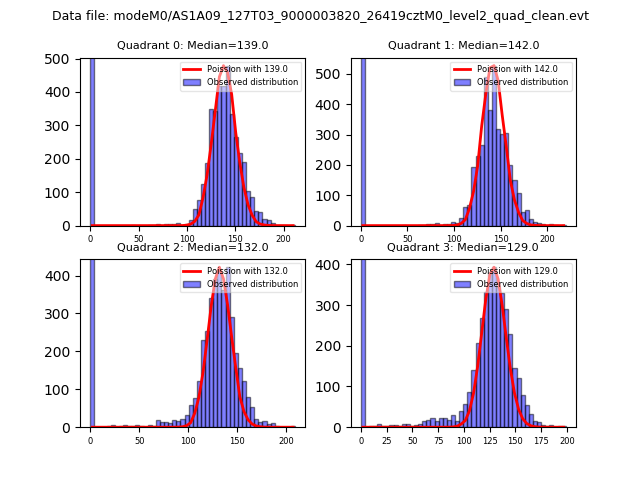 |
 |
| Quadrant-wise count rates Data is divided into 100 sec bins |
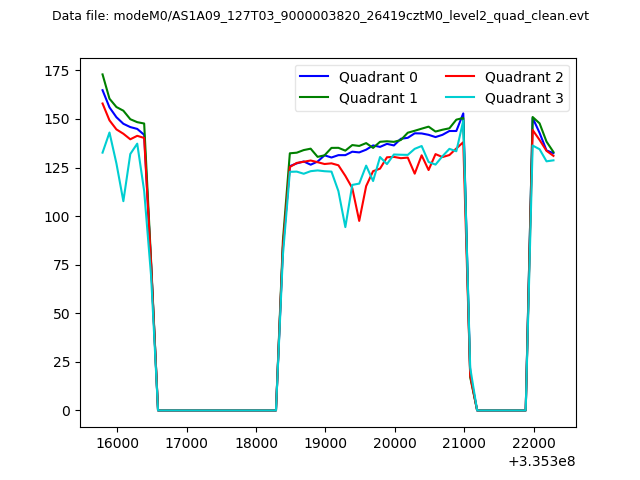 |
|
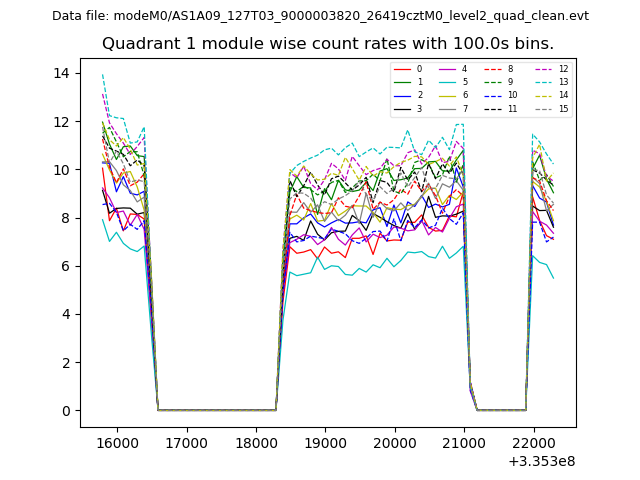
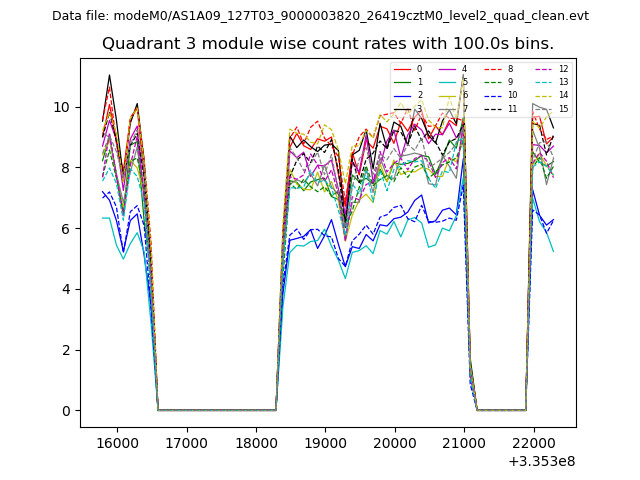
| Module-wise count rates for Quadrant A Data is divided into 100 sec bins |
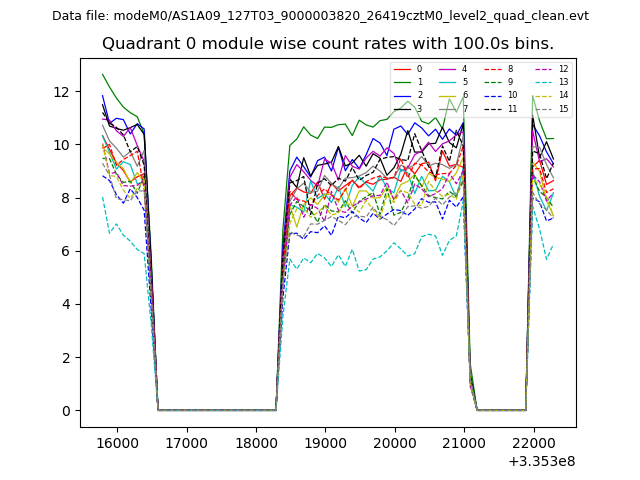 |
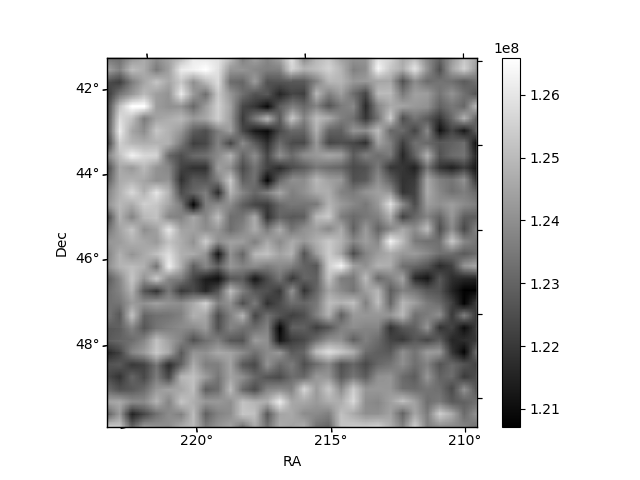 |
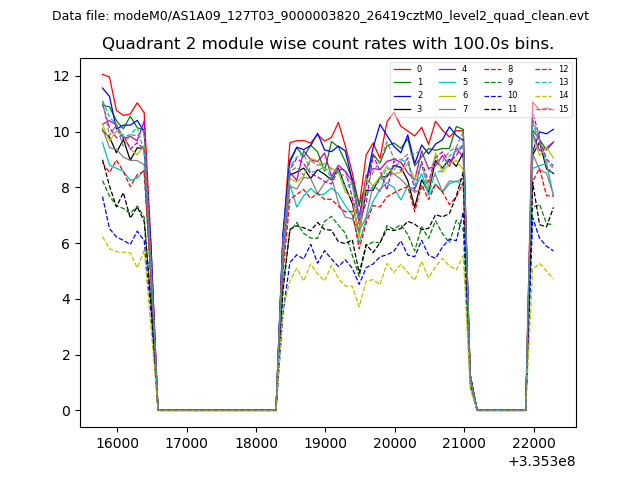
| Module-wise count rates for Quadrant B Data is divided into 100 sec bins |
 |
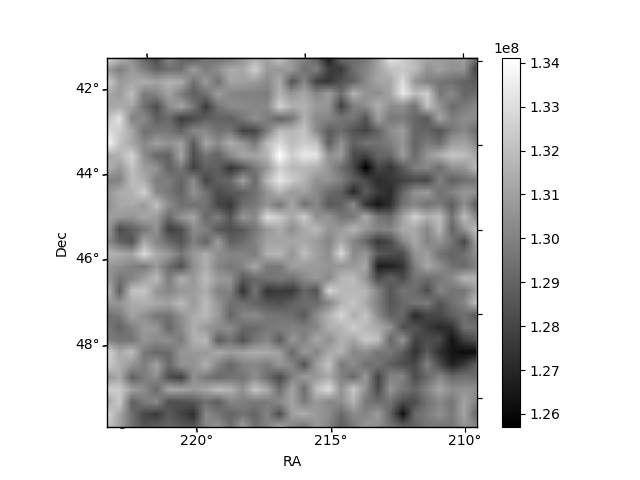 |
| Module-wise count rates for Quadrant C Data is divided into 100 sec bins |
 |
 |
| Module-wise count rates for Quadrant D Data is divided into 100 sec bins |
 |
 |
| Parameter | Plot |
|---|---|
| CZT HV Monitor | 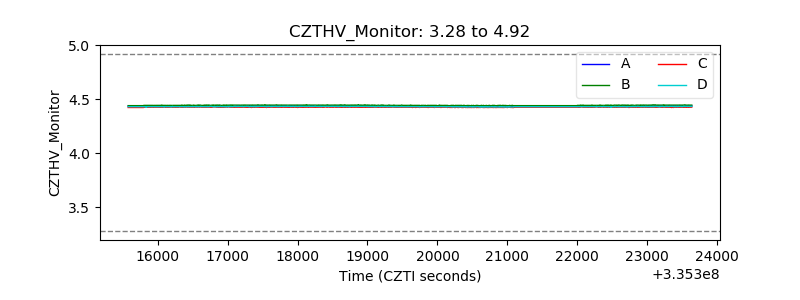 |
| D_VDD |  |
| Temperature 1 | 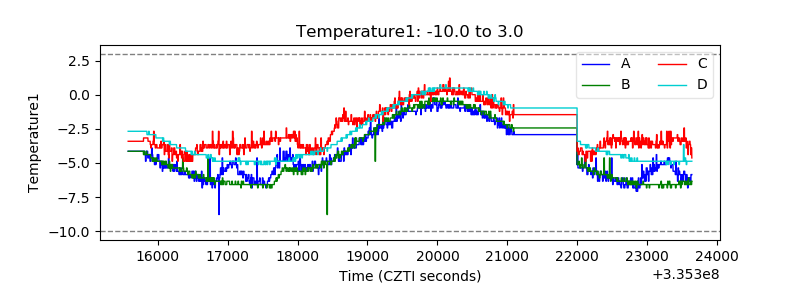 |
| Veto HV Monitor | 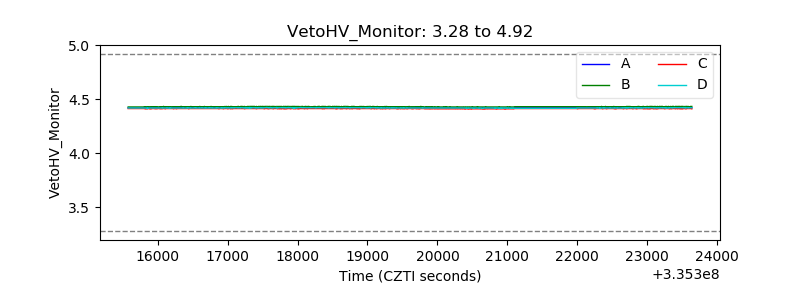 |
| Veto LLD | 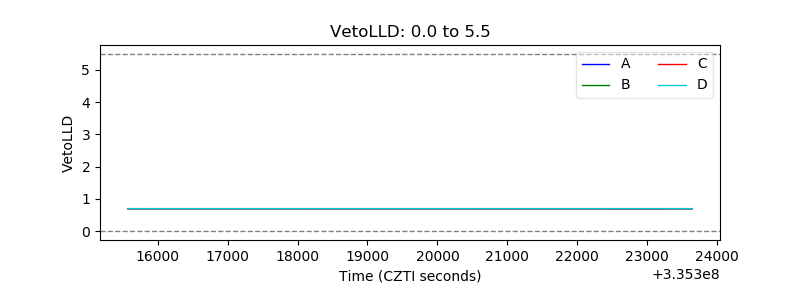 |
| Alpha Counter | 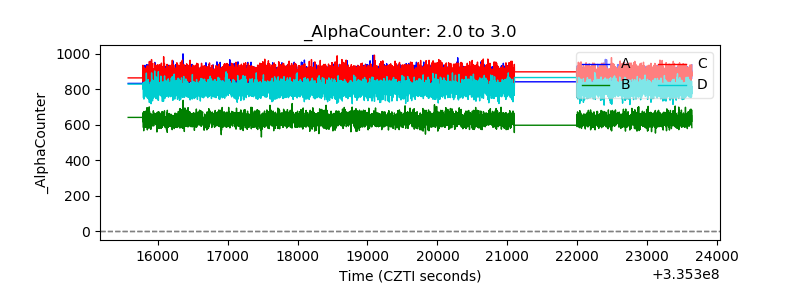 |
| _CPM_Rate | 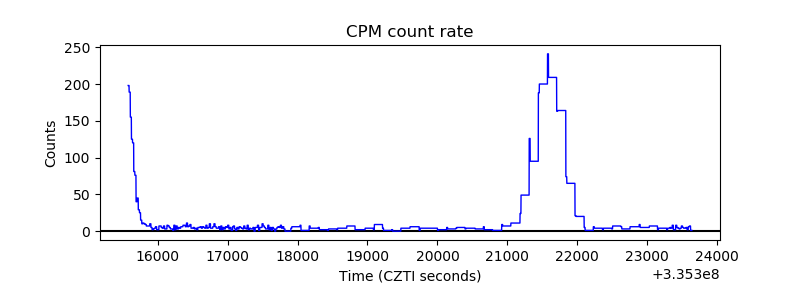 |
| CZT Counter | 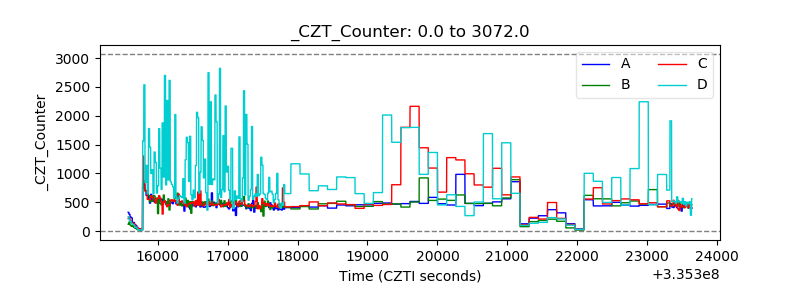 |
| +2.5 Volts monitor |  |
| +5 Volts monitor | 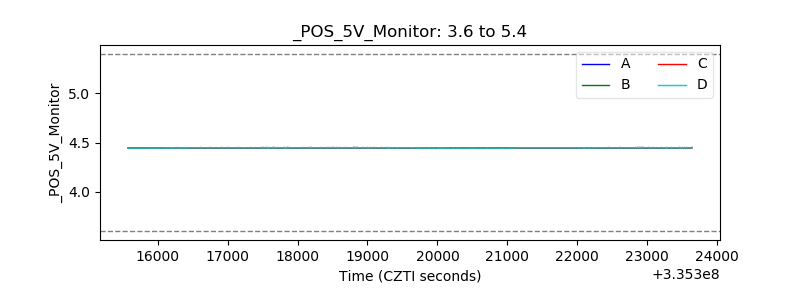 |
| _ROLL_ROT | 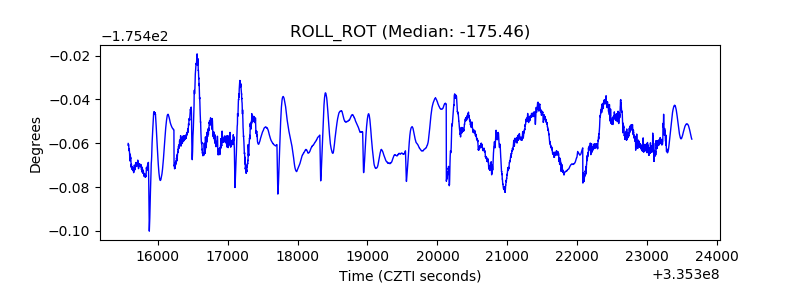 |
| _Roll_DEC | 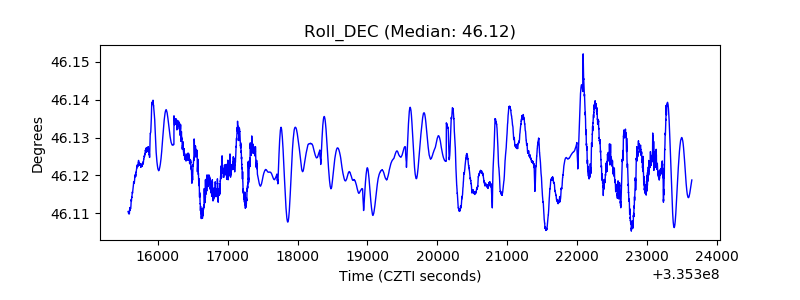 |
| _Roll_RA | 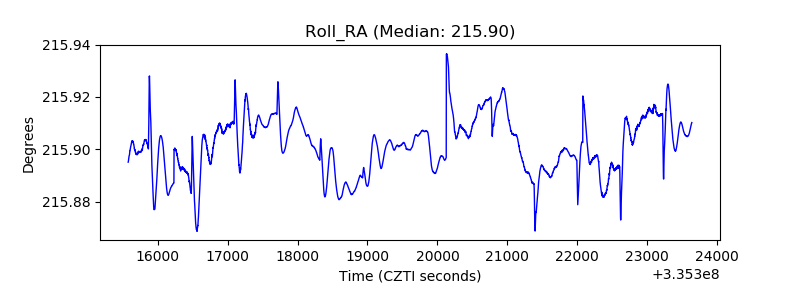 |
| Veto Counter | 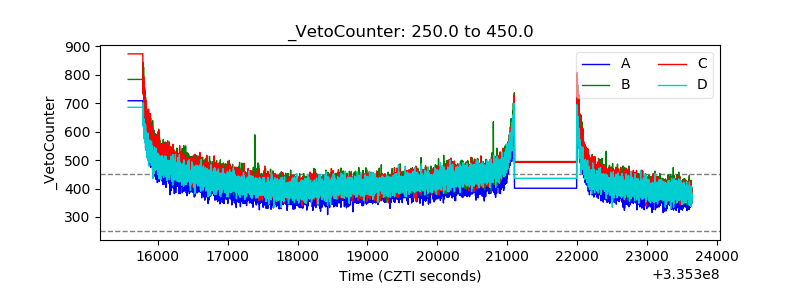 |