| Param | Original file | Final file |
|---|---|---|
| Filename | modeM0/AS1A09_127T03_9000003820_26420cztM0_level2.evt | modeM0/AS1A09_127T03_9000003820_26420cztM0_level2_quad_clean.evt |
| Size (bytes) | 586,955,520 | 85,780,800 |
| Size | 559.8 MB | 81.8 MB |
| Events in quadrant A | 3,482,101 | 535,930 |
| Events in quadrant B | 3,720,044 | 540,045 |
| Events in quadrant C | 3,894,520 | 514,413 |
| Events in quadrant D | 6,179,040 | 493,300 |
| Mode M0 | |||
|---|---|---|---|
| Quadrant | BADHDUFLAG | Total packets | Discarded packets |
| A | 0 | 15208 | 0 |
| B | 0 | 15770 | 0 |
| C | 0 | 16217 | 0 |
| D | 0 | 23300 | 0 |
| Mode M9 | |||
|---|---|---|---|
| Quadrant | BADHDUFLAG | Total packets | Discarded packets |
| A | 0 | 14 | 0 |
| B | 0 | 14 | 0 |
| C | 0 | 14 | 0 |
| D | 0 | 14 | 0 |
| Quadrant | Total seconds | Saturated seconds | Saturation percentage |
|---|---|---|---|
| A | 7376 | 122 | 1.654013% |
| B | 7377 | 177 | 2.399349% |
| C | 7377 | 243 | 3.294022% |
| D | 7377 | 597 | 8.092721% |
Noise dominated data is calculated using 1-second bins in cleaned event files. If a bin has >2000 counts, and if more than 50% of those come from <1% of pixels, then it is considered to be noise-dominated and hence unusable.
| Quadrant | # 1 sec bins | Bins with >0 counts | Bins with >2000 counts | High rate bins dominated by noise | Noise dominated (total time) | Noise dominated (detector-on time) | Marked lightcurve |
|---|---|---|---|---|---|---|---|
| A | 8736 | 7378 | 0 | 0 | 0.00% | 0.00% | 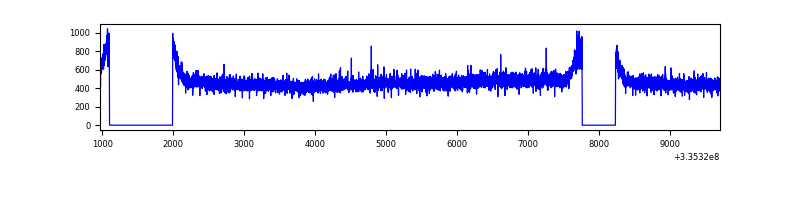 |
| B | 8737 | 7379 | 13 | 13 | 0.15% | 0.18% | 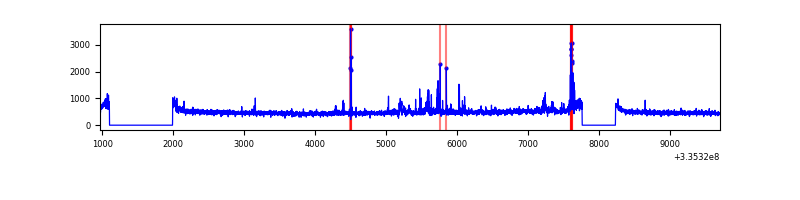 |
| C | 8737 | 7379 | 24 | 24 | 0.27% | 0.33% | 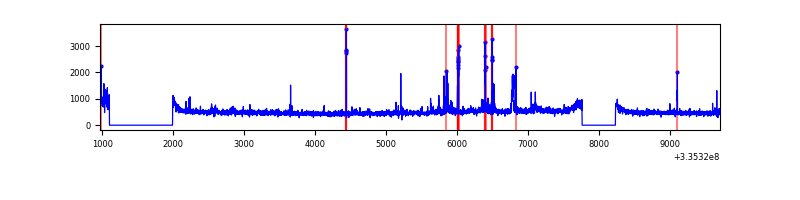 |
| D | 8737 | 7379 | 443 | 443 | 5.07% | 6.00% | 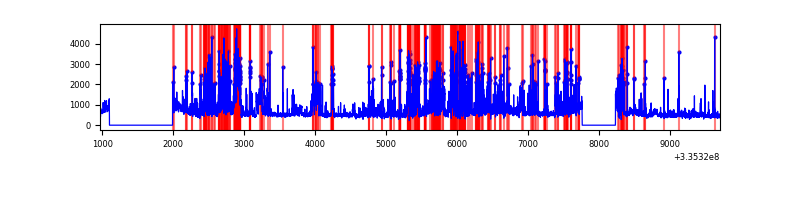 |
Top three noisy pixels from each quadrant. If the there are fewer than three noisy pixels in the level2.evt file, extra rows are filled as -1
| Pixel properties | Quadrant properties | ||||||
|---|---|---|---|---|---|---|---|
| Quadrant | DetID | PixID | Counts | Sigma | Mean | Median | Sigma |
| A | 13 | 254 | 12157 | 62.51 | 900 | 880 | 180.4 |
| A | 12 | 189 | 9061 | 45.35 | 900 | 880 | 180.4 |
| A | 3 | 137 | 8207 | 40.61 | 900 | 880 | 180.4 |
| B | 0 | 244 | 59614 | 341.13 | 902 | 880 | 172.2 |
| B | 5 | 172 | 56788 | 324.72 | 902 | 880 | 172.2 |
| B | 0 | 190 | 23097 | 129.04 | 902 | 880 | 172.2 |
| C | 3 | 233 | 292118 | 1426.37 | 871 | 874 | 204.2 |
| C | 14 | 238 | 138365 | 673.36 | 871 | 874 | 204.2 |
| C | 2 | 16 | 30107 | 143.17 | 871 | 874 | 204.2 |
| D | 1 | 52 | 1823604 | 8975.71 | 855 | 835 | 203.1 |
| D | 15 | 0 | 353547 | 1736.83 | 855 | 835 | 203.1 |
| D | 7 | 80 | 280378 | 1376.53 | 855 | 835 | 203.1 |
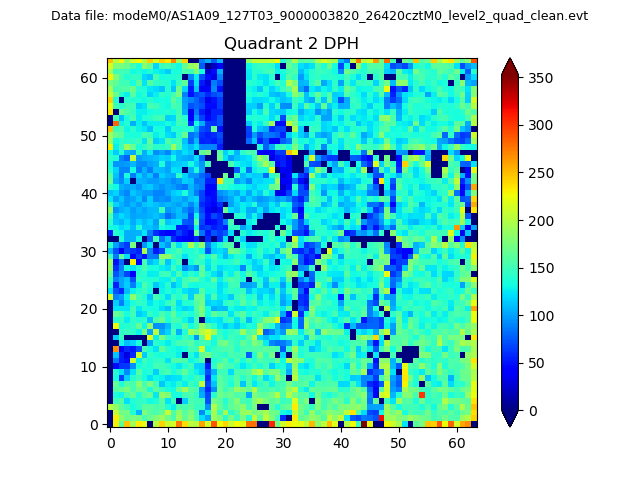
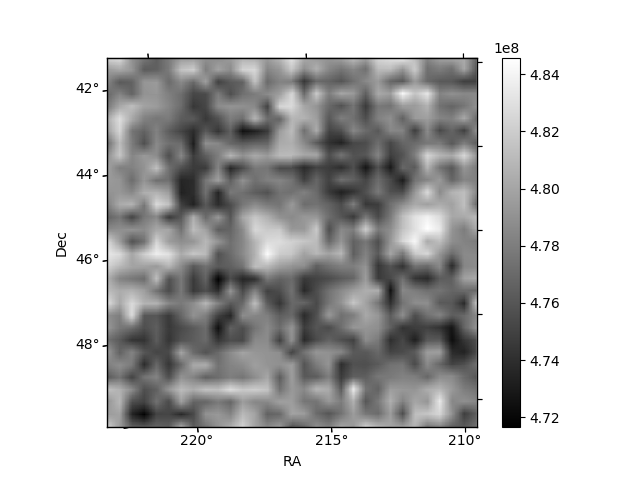
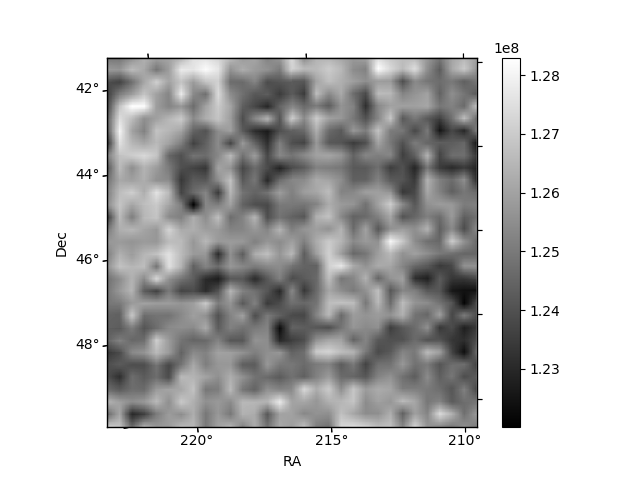
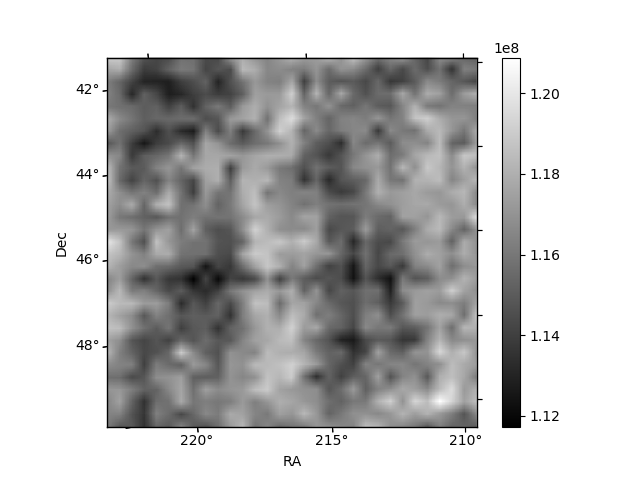
Histogram calculated using DETX and DETY for each event in the final _common_clean file
| Quadrant A | 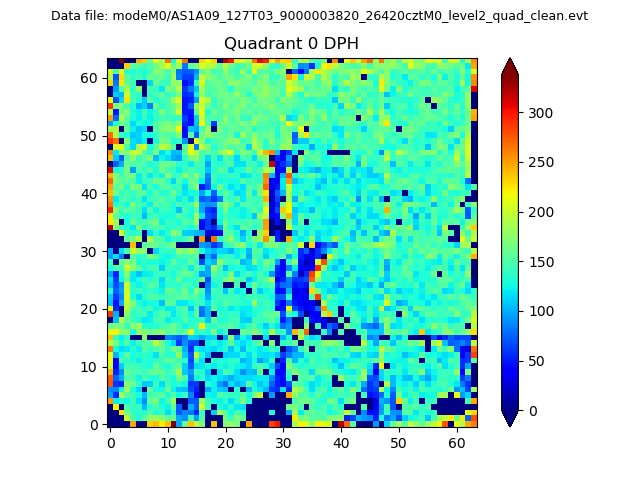 |
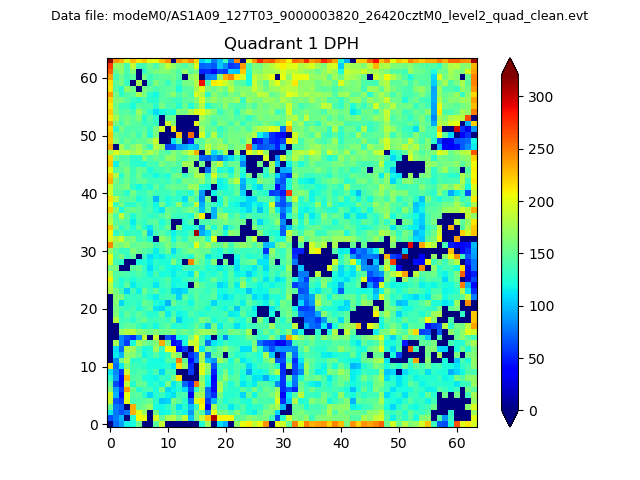 |
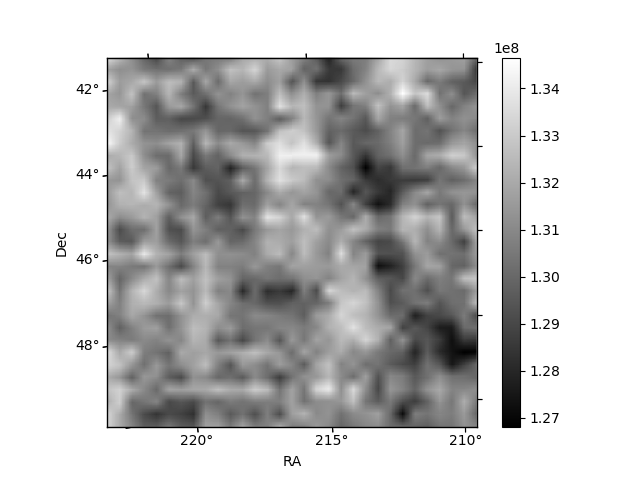
Quadrant B |
|---|---|---|---|
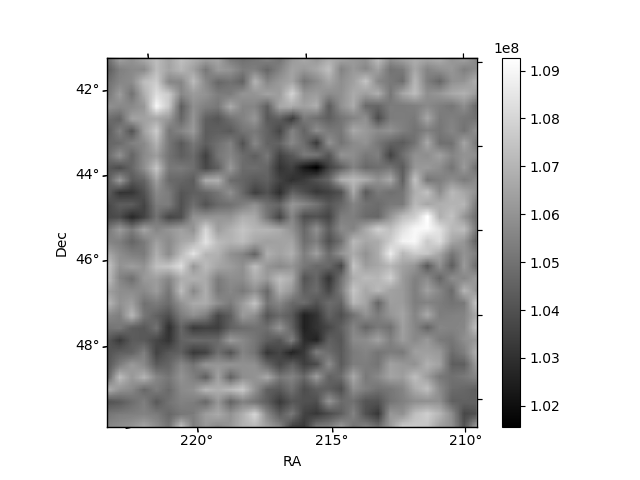
| Quadrant D | 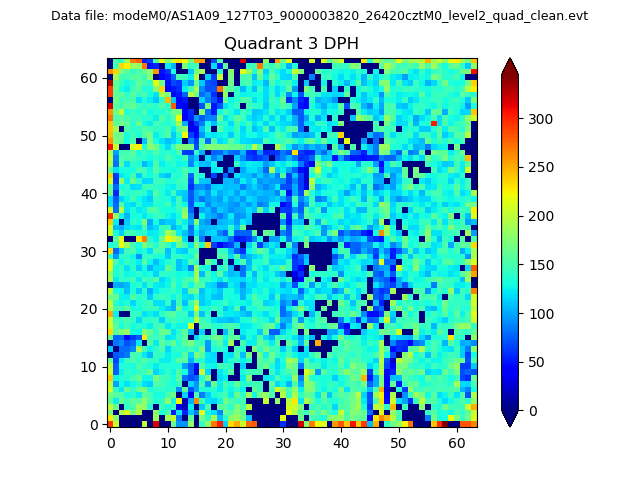 |
 |
Quadrant C |
| Plot type | Count rate plots | Images |
|---|---|---|
| Comparison with Poisson distribution Blue bars denote a histogram of data divided into 1 sec bins. Red curve is a Poisson curve with rate = median count rate of data. |
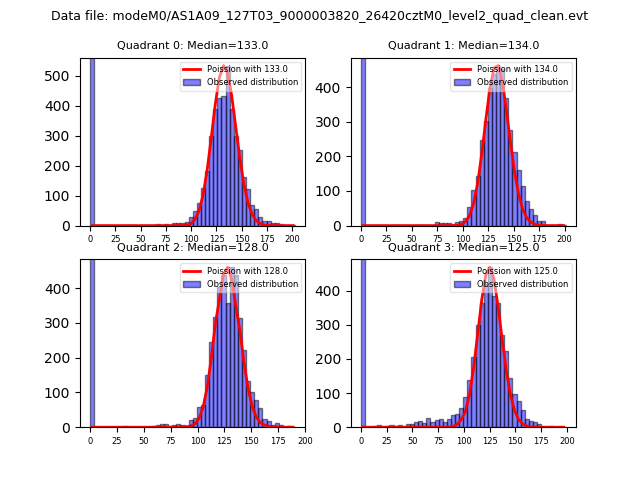 |
 |
| Quadrant-wise count rates Data is divided into 100 sec bins |
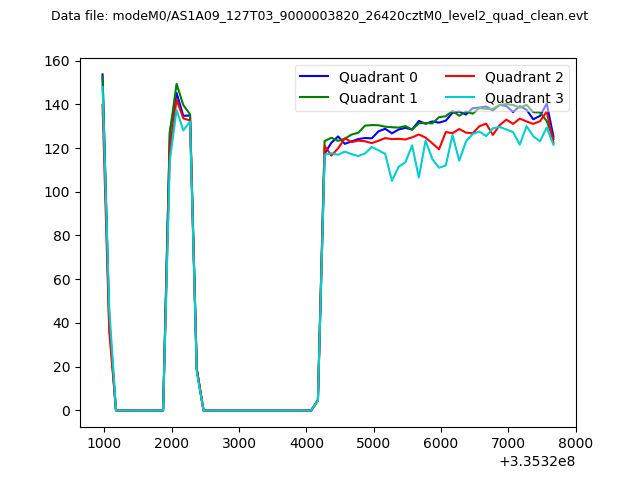 |
|
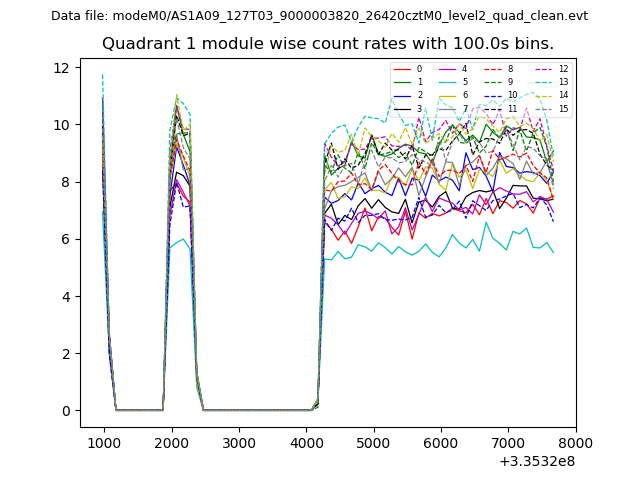
| Module-wise count rates for Quadrant A Data is divided into 100 sec bins |
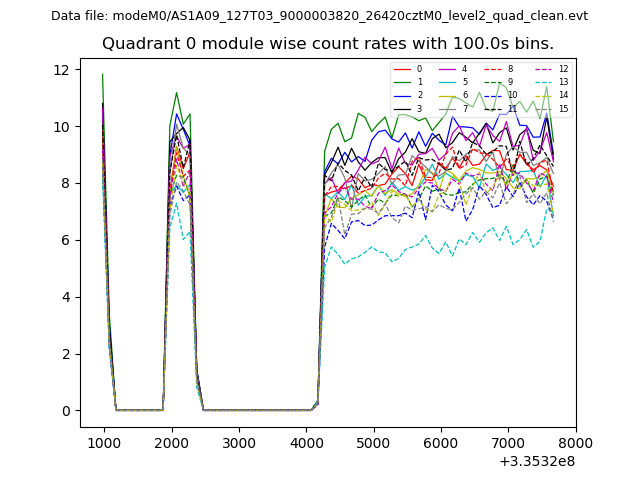 |
 |
| Module-wise count rates for Quadrant B Data is divided into 100 sec bins |
 |
 |
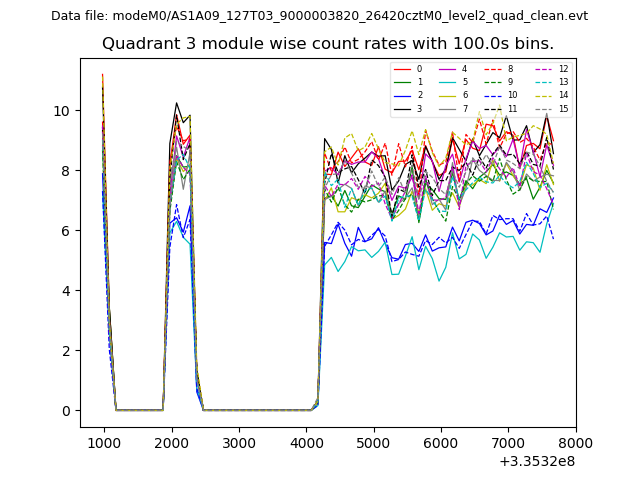
| Module-wise count rates for Quadrant C Data is divided into 100 sec bins |
 |
 |
| Module-wise count rates for Quadrant D Data is divided into 100 sec bins |
 |
 |
| Parameter | Plot |
|---|---|
| CZT HV Monitor | 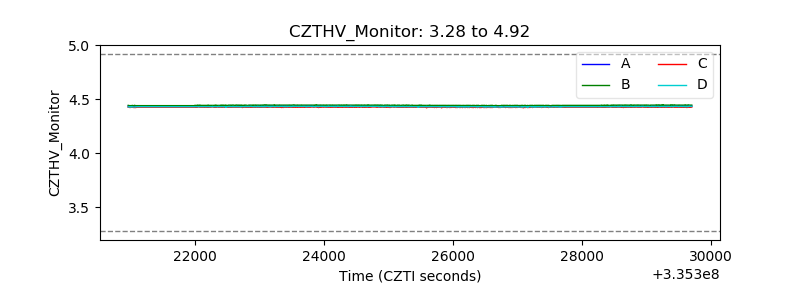 |
| D_VDD | 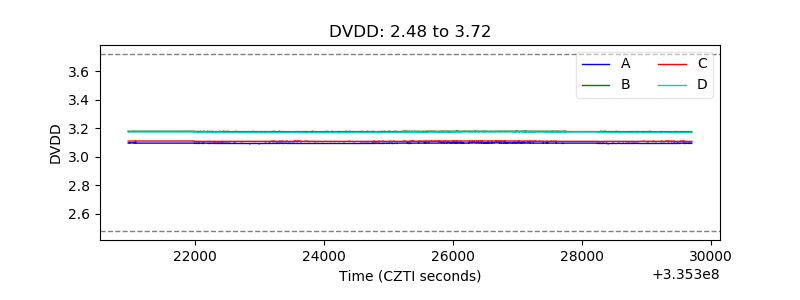 |
| Temperature 1 | 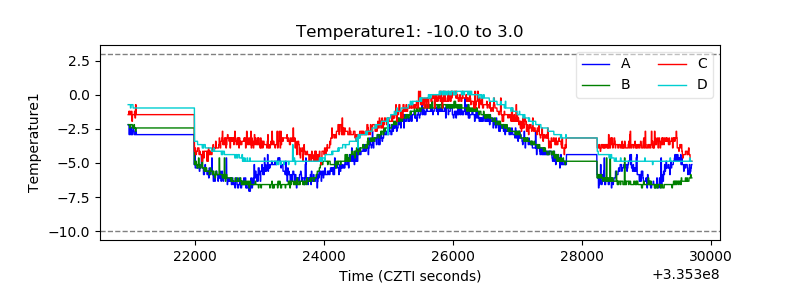 |
| Veto HV Monitor | 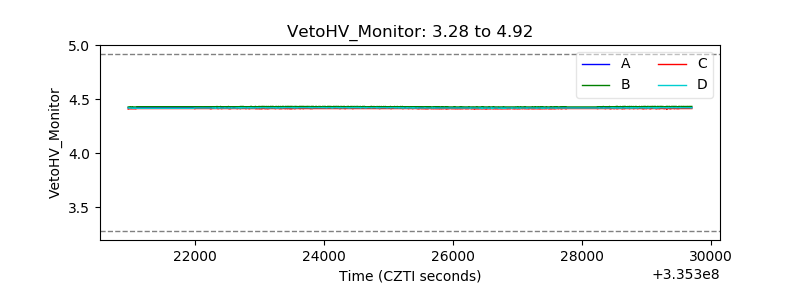 |
| Veto LLD | 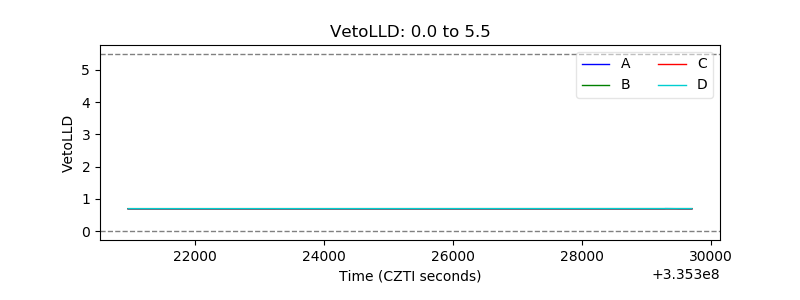 |
| Alpha Counter | 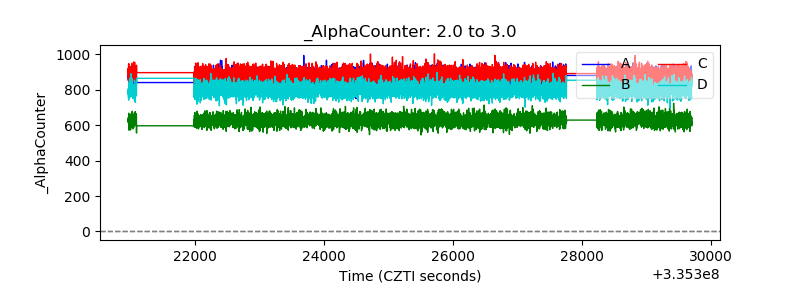 |
| _CPM_Rate | 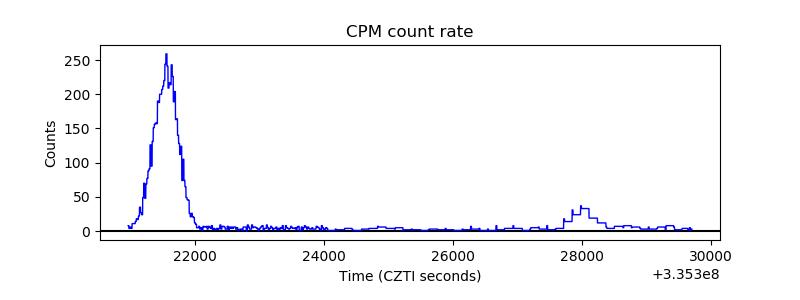 |
| CZT Counter | 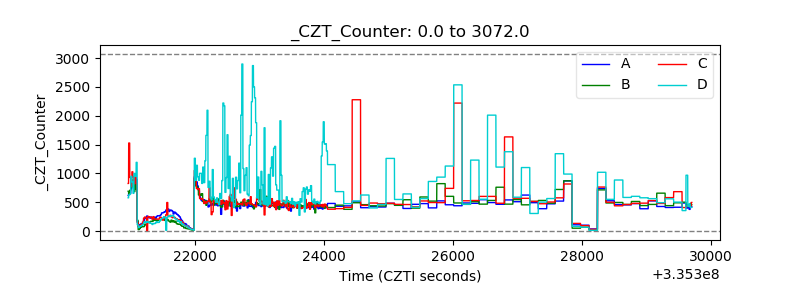 |
| +2.5 Volts monitor | 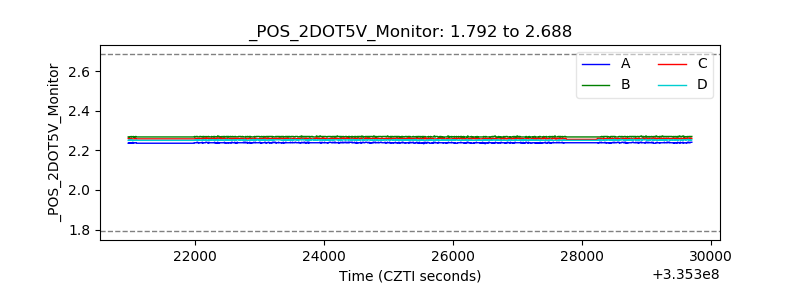 |
| +5 Volts monitor |  |
| _ROLL_ROT | 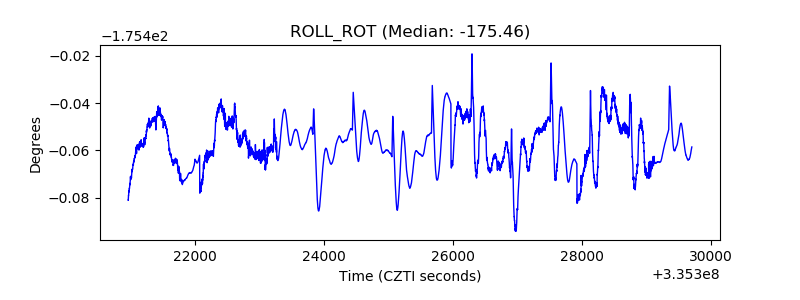 |
| _Roll_DEC | 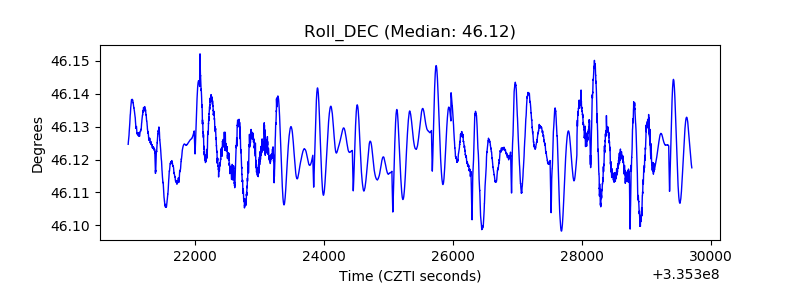 |
| _Roll_RA | 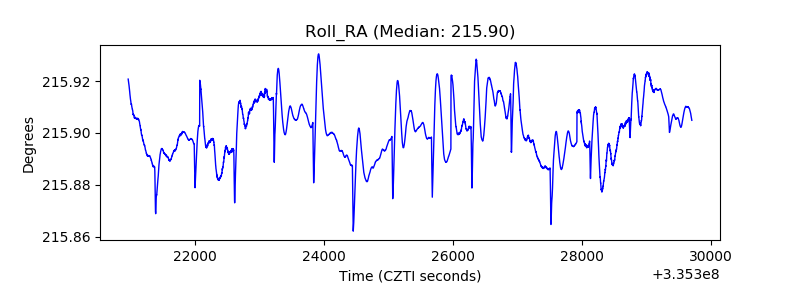 |
| Veto Counter | 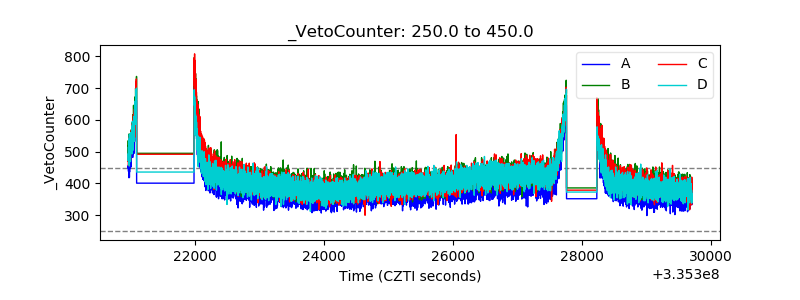 |