| Param | Original file | Final file |
|---|---|---|
| Filename | modeM0/AS1A09_127T03_9000003820_26421cztM0_level2.evt | modeM0/AS1A09_127T03_9000003820_26421cztM0_level2_quad_clean.evt |
| Size (bytes) | 541,054,080 | 83,361,600 |
| Size | 516.0 MB | 79.5 MB |
| Events in quadrant A | 3,400,802 | 514,765 |
| Events in quadrant B | 3,642,642 | 522,226 |
| Events in quadrant C | 3,723,576 | 493,956 |
| Events in quadrant D | 5,119,723 | 481,510 |
| Mode M0 | |||
|---|---|---|---|
| Quadrant | BADHDUFLAG | Total packets | Discarded packets |
| A | 0 | 15023 | 0 |
| B | 0 | 15631 | 0 |
| C | 0 | 15728 | 0 |
| D | 0 | 20093 | 0 |
| Mode M9 | |||
|---|---|---|---|
| Quadrant | BADHDUFLAG | Total packets | Discarded packets |
| A | 0 | 2 | 0 |
| B | 0 | 2 | 0 |
| C | 0 | 2 | 0 |
| D | 0 | 2 | 0 |
| Quadrant | Total seconds | Saturated seconds | Saturation percentage |
|---|---|---|---|
| A | 7355 | 129 | 1.753909% |
| B | 7355 | 166 | 2.256968% |
| C | 7355 | 204 | 2.773623% |
| D | 7356 | 381 | 5.179445% |
Noise dominated data is calculated using 1-second bins in cleaned event files. If a bin has >2000 counts, and if more than 50% of those come from <1% of pixels, then it is considered to be noise-dominated and hence unusable.
| Quadrant | # 1 sec bins | Bins with >0 counts | Bins with >2000 counts | High rate bins dominated by noise | Noise dominated (total time) | Noise dominated (detector-on time) | Marked lightcurve |
|---|---|---|---|---|---|---|---|
| A | 7545 | 7356 | 0 | 0 | 0.00% | 0.00% | 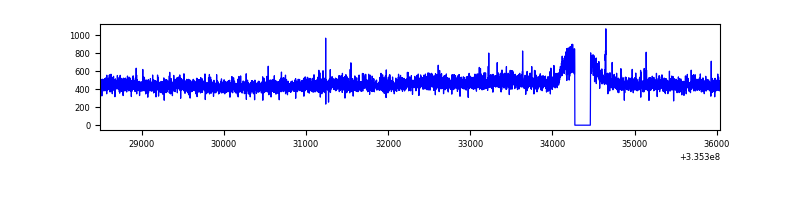 |
| B | 7545 | 7356 | 9 | 9 | 0.12% | 0.12% | 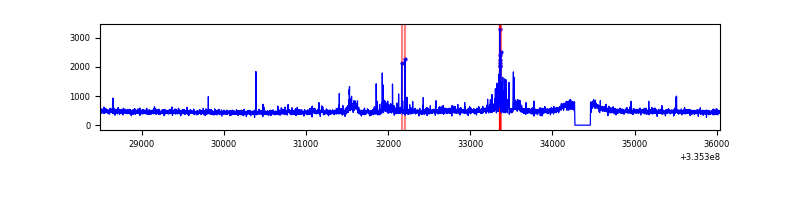 |
| C | 7545 | 7356 | 45 | 45 | 0.60% | 0.61% | 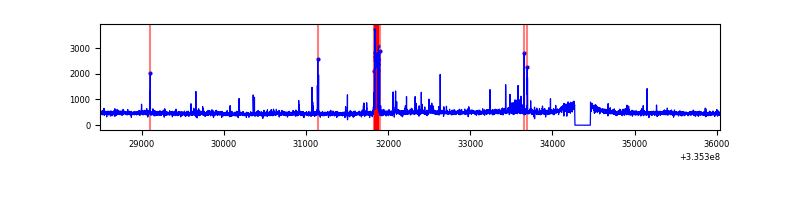 |
| D | 7546 | 7357 | 246 | 246 | 3.26% | 3.34% | 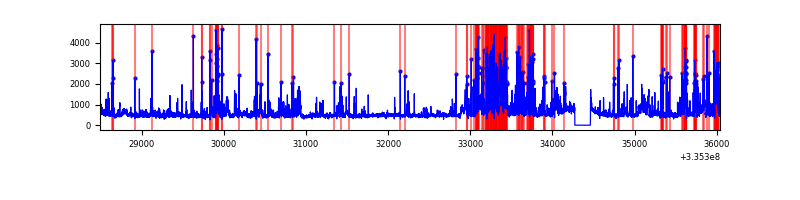 |
Top three noisy pixels from each quadrant. If the there are fewer than three noisy pixels in the level2.evt file, extra rows are filled as -1
| Pixel properties | Quadrant properties | ||||||
|---|---|---|---|---|---|---|---|
| Quadrant | DetID | PixID | Counts | Sigma | Mean | Median | Sigma |
| A | 12 | 189 | 14894 | 80.1 | 876 | 856 | 175.3 |
| A | 13 | 254 | 10990 | 57.82 | 876 | 856 | 175.3 |
| A | 3 | 137 | 8186 | 41.82 | 876 | 856 | 175.3 |
| B | 0 | 189 | 67887 | 400.61 | 877 | 856 | 167.3 |
| B | 5 | 172 | 53792 | 316.37 | 877 | 856 | 167.3 |
| B | 0 | 244 | 36806 | 214.86 | 877 | 856 | 167.3 |
| C | 4 | 254 | 158284 | 794.08 | 844 | 849 | 198.3 |
| C | 14 | 238 | 133467 | 668.91 | 844 | 849 | 198.3 |
| C | 2 | 16 | 66453 | 330.9 | 844 | 849 | 198.3 |
| D | 1 | 52 | 1410221 | 6969.47 | 841 | 819 | 202.2 |
| D | 12 | 233 | 158785 | 781.14 | 841 | 819 | 202.2 |
| D | 7 | 80 | 151040 | 742.84 | 841 | 819 | 202.2 |
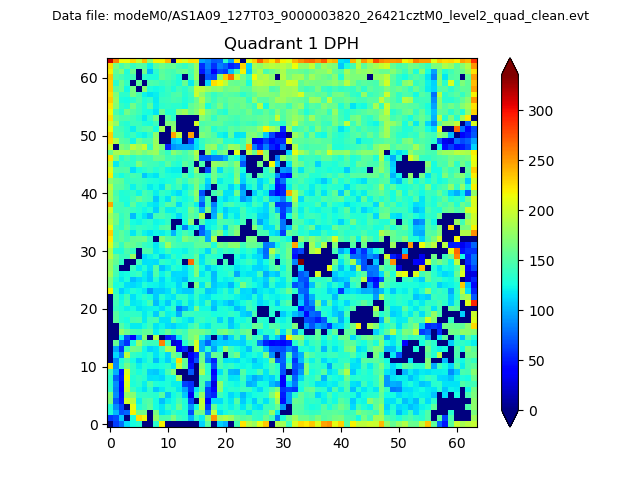
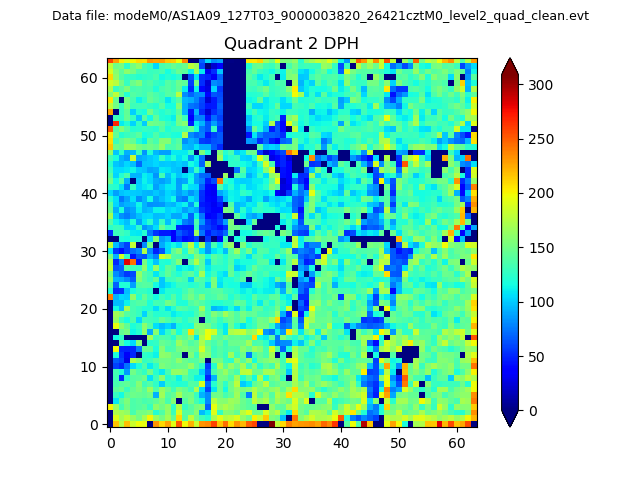
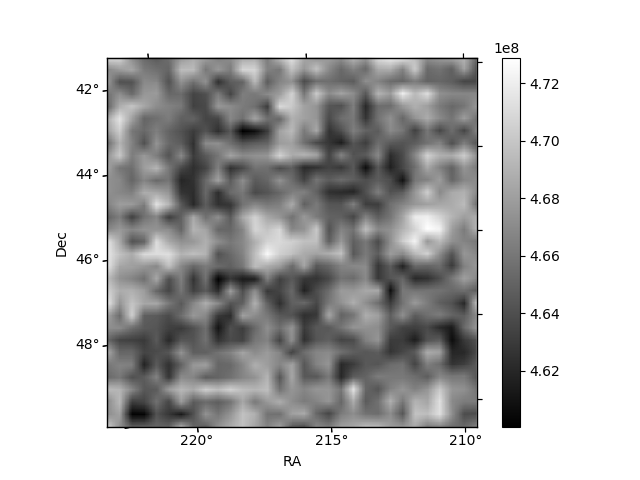
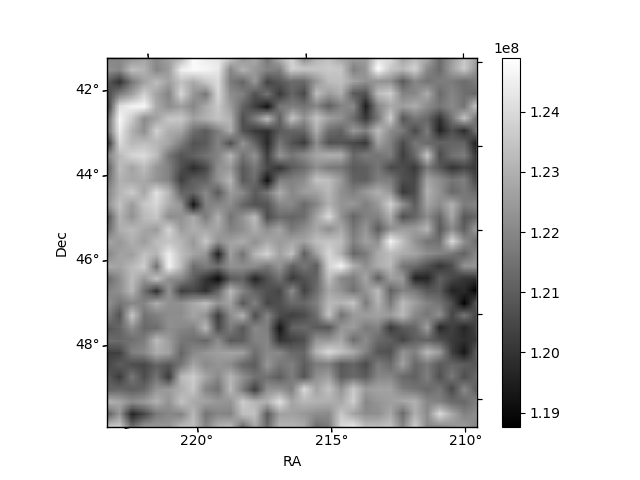
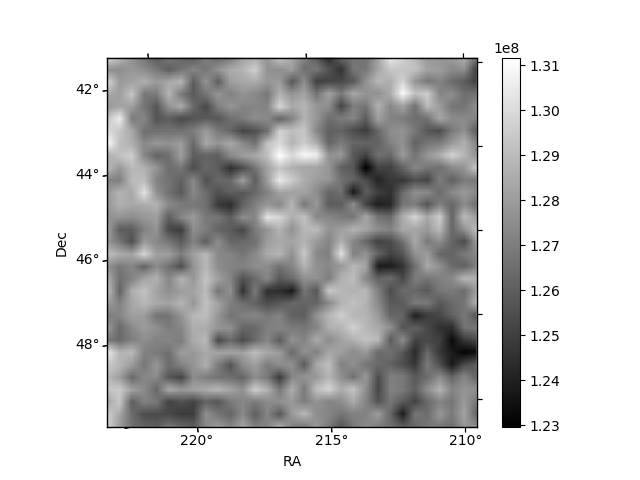
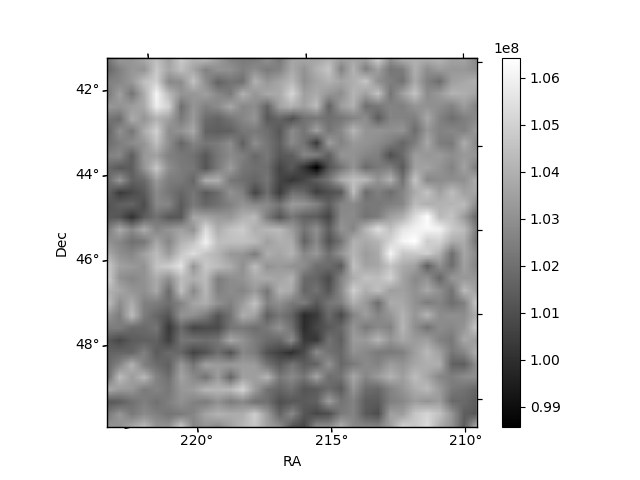
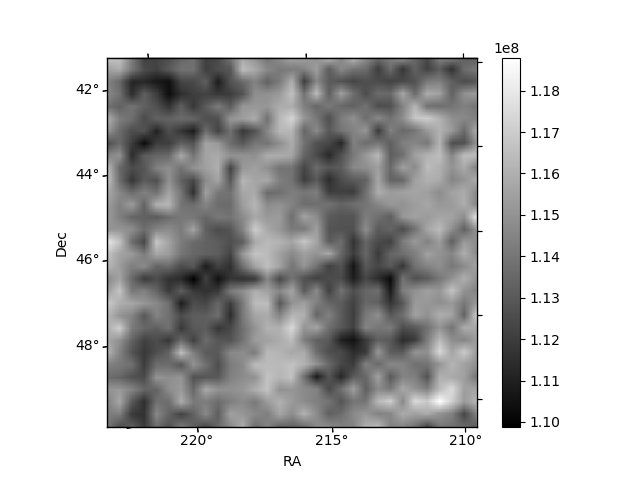
Histogram calculated using DETX and DETY for each event in the final _common_clean file
| Quadrant A |  |
 |
Quadrant B |
|---|---|---|---|
| Quadrant D | 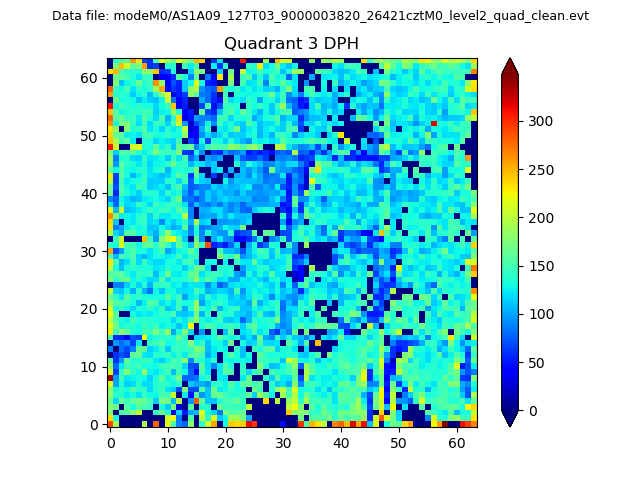 |
 |
Quadrant C |
| Plot type | Count rate plots | Images |
|---|---|---|
| Comparison with Poisson distribution Blue bars denote a histogram of data divided into 1 sec bins. Red curve is a Poisson curve with rate = median count rate of data. |
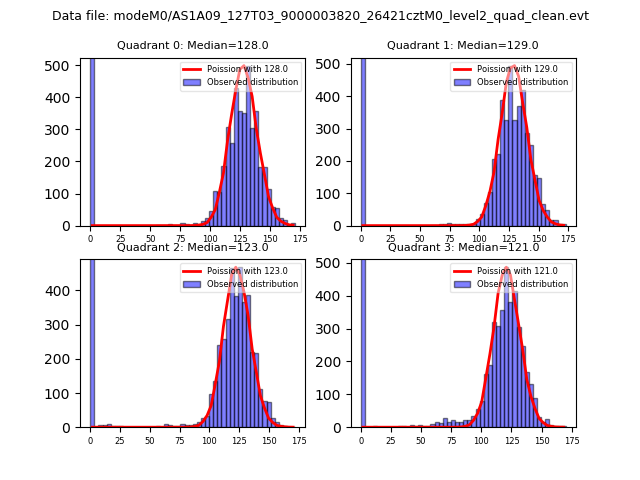 |
 |
| Quadrant-wise count rates Data is divided into 100 sec bins |
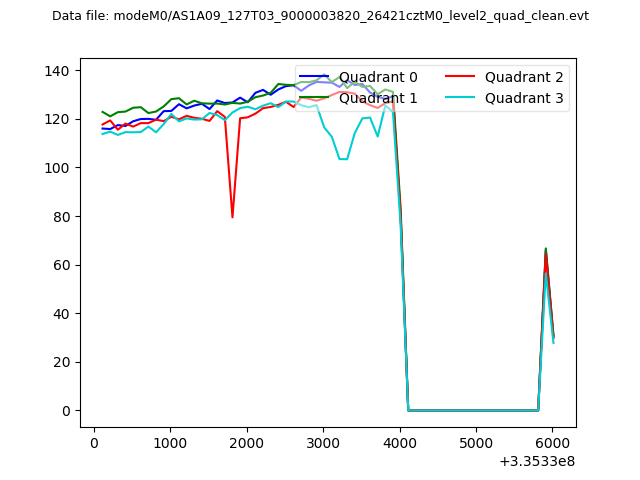 |
|
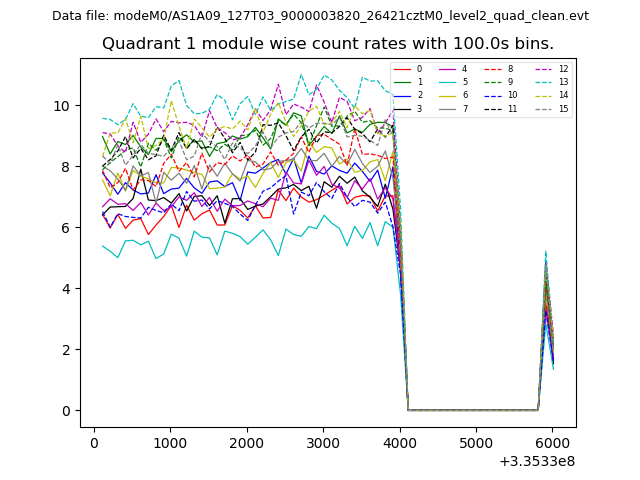
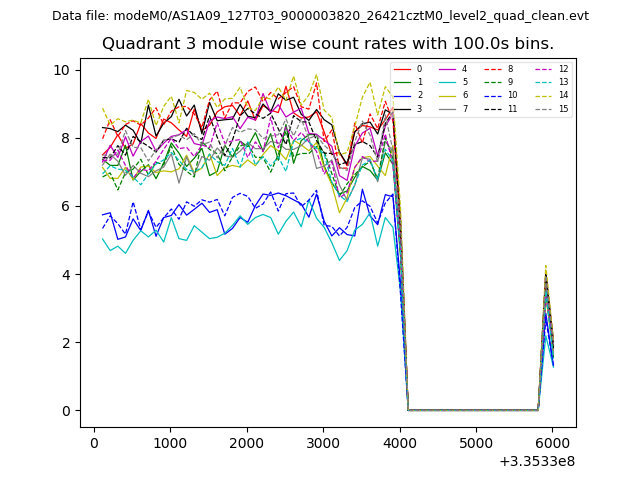
| Module-wise count rates for Quadrant A Data is divided into 100 sec bins |
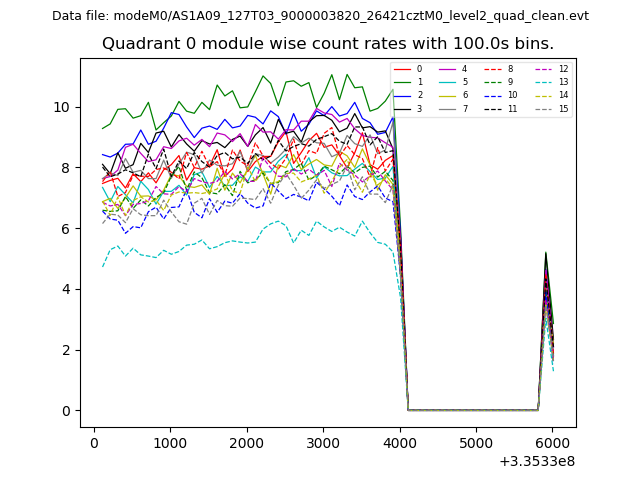 |
 |
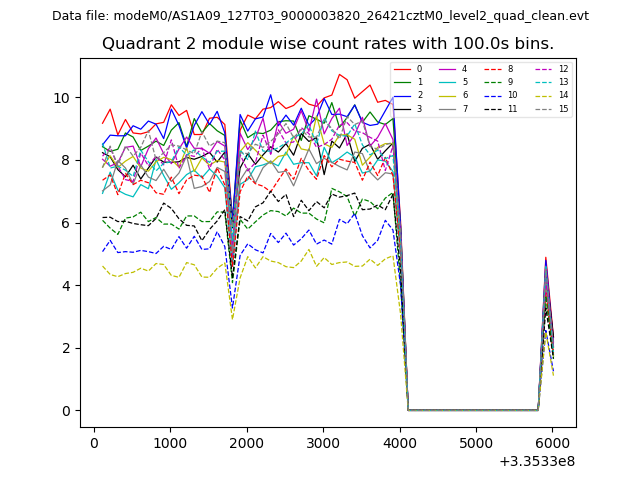
| Module-wise count rates for Quadrant B Data is divided into 100 sec bins |
 |
 |
| Module-wise count rates for Quadrant C Data is divided into 100 sec bins |
 |
 |
| Module-wise count rates for Quadrant D Data is divided into 100 sec bins |
 |
 |
| Parameter | Plot |
|---|---|
| CZT HV Monitor | 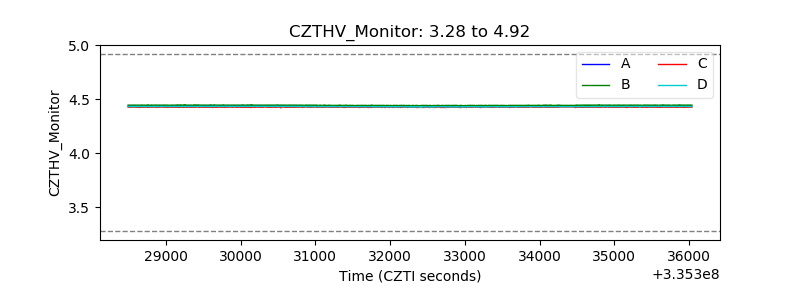 |
| D_VDD | 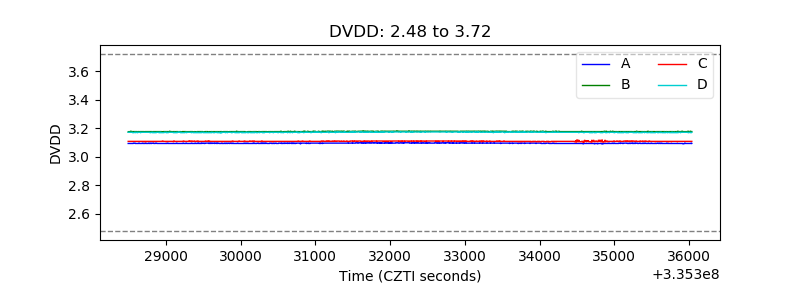 |
| Temperature 1 | 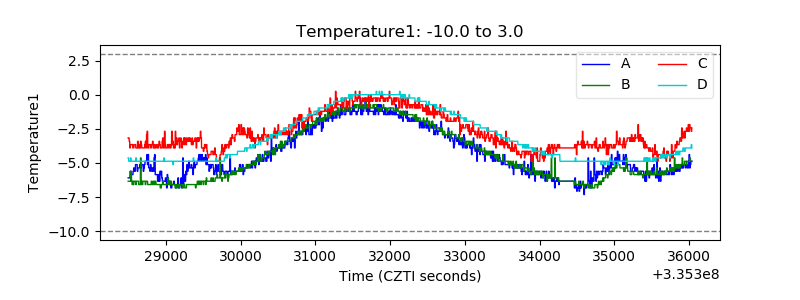 |
| Veto HV Monitor | 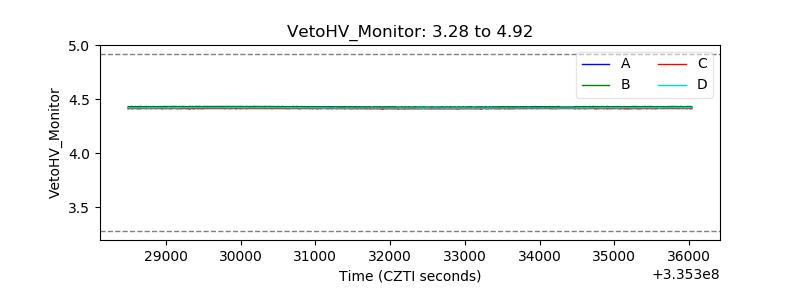 |
| Veto LLD | 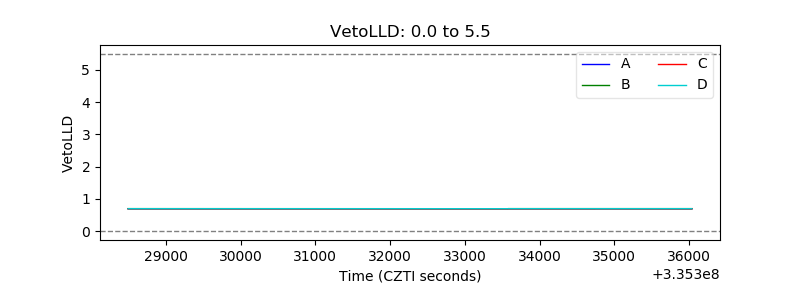 |
| Alpha Counter | 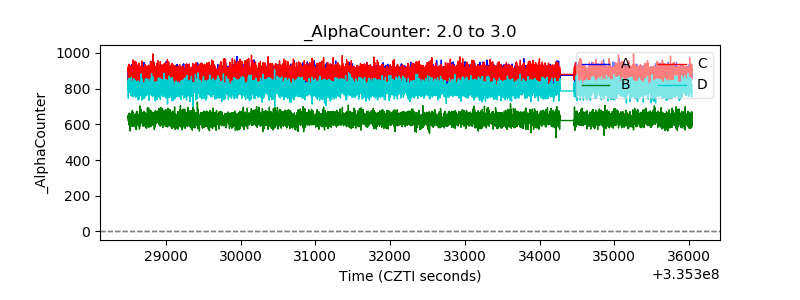 |
| _CPM_Rate |  |
| CZT Counter | 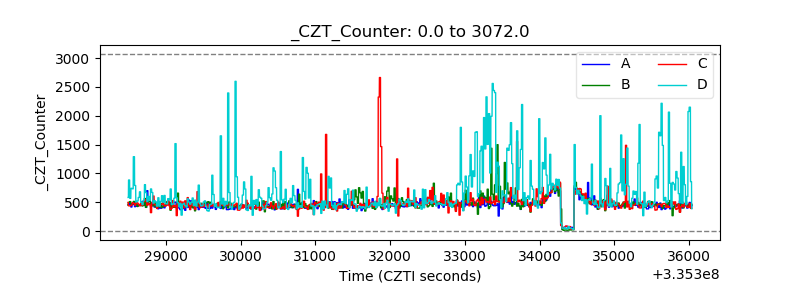 |
| +2.5 Volts monitor | 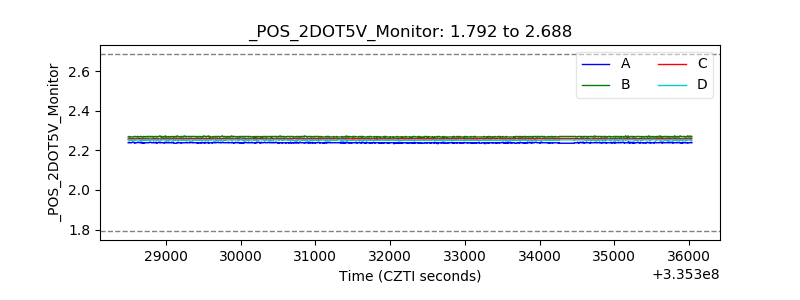 |
| +5 Volts monitor |  |
| _ROLL_ROT | 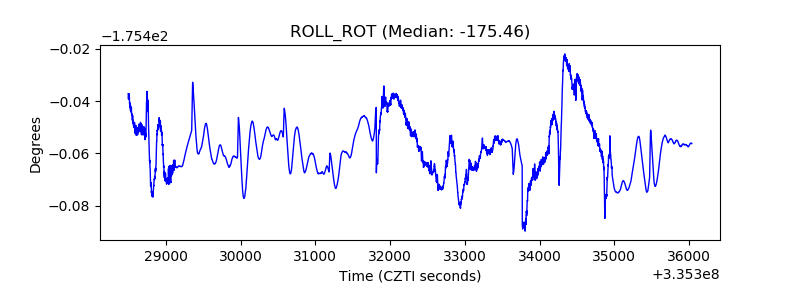 |
| _Roll_DEC |  |
| _Roll_RA | 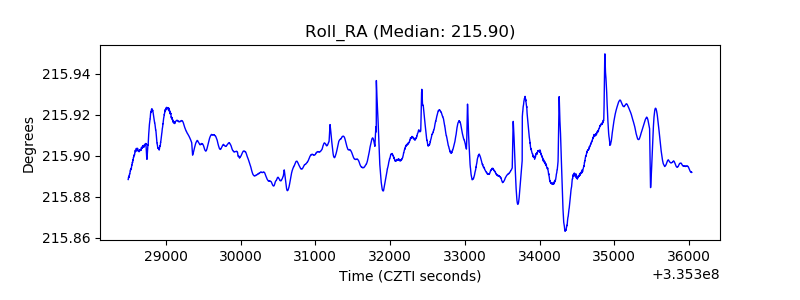 |
| Veto Counter |  |