| Param | Original file | Final file |
|---|---|---|
| Filename | modeM0/AS1A09_127T03_9000003820_26422cztM0_level2.evt | modeM0/AS1A09_127T03_9000003820_26422cztM0_level2_quad_clean.evt |
| Size (bytes) | 580,135,680 | 92,044,800 |
| Size | 553.3 MB | 87.8 MB |
| Events in quadrant A | 3,608,296 | 574,777 |
| Events in quadrant B | 3,780,395 | 584,253 |
| Events in quadrant C | 3,971,452 | 558,306 |
| Events in quadrant D | 5,685,592 | 533,304 |
| Mode M0 | |||
|---|---|---|---|
| Quadrant | BADHDUFLAG | Total packets | Discarded packets |
| A | 0 | 15812 | 0 |
| B | 0 | 16149 | 0 |
| C | 0 | 16584 | 0 |
| D | 0 | 22081 | 0 |
| Mode M9 | |||
|---|---|---|---|
| Quadrant | BADHDUFLAG | Total packets | Discarded packets |
| A | 0 | 5 | 0 |
| B | 0 | 5 | 0 |
| C | 0 | 5 | 0 |
| D | 0 | 5 | 0 |
| Quadrant | Total seconds | Saturated seconds | Saturation percentage |
|---|---|---|---|
| A | 7717 | 162 | 2.099261% |
| B | 7718 | 203 | 2.630215% |
| C | 7718 | 227 | 2.941176% |
| D | 7718 | 494 | 6.400622% |
Noise dominated data is calculated using 1-second bins in cleaned event files. If a bin has >2000 counts, and if more than 50% of those come from <1% of pixels, then it is considered to be noise-dominated and hence unusable.
| Quadrant | # 1 sec bins | Bins with >0 counts | Bins with >2000 counts | High rate bins dominated by noise | Noise dominated (total time) | Noise dominated (detector-on time) | Marked lightcurve |
|---|---|---|---|---|---|---|---|
| A | 8227 | 7719 | 0 | 0 | 0.00% | 0.00% | 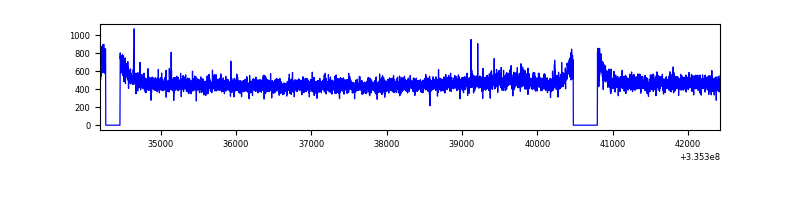 |
| B | 8228 | 7720 | 5 | 5 | 0.06% | 0.06% | 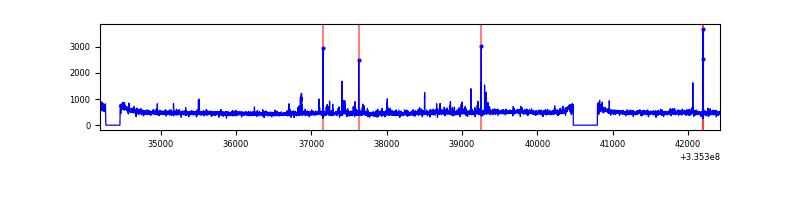 |
| C | 8228 | 7720 | 17 | 17 | 0.21% | 0.22% | 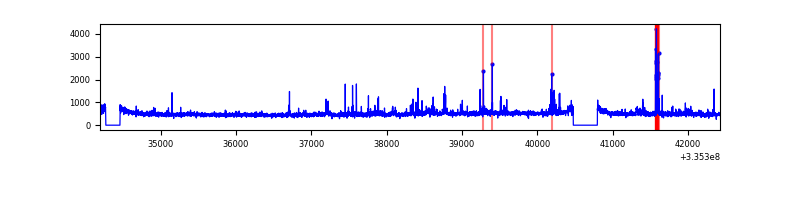 |
| D | 8228 | 7720 | 288 | 288 | 3.50% | 3.73% | 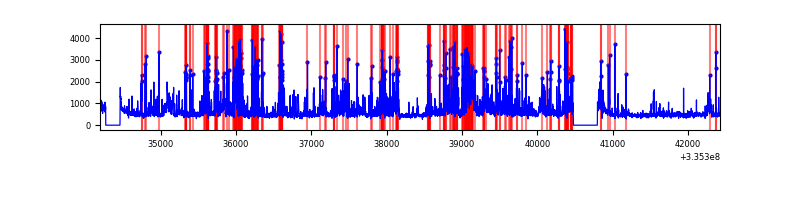 |
Top three noisy pixels from each quadrant. If the there are fewer than three noisy pixels in the level2.evt file, extra rows are filled as -1
| Pixel properties | Quadrant properties | ||||||
|---|---|---|---|---|---|---|---|
| Quadrant | DetID | PixID | Counts | Sigma | Mean | Median | Sigma |
| A | 12 | 189 | 16715 | 84.9 | 929 | 906 | 186.2 |
| A | 13 | 254 | 12519 | 62.37 | 929 | 906 | 186.2 |
| A | 3 | 137 | 8768 | 42.22 | 929 | 906 | 186.2 |
| B | 15 | 32 | 31136 | 171.27 | 927 | 903 | 176.5 |
| B | 5 | 172 | 30771 | 169.2 | 927 | 903 | 176.5 |
| B | 0 | 189 | 29737 | 163.34 | 927 | 903 | 176.5 |
| C | 3 | 233 | 168233 | 797.49 | 893 | 900 | 209.8 |
| C | 14 | 238 | 143160 | 678.0 | 893 | 900 | 209.8 |
| C | 4 | 254 | 111874 | 528.89 | 893 | 900 | 209.8 |
| D | 1 | 52 | 1501189 | 7063.6 | 885 | 860 | 212.4 |
| D | 12 | 233 | 539795 | 2537.33 | 885 | 860 | 212.4 |
| D | 7 | 80 | 179154 | 839.41 | 885 | 860 | 212.4 |
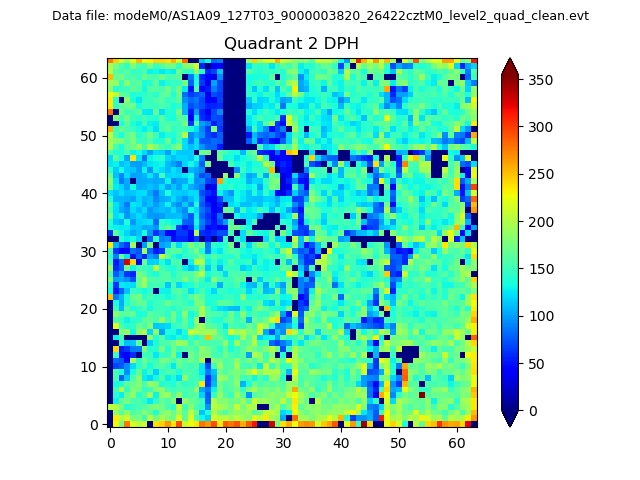
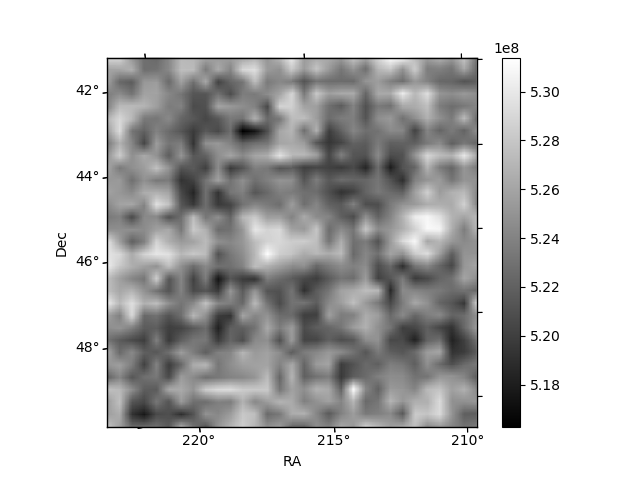
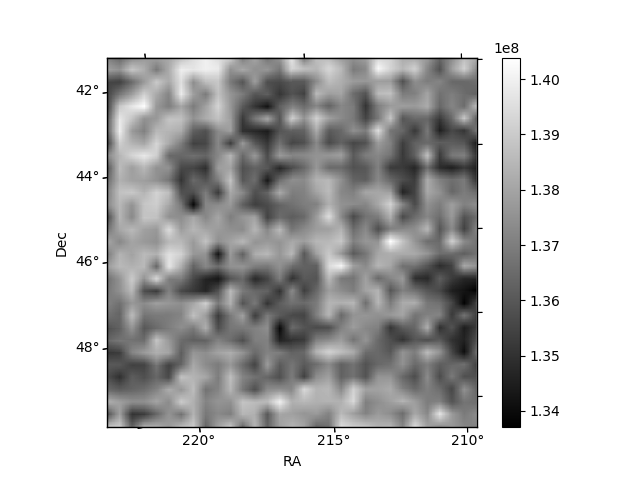
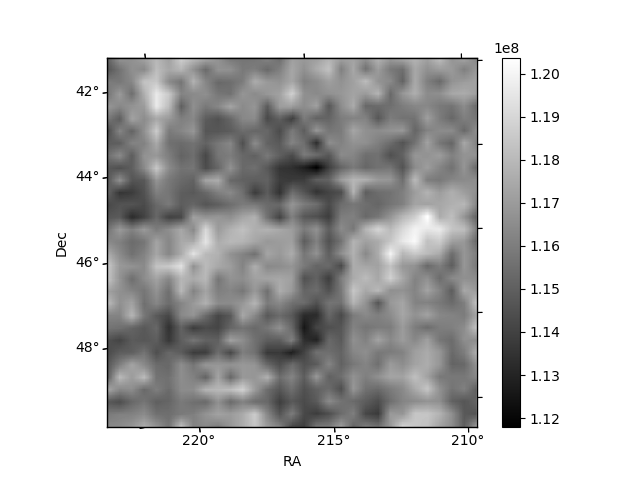
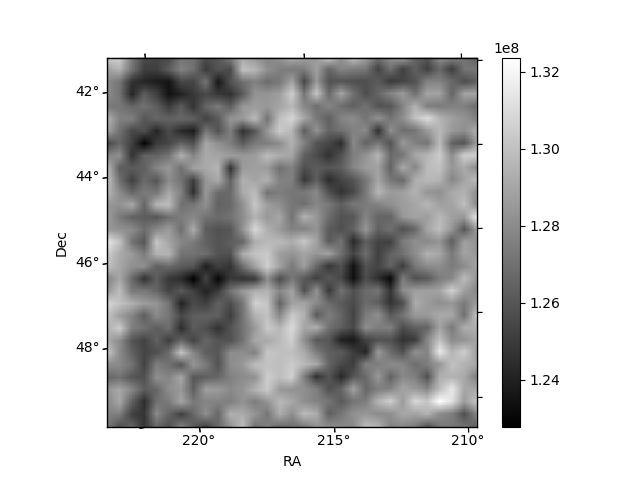
Histogram calculated using DETX and DETY for each event in the final _common_clean file
| Quadrant A | 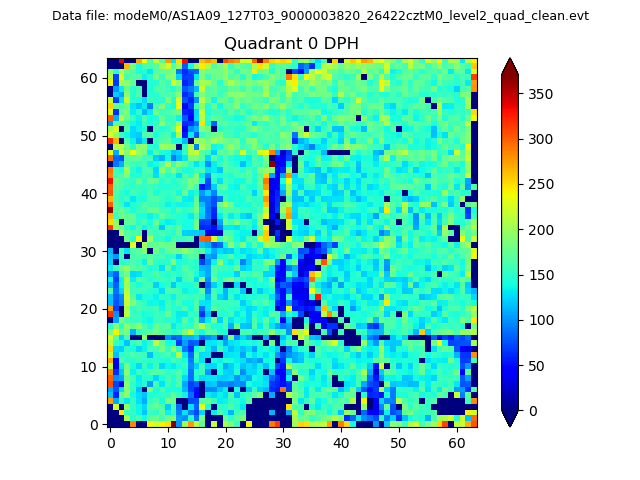 |
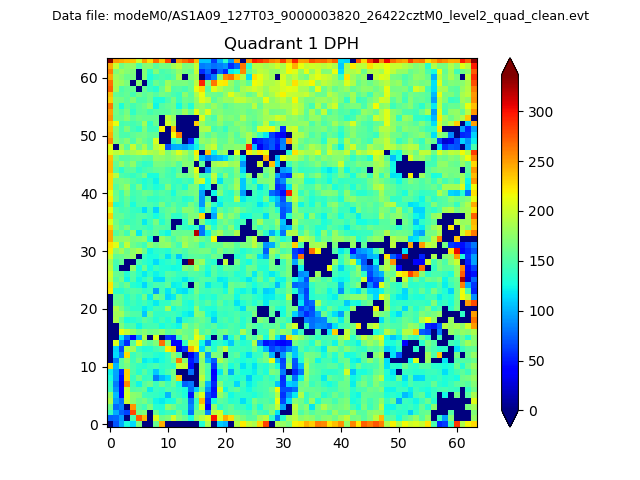 |
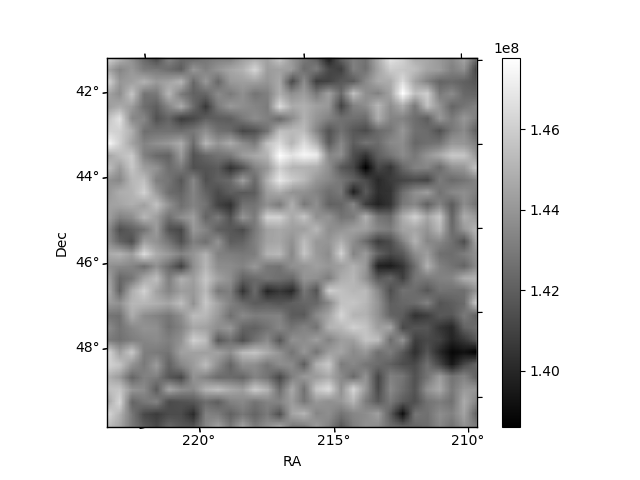
Quadrant B |
|---|---|---|---|
| Quadrant D | 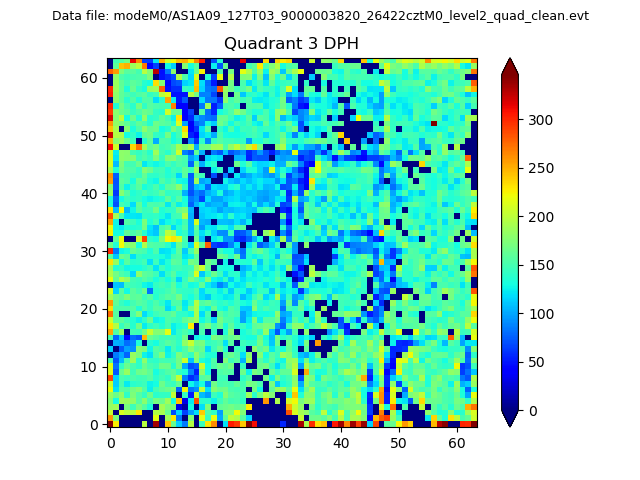 |
 |
Quadrant C |
| Plot type | Count rate plots | Images |
|---|---|---|
| Comparison with Poisson distribution Blue bars denote a histogram of data divided into 1 sec bins. Red curve is a Poisson curve with rate = median count rate of data. |
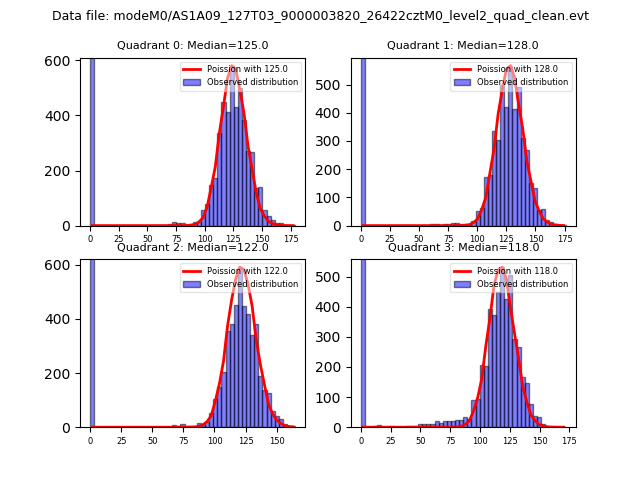 |
 |
| Quadrant-wise count rates Data is divided into 100 sec bins |
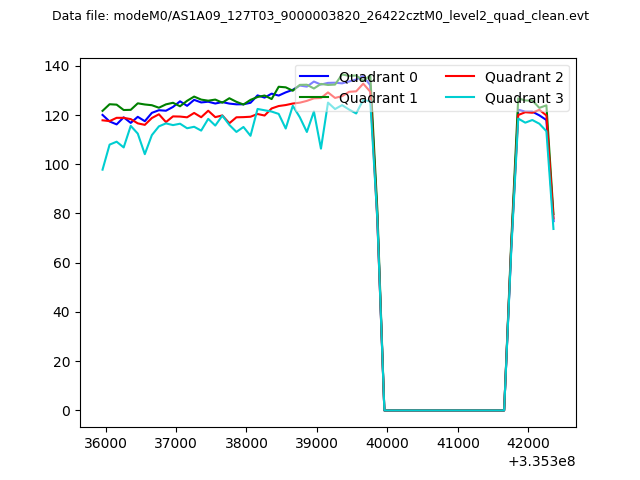 |
|
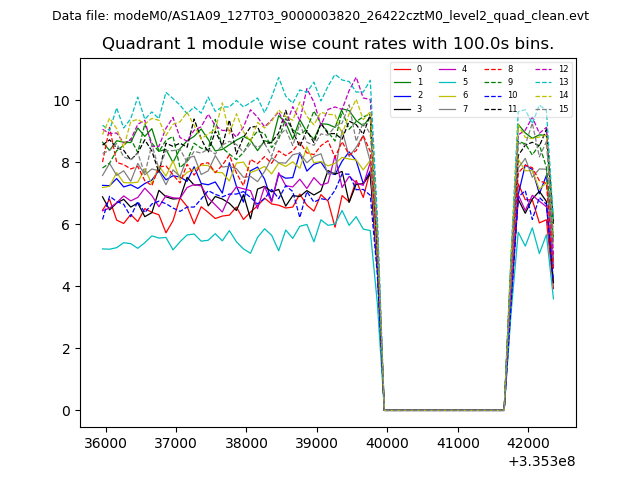
| Module-wise count rates for Quadrant A Data is divided into 100 sec bins |
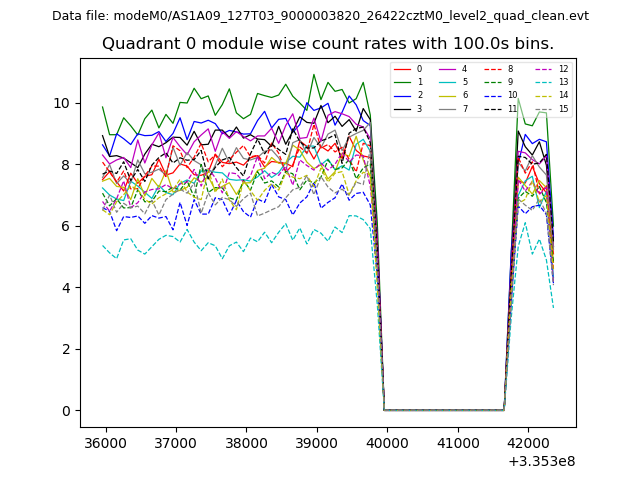 |
 |
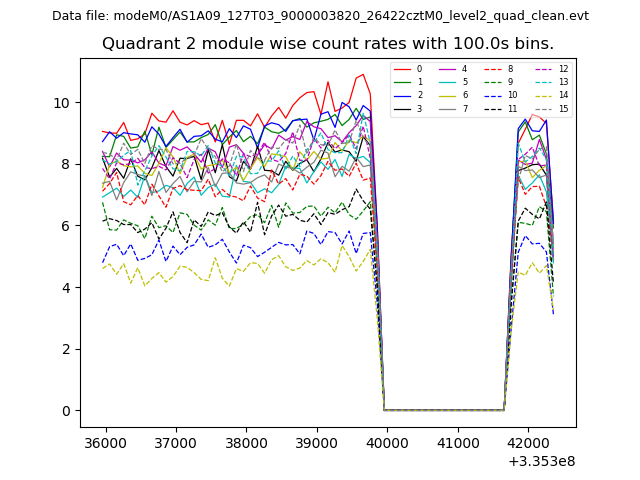
| Module-wise count rates for Quadrant B Data is divided into 100 sec bins |
 |
 |
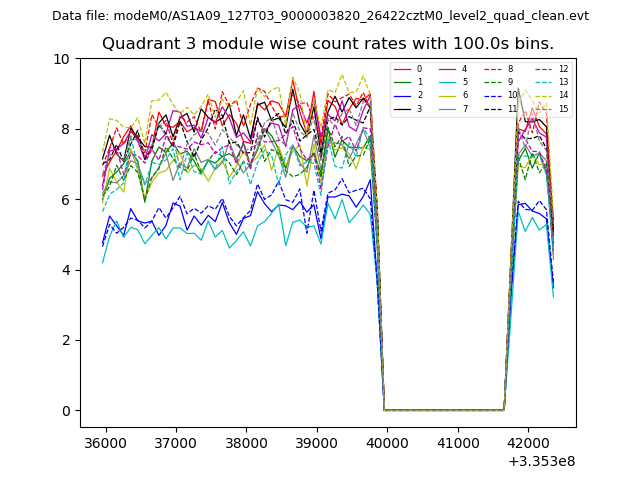
| Module-wise count rates for Quadrant C Data is divided into 100 sec bins |
 |
 |
| Module-wise count rates for Quadrant D Data is divided into 100 sec bins |
 |
 |
| Parameter | Plot |
|---|---|
| CZT HV Monitor | 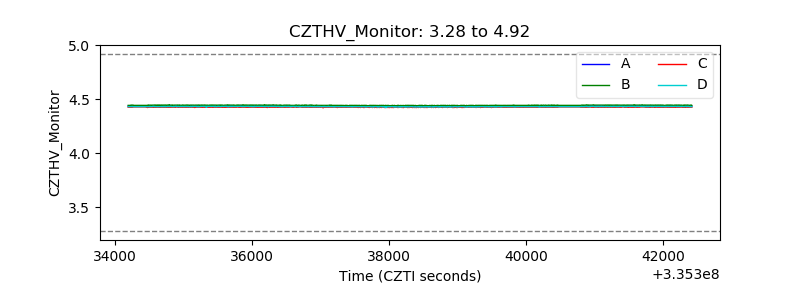 |
| D_VDD | 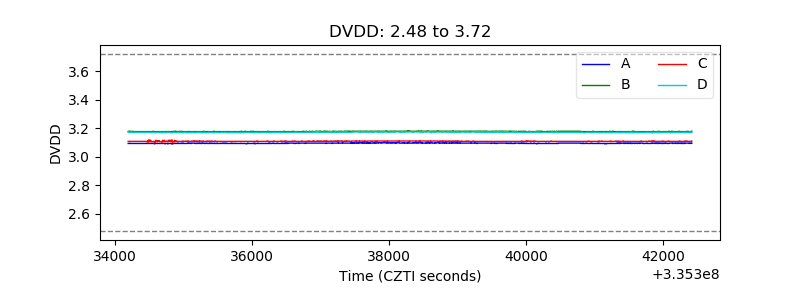 |
| Temperature 1 | 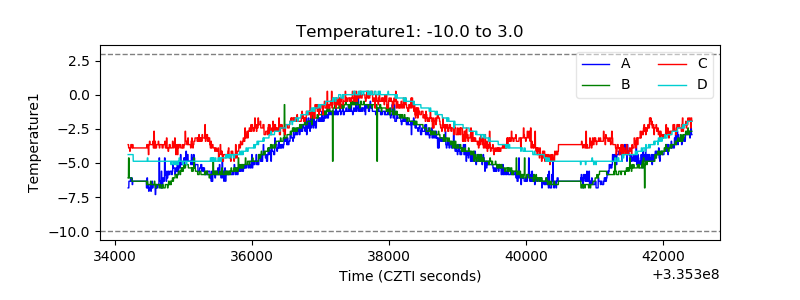 |
| Veto HV Monitor | 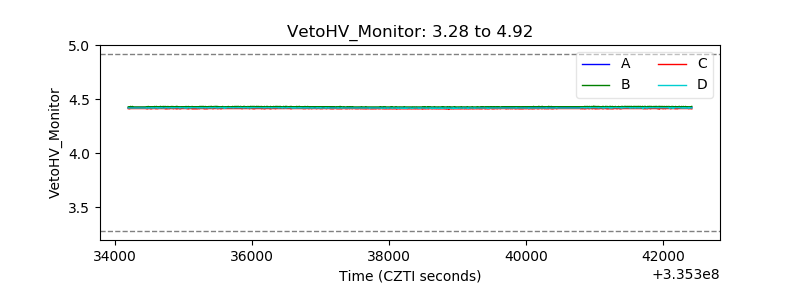 |
| Veto LLD | 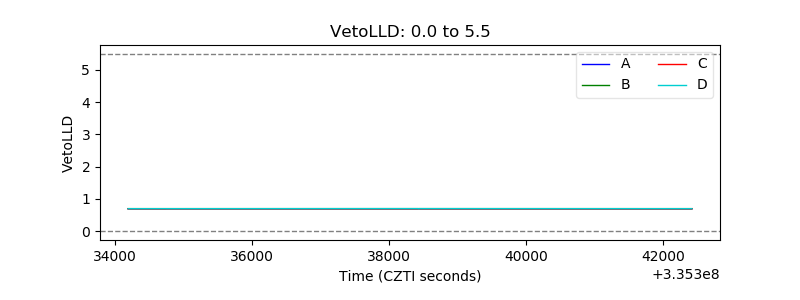 |
| Alpha Counter | 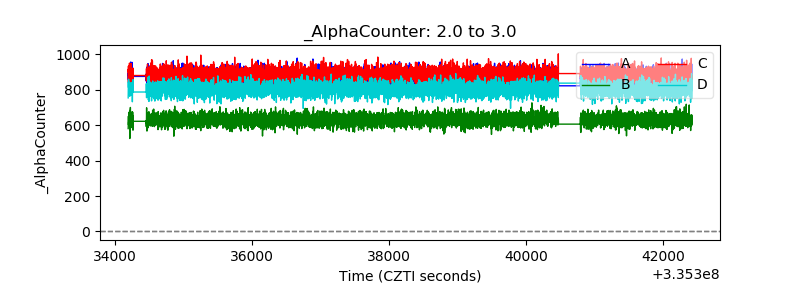 |
| _CPM_Rate | 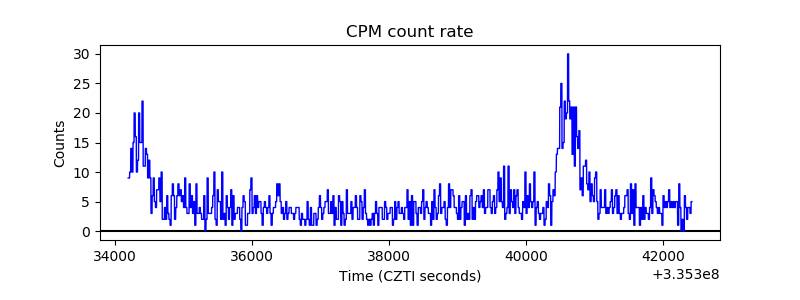 |
| CZT Counter | 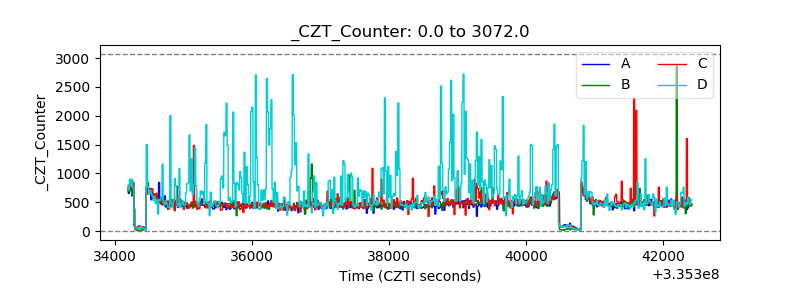 |
| +2.5 Volts monitor | 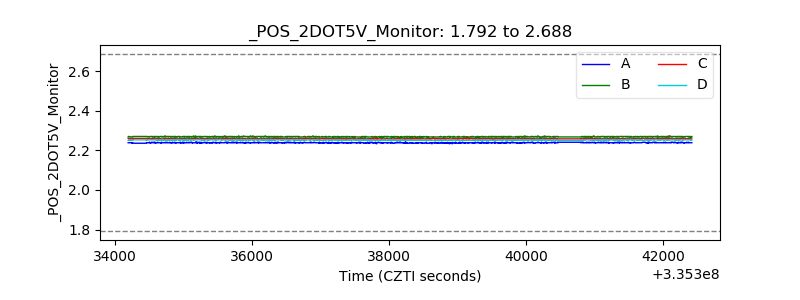 |
| +5 Volts monitor |  |
| _ROLL_ROT | 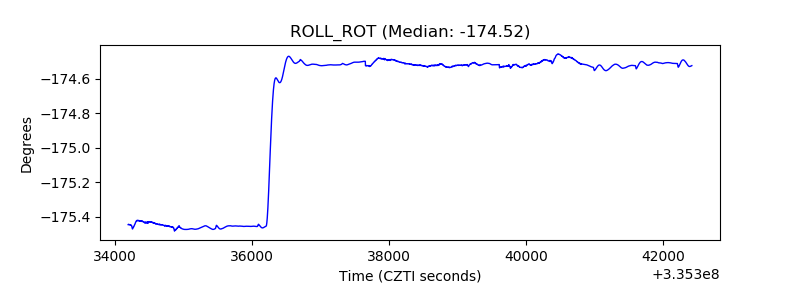 |
| _Roll_DEC |  |
| _Roll_RA | 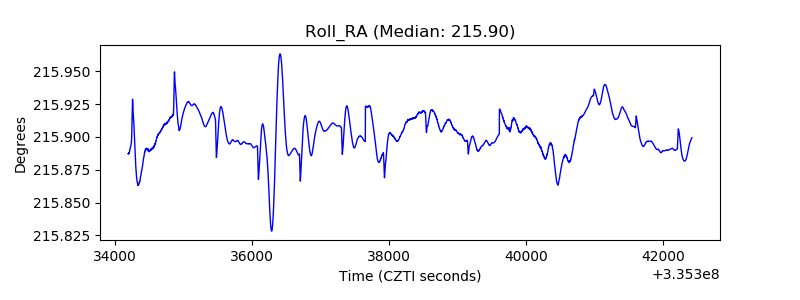 |
| Veto Counter | 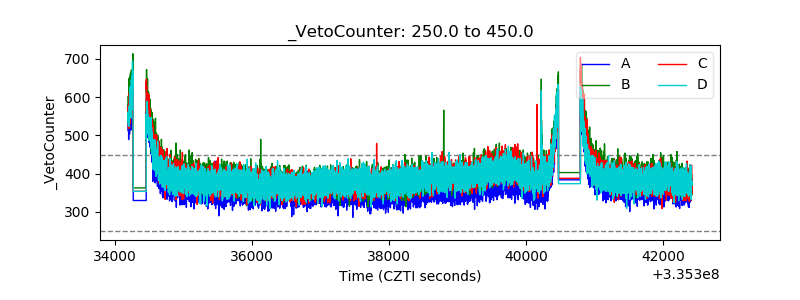 |