| Param | Original file | Final file |
|---|---|---|
| Filename | modeM0/AS1A09_127T03_9000003820_26424cztM0_level2.evt | modeM0/AS1A09_127T03_9000003820_26424cztM0_level2_quad_clean.evt |
| Size (bytes) | 303,024,960 | 60,431,040 |
| Size | 289.0 MB | 57.6 MB |
| Events in quadrant A | 1,734,915 | 400,268 |
| Events in quadrant B | 1,880,689 | 406,060 |
| Events in quadrant C | 2,327,476 | 382,201 |
| Events in quadrant D | 2,972,062 | 369,955 |
| Mode M0 | |||
|---|---|---|---|
| Quadrant | BADHDUFLAG | Total packets | Discarded packets |
| A | 0 | 7778 | 0 |
| B | 0 | 8071 | 0 |
| C | 0 | 9361 | 0 |
| D | 0 | 11419 | 0 |
| Quadrant | Total seconds | Saturated seconds | Saturation percentage |
|---|---|---|---|
| A | 3842 | 12 | 0.312337% |
| B | 3842 | 17 | 0.442478% |
| C | 3842 | 105 | 2.732952% |
| D | 3842 | 199 | 5.179594% |
Noise dominated data is calculated using 1-second bins in cleaned event files. If a bin has >2000 counts, and if more than 50% of those come from <1% of pixels, then it is considered to be noise-dominated and hence unusable.
| Quadrant | # 1 sec bins | Bins with >0 counts | Bins with >2000 counts | High rate bins dominated by noise | Noise dominated (total time) | Noise dominated (detector-on time) | Marked lightcurve |
|---|---|---|---|---|---|---|---|
| A | 3842 | 3842 | 9 | 9 | 0.23% | 0.23% | 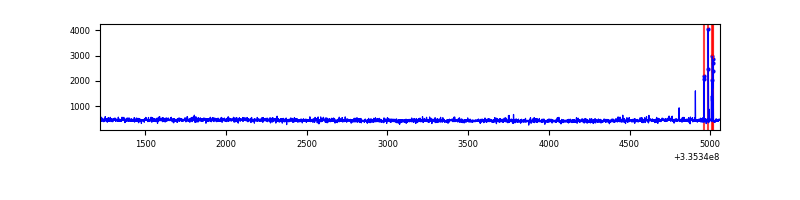 |
| B | 3842 | 3842 | 10 | 10 | 0.26% | 0.26% | 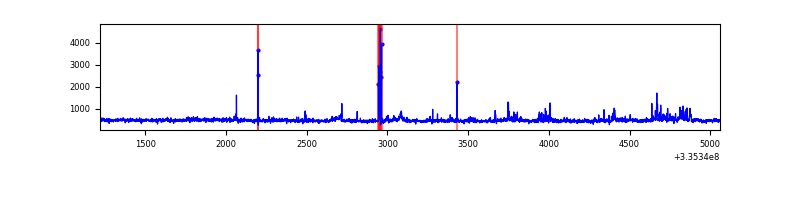 |
| C | 3842 | 3842 | 67 | 67 | 1.74% | 1.74% | 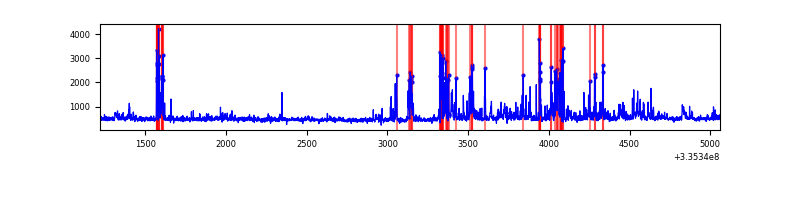 |
| D | 3842 | 3842 | 188 | 188 | 4.89% | 4.89% | 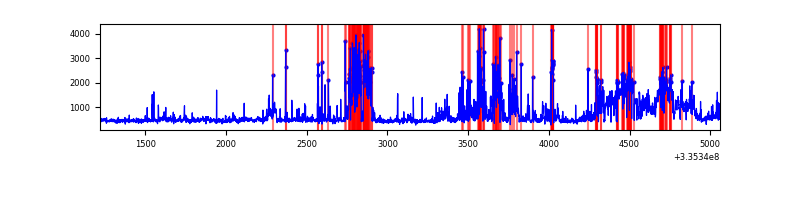 |
Top three noisy pixels from each quadrant. If the there are fewer than three noisy pixels in the level2.evt file, extra rows are filled as -1
| Pixel properties | Quadrant properties | ||||||
|---|---|---|---|---|---|---|---|
| Quadrant | DetID | PixID | Counts | Sigma | Mean | Median | Sigma |
| A | 6 | 16 | 32548 | 356.1 | 438 | 428 | 90.2 |
| A | 12 | 189 | 11733 | 125.33 | 438 | 428 | 90.2 |
| A | 13 | 254 | 6452 | 66.78 | 438 | 428 | 90.2 |
| B | 0 | 244 | 65880 | 768.24 | 435 | 423 | 85.2 |
| B | 0 | 189 | 48568 | 565.06 | 435 | 423 | 85.2 |
| B | 15 | 32 | 29519 | 341.49 | 435 | 423 | 85.2 |
| C | 4 | 254 | 389801 | 3982.06 | 413 | 416 | 97.8 |
| C | 3 | 233 | 183434 | 1871.64 | 413 | 416 | 97.8 |
| C | 14 | 238 | 67561 | 686.66 | 413 | 416 | 97.8 |
| D | 1 | 52 | 945532 | 9352.36 | 417 | 406 | 101.1 |
| D | 12 | 233 | 259275 | 2561.6 | 417 | 406 | 101.1 |
| D | 7 | 80 | 113485 | 1118.96 | 417 | 406 | 101.1 |
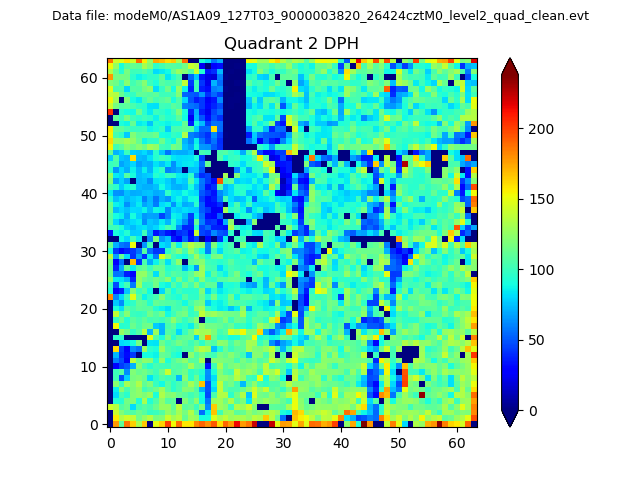
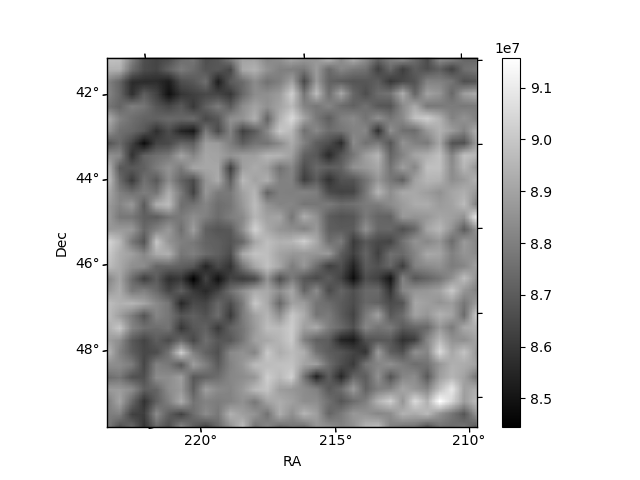
Histogram calculated using DETX and DETY for each event in the final _common_clean file
| Quadrant A | 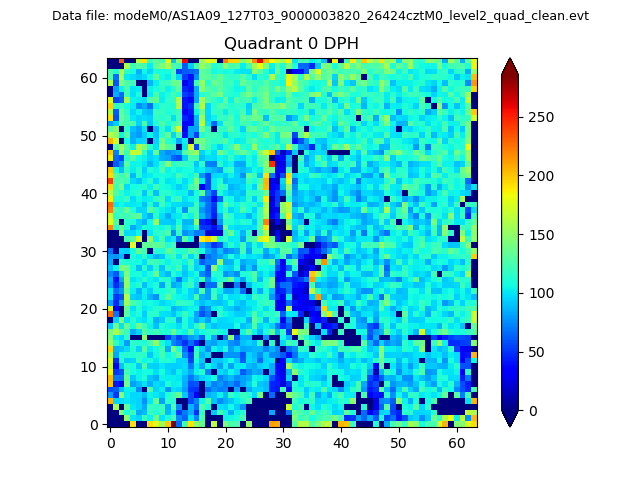 |
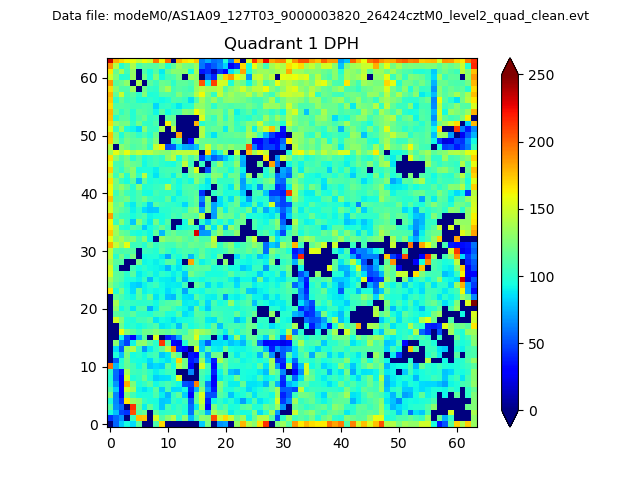 |
Quadrant B |
|---|---|---|---|
| Quadrant D | 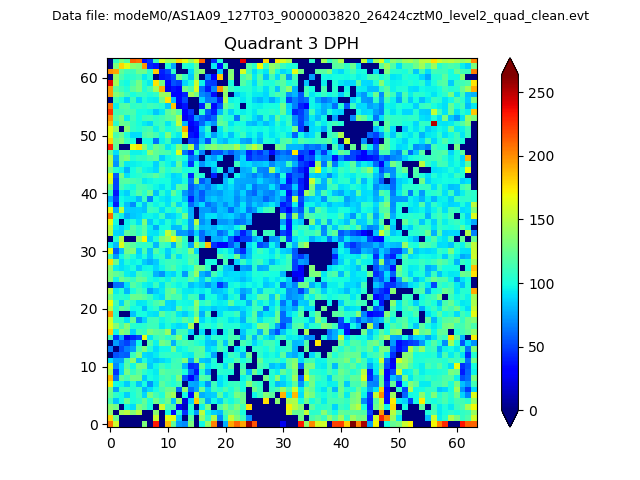 |
 |
Quadrant C |
| Plot type | Count rate plots | Images |
|---|---|---|
| Comparison with Poisson distribution Blue bars denote a histogram of data divided into 1 sec bins. Red curve is a Poisson curve with rate = median count rate of data. |
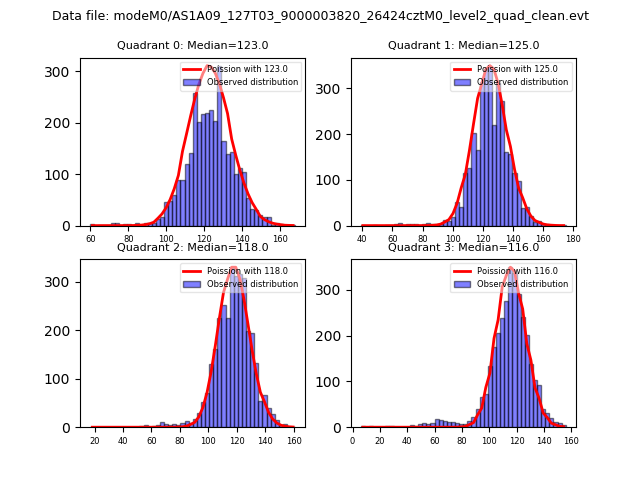 |
 |
| Quadrant-wise count rates Data is divided into 100 sec bins |
 |
|
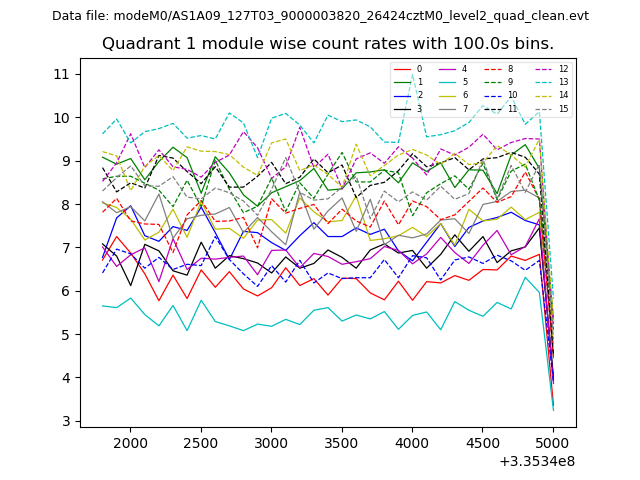
| Module-wise count rates for Quadrant A Data is divided into 100 sec bins |
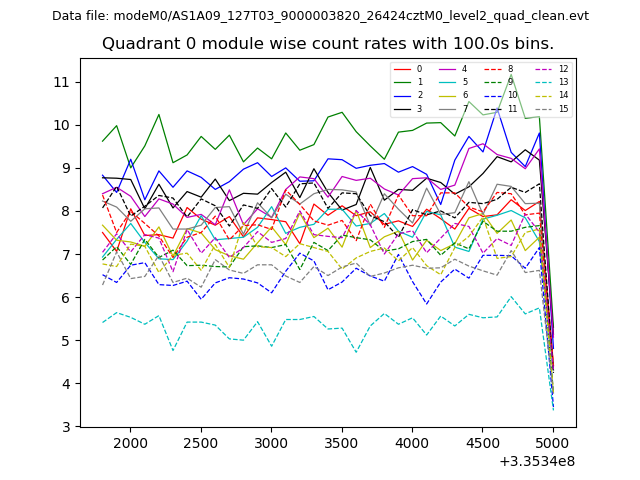 |
 |
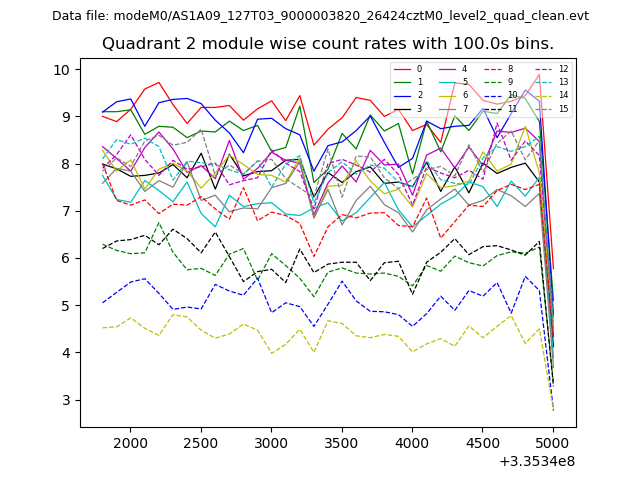
| Module-wise count rates for Quadrant B Data is divided into 100 sec bins |
 |
 |
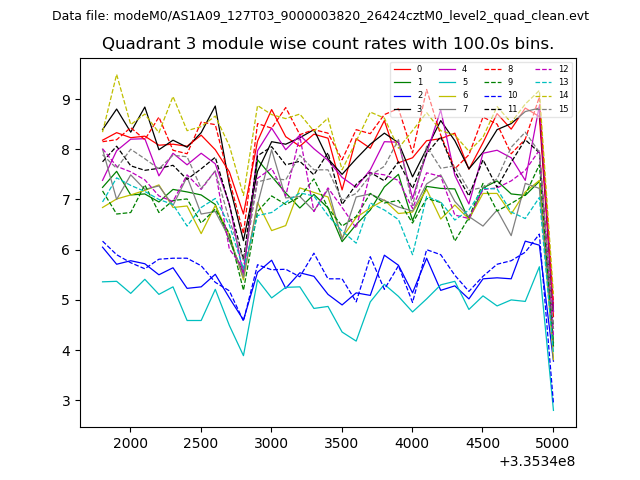
| Module-wise count rates for Quadrant C Data is divided into 100 sec bins |
 |
 |
| Module-wise count rates for Quadrant D Data is divided into 100 sec bins |
 |
 |
| Parameter | Plot |
|---|---|
| CZT HV Monitor | 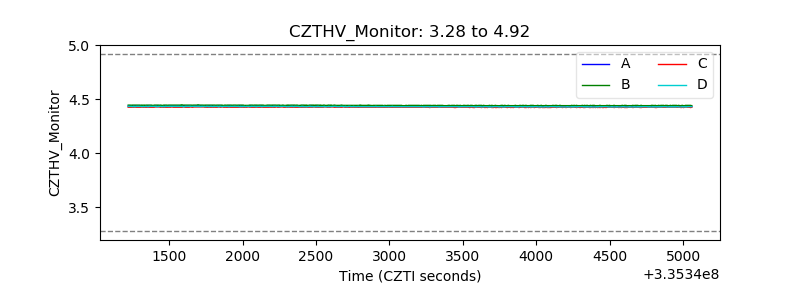 |
| D_VDD | 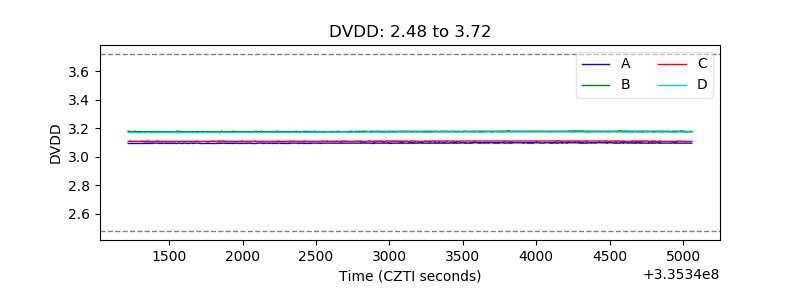 |
| Temperature 1 | 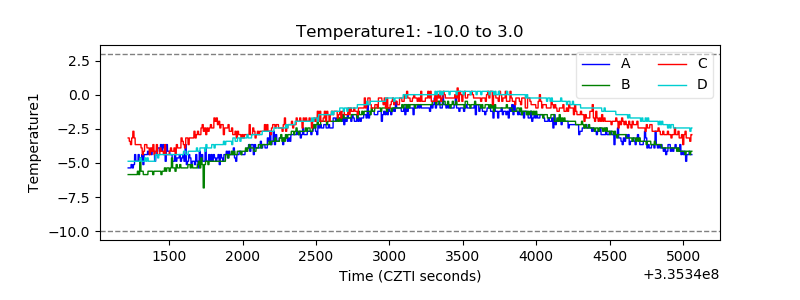 |
| Veto HV Monitor | 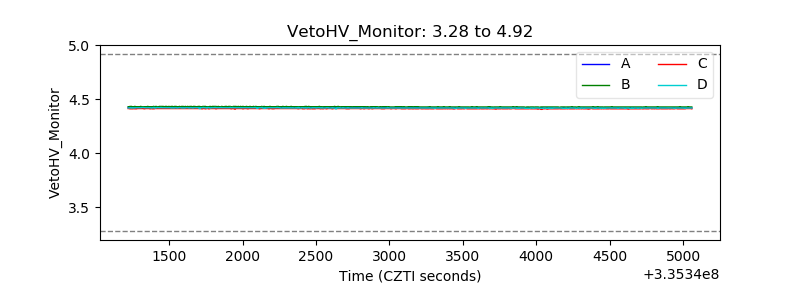 |
| Veto LLD | 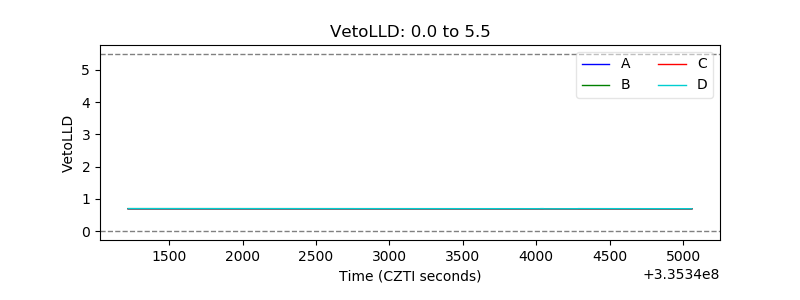 |
| Alpha Counter | 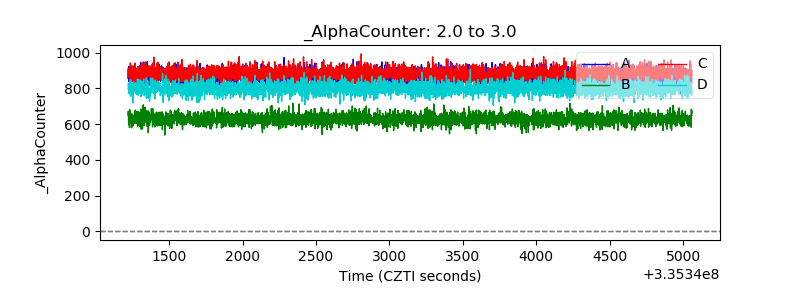 |
| _CPM_Rate | 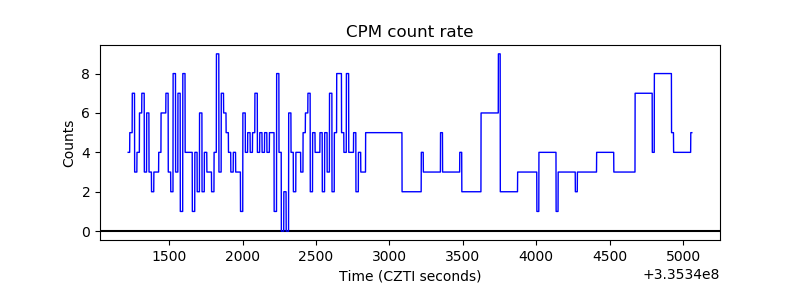 |
| CZT Counter | 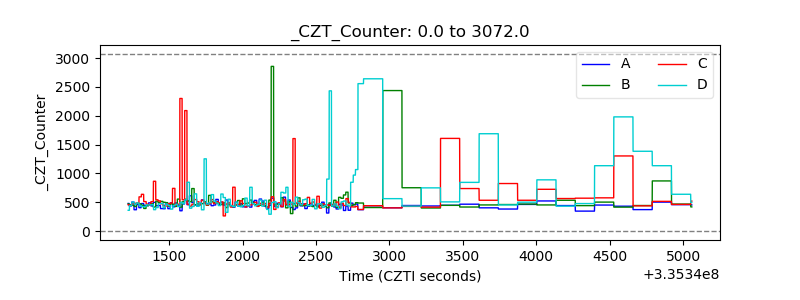 |
| +2.5 Volts monitor |  |
| +5 Volts monitor |  |
| _ROLL_ROT | 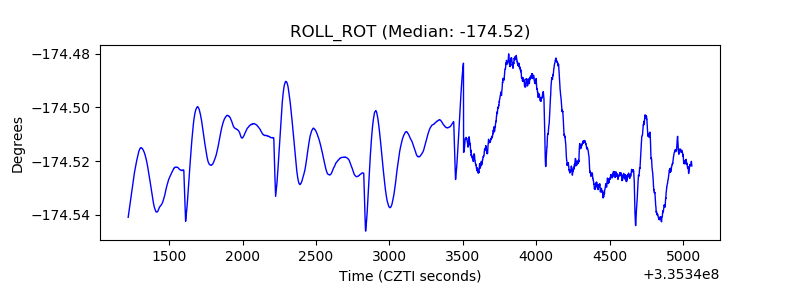 |
| _Roll_DEC | 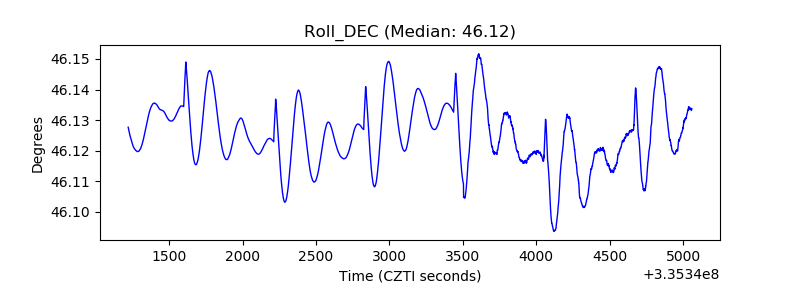 |
| _Roll_RA | 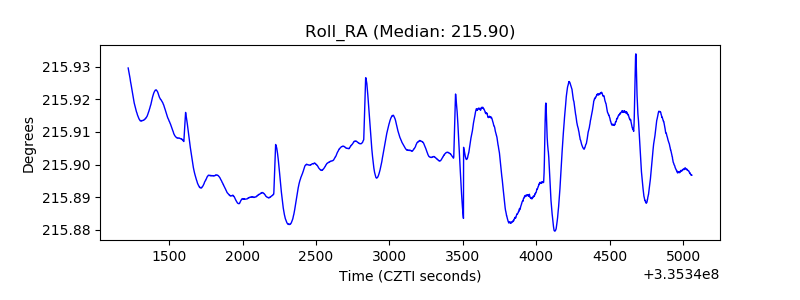 |
| Veto Counter | 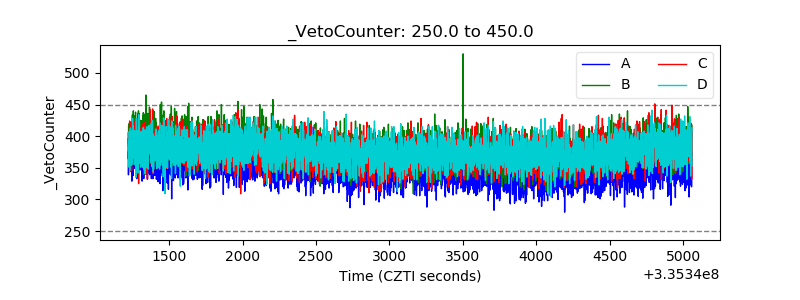 |