| Param | Original file | Final file |
|---|---|---|
| Filename | modeM0/AS1A09_127T03_9000003820_26425cztM0_level2.evt | modeM0/AS1A09_127T03_9000003820_26425cztM0_level2_quad_clean.evt |
| Size (bytes) | 1,123,712,640 | 213,272,640 |
| Size | 1.0 GB | 203.4 MB |
| Events in quadrant A | 7,033,863 | 1,392,064 |
| Events in quadrant B | 7,815,505 | 1,398,352 |
| Events in quadrant C | 8,424,387 | 1,328,976 |
| Events in quadrant D | 9,743,419 | 1,304,120 |
| Mode M0 | |||
|---|---|---|---|
| Quadrant | BADHDUFLAG | Total packets | Discarded packets |
| A | 0 | 30671 | 0 |
| B | 0 | 32617 | 0 |
| C | 0 | 34136 | 0 |
| D | 0 | 38924 | 0 |
| Mode M9 | |||
|---|---|---|---|
| Quadrant | BADHDUFLAG | Total packets | Discarded packets |
| A | 0 | 20 | 0 |
| B | 0 | 20 | 0 |
| C | 0 | 20 | 0 |
| D | 0 | 20 | 0 |
| Quadrant | Total seconds | Saturated seconds | Saturation percentage |
|---|---|---|---|
| A | 15007 | 156 | 1.039515% |
| B | 15007 | 272 | 1.812488% |
| C | 15008 | 329 | 2.192164% |
| D | 15008 | 499 | 3.324893% |
Noise dominated data is calculated using 1-second bins in cleaned event files. If a bin has >2000 counts, and if more than 50% of those come from <1% of pixels, then it is considered to be noise-dominated and hence unusable.
| Quadrant | # 1 sec bins | Bins with >0 counts | Bins with >2000 counts | High rate bins dominated by noise | Noise dominated (total time) | Noise dominated (detector-on time) | Marked lightcurve |
|---|---|---|---|---|---|---|---|
| A | 17042 | 15007 | 9 | 9 | 0.05% | 0.06% | 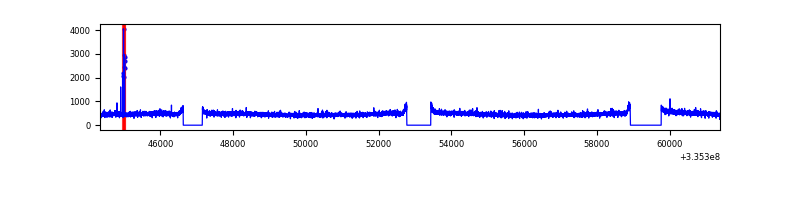 |
| B | 17042 | 15009 | 95 | 95 | 0.56% | 0.63% | 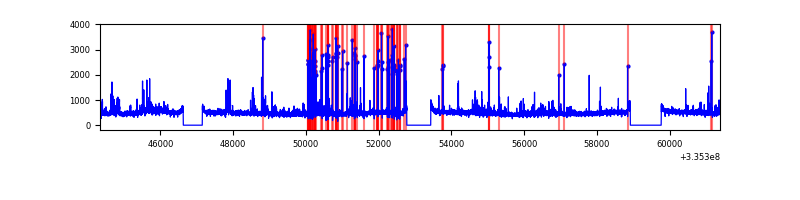 |
| C | 17043 | 15010 | 60 | 60 | 0.35% | 0.40% | 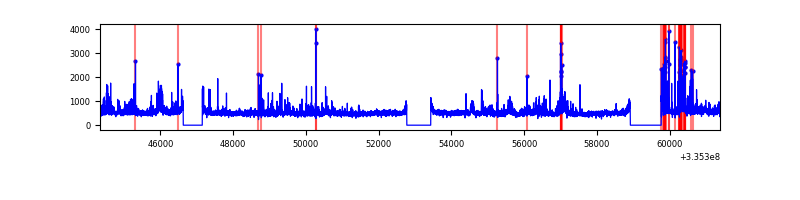 |
| D | 17043 | 15009 | 320 | 320 | 1.88% | 2.13% | 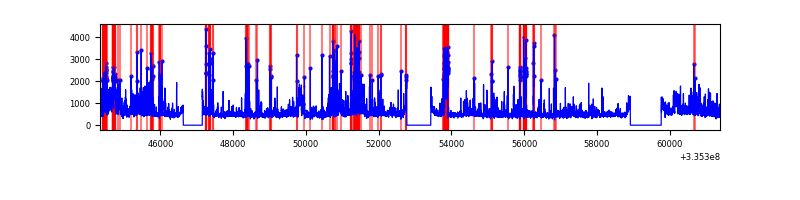 |
Top three noisy pixels from each quadrant. If the there are fewer than three noisy pixels in the level2.evt file, extra rows are filled as -1
| Pixel properties | Quadrant properties | ||||||
|---|---|---|---|---|---|---|---|
| Quadrant | DetID | PixID | Counts | Sigma | Mean | Median | Sigma |
| A | 12 | 189 | 38349 | 100.88 | 1804 | 1762 | 362.7 |
| A | 6 | 16 | 35151 | 92.06 | 1804 | 1762 | 362.7 |
| A | 13 | 254 | 25515 | 65.49 | 1804 | 1762 | 362.7 |
| B | 0 | 189 | 346008 | 1013.47 | 1792 | 1743 | 339.7 |
| B | 0 | 244 | 179046 | 521.95 | 1792 | 1743 | 339.7 |
| B | 5 | 172 | 123316 | 357.89 | 1792 | 1743 | 339.7 |
| C | 3 | 233 | 827810 | 2047.95 | 1726 | 1737 | 403.4 |
| C | 2 | 16 | 316965 | 781.49 | 1726 | 1737 | 403.4 |
| C | 14 | 238 | 272012 | 670.05 | 1726 | 1737 | 403.4 |
| D | 1 | 52 | 1857080 | 4453.2 | 1739 | 1697 | 416.6 |
| D | 12 | 227 | 369914 | 883.78 | 1739 | 1697 | 416.6 |
| D | 7 | 80 | 366040 | 874.48 | 1739 | 1697 | 416.6 |
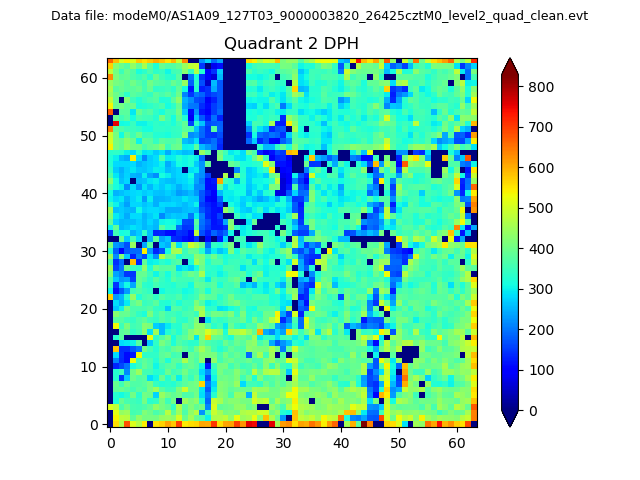
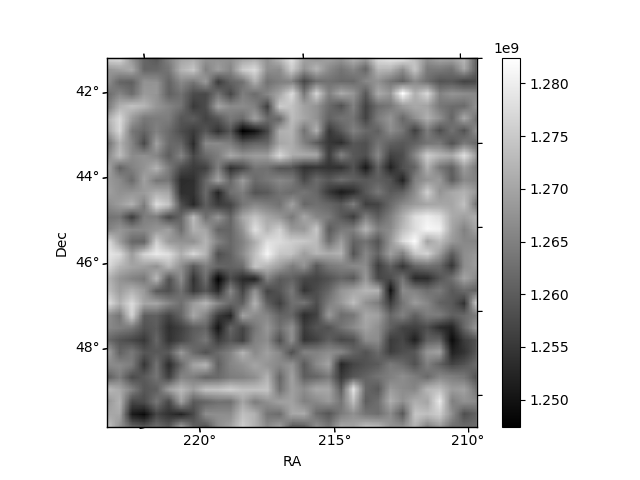
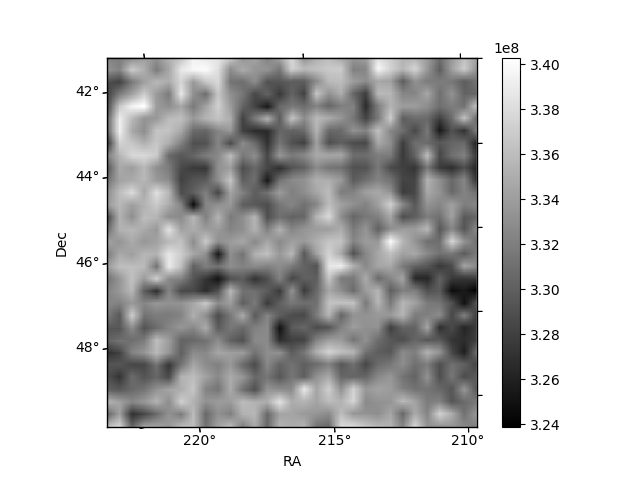
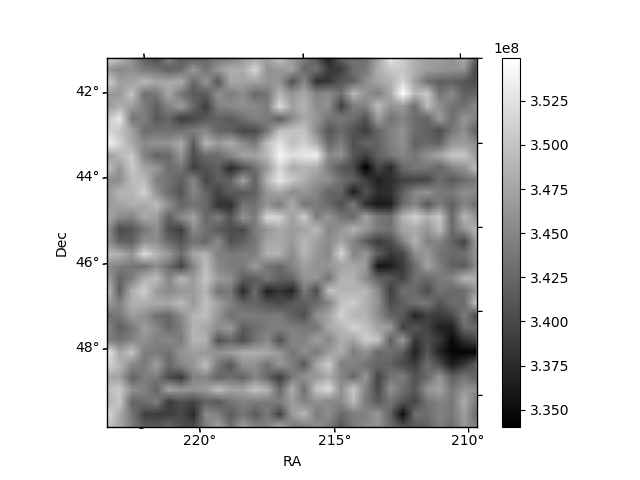
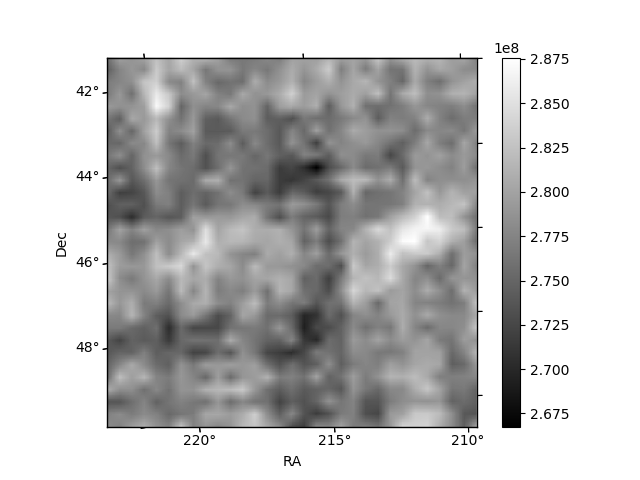
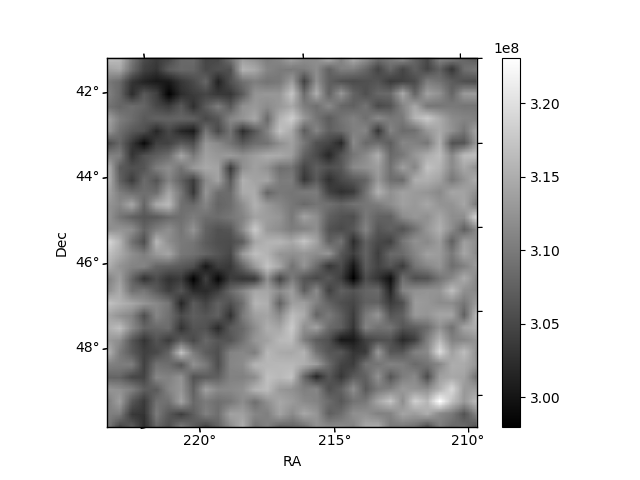
Histogram calculated using DETX and DETY for each event in the final _common_clean file
| Quadrant A | 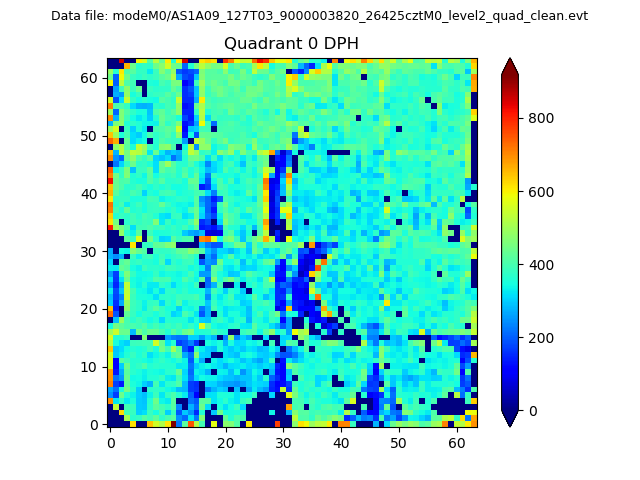 |
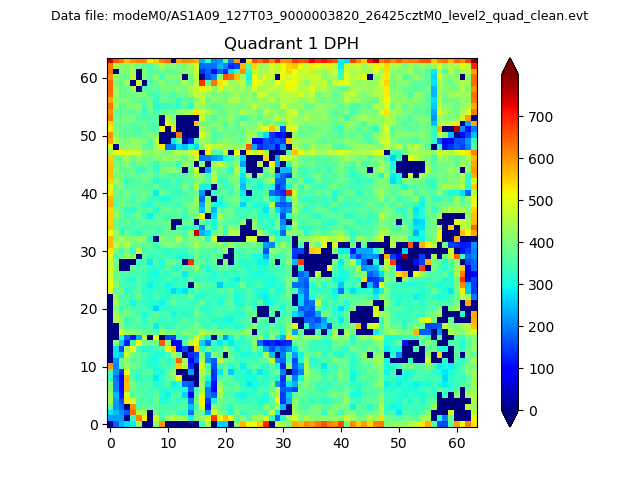 |
Quadrant B |
|---|---|---|---|
| Quadrant D | 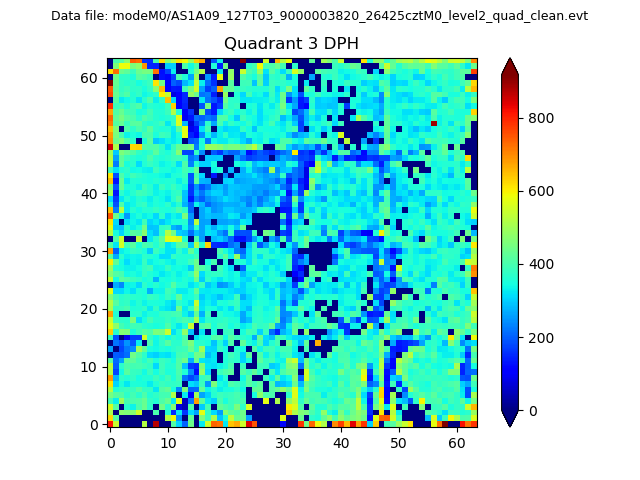 |
 |
Quadrant C |
| Plot type | Count rate plots | Images |
|---|---|---|
| Comparison with Poisson distribution Blue bars denote a histogram of data divided into 1 sec bins. Red curve is a Poisson curve with rate = median count rate of data. |
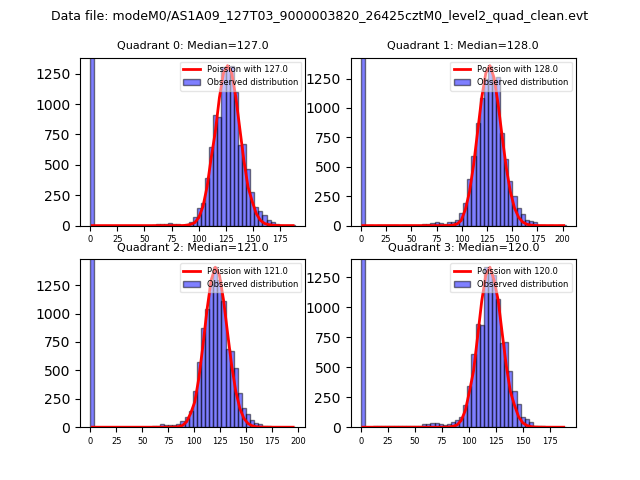 |
 |
| Quadrant-wise count rates Data is divided into 100 sec bins |
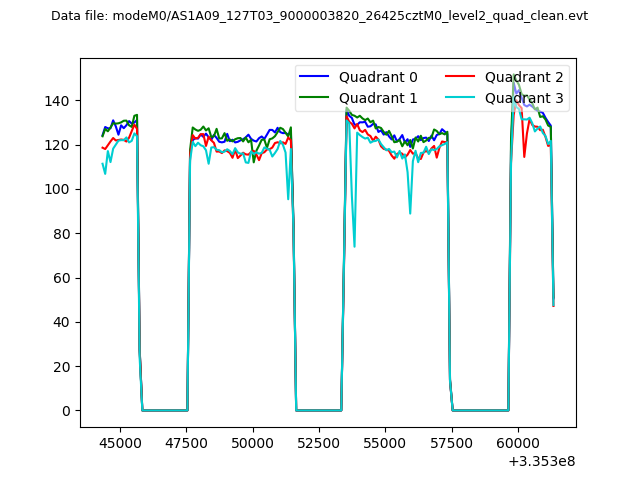 |
|
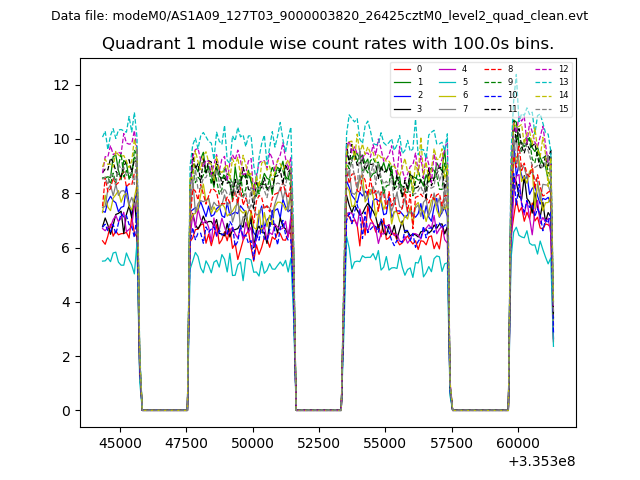
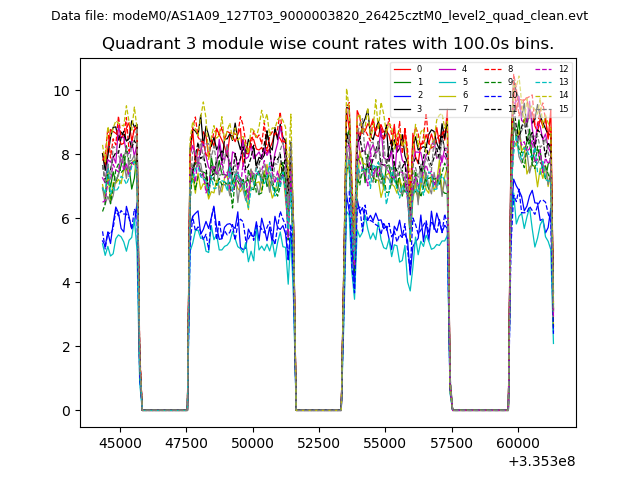
| Module-wise count rates for Quadrant A Data is divided into 100 sec bins |
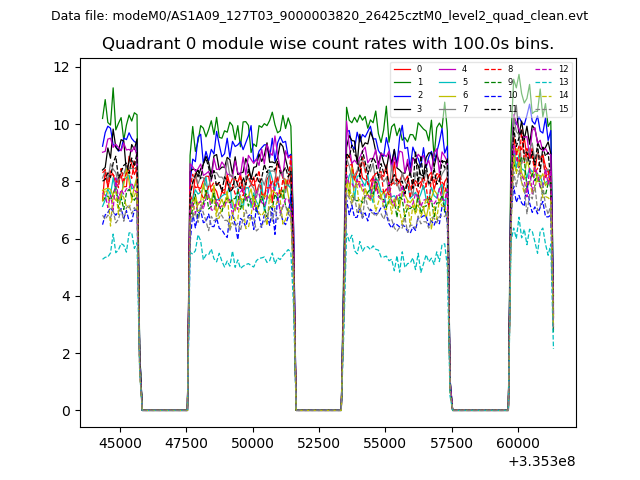 |
 |
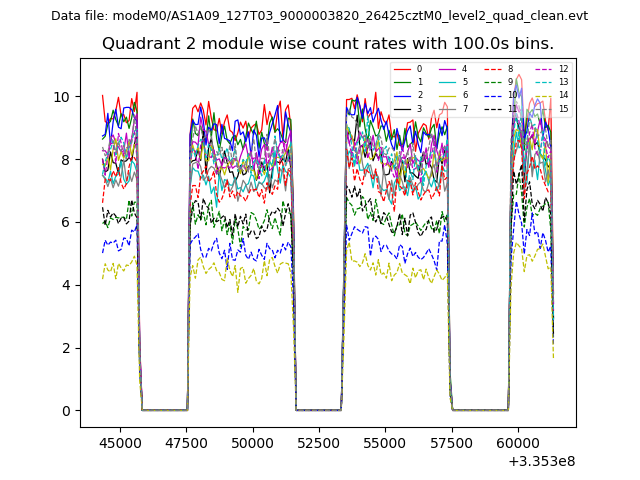
| Module-wise count rates for Quadrant B Data is divided into 100 sec bins |
 |
 |
| Module-wise count rates for Quadrant C Data is divided into 100 sec bins |
 |
 |
| Module-wise count rates for Quadrant D Data is divided into 100 sec bins |
 |
 |
| Parameter | Plot |
|---|---|
| CZT HV Monitor | 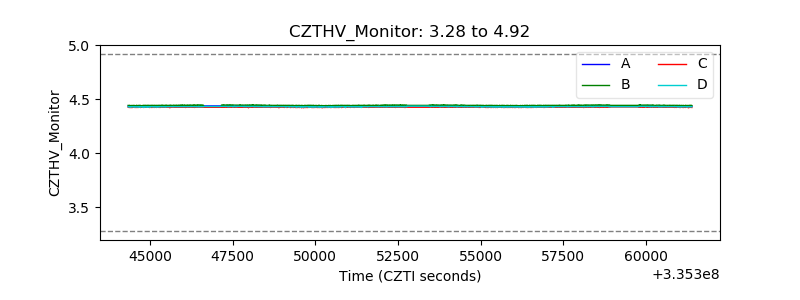 |
| D_VDD | 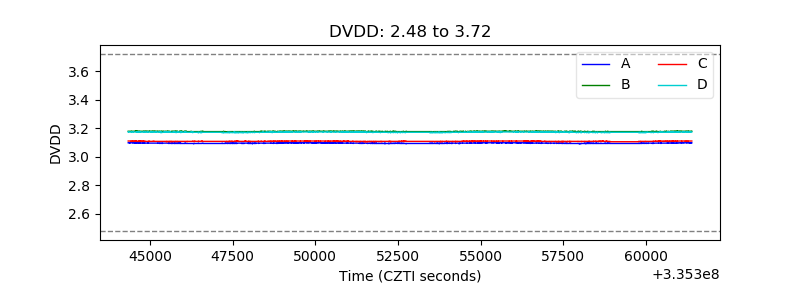 |
| Temperature 1 | 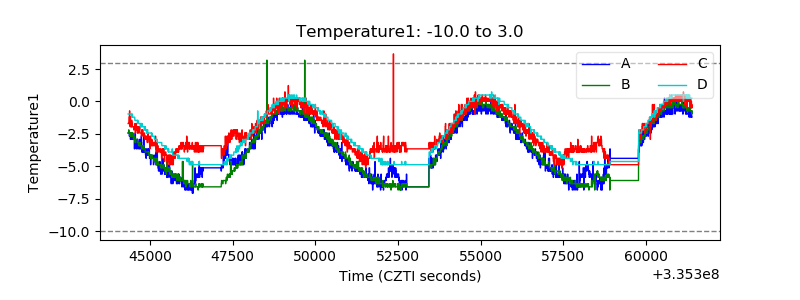 |
| Veto HV Monitor |  |
| Veto LLD |  |
| Alpha Counter | 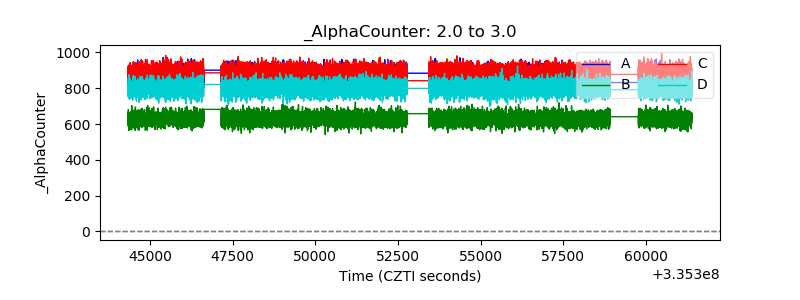 |
| _CPM_Rate | 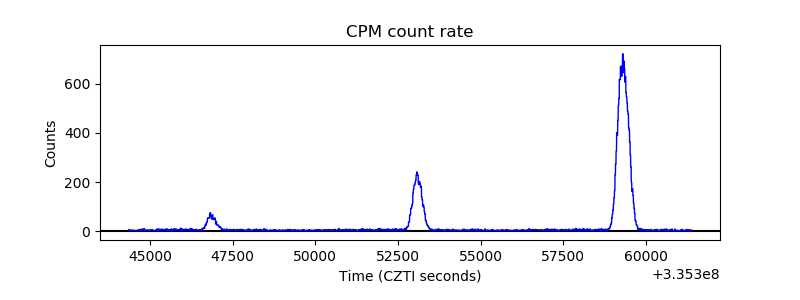 |
| CZT Counter | 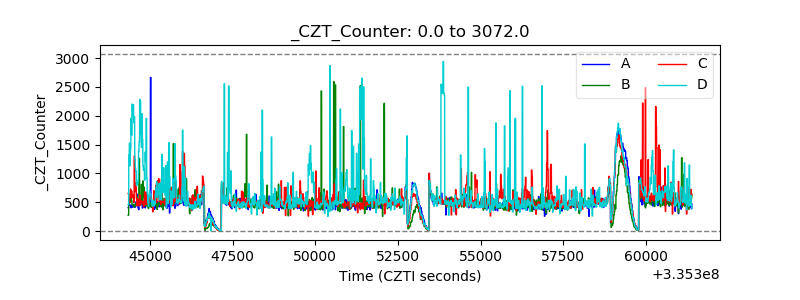 |
| +2.5 Volts monitor | 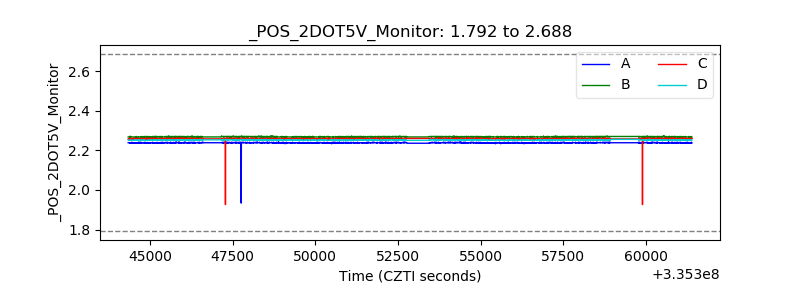 |
| +5 Volts monitor | 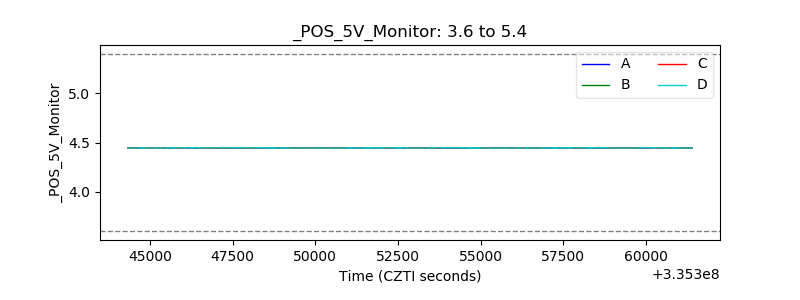 |
| _ROLL_ROT | 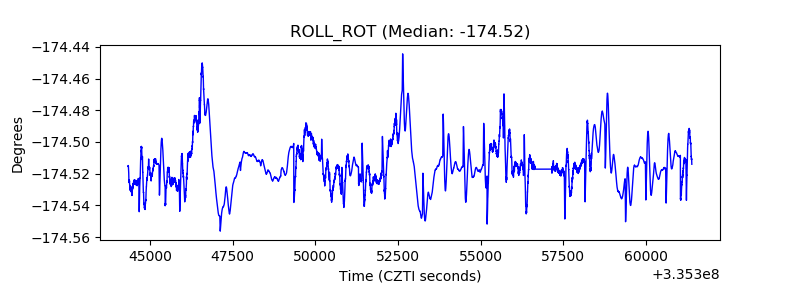 |
| _Roll_DEC | 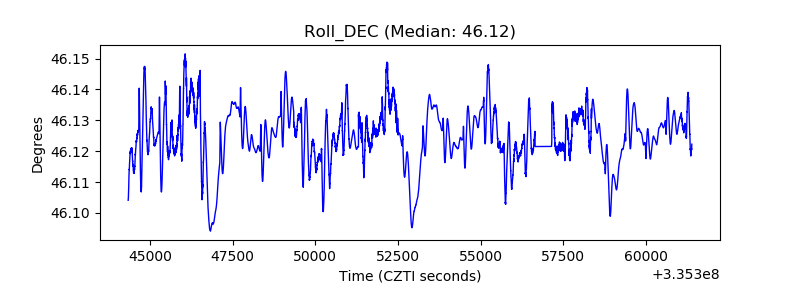 |
| _Roll_RA | 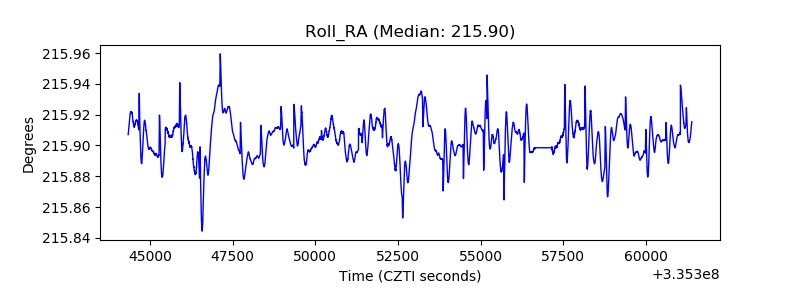 |
| Veto Counter | 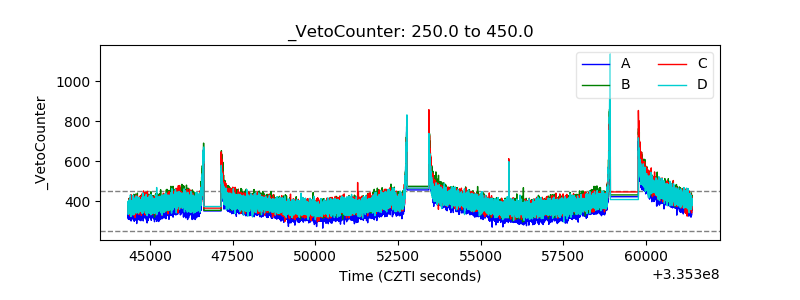 |