| Param | Original file | Final file |
|---|---|---|
| Filename | modeM0/AS1A09_127T03_9000003820_26426cztM0_level2.evt | modeM0/AS1A09_127T03_9000003820_26426cztM0_level2_quad_clean.evt |
| Size (bytes) | 448,274,880 | 85,178,880 |
| Size | 427.5 MB | 81.2 MB |
| Events in quadrant A | 2,795,463 | 558,177 |
| Events in quadrant B | 2,919,439 | 557,441 |
| Events in quadrant C | 3,306,273 | 529,136 |
| Events in quadrant D | 4,157,446 | 525,758 |
| Mode M0 | |||
|---|---|---|---|
| Quadrant | BADHDUFLAG | Total packets | Discarded packets |
| A | 0 | 12251 | 0 |
| B | 0 | 12483 | 0 |
| C | 0 | 13488 | 0 |
| D | 0 | 16257 | 0 |
| Mode M9 | |||
|---|---|---|---|
| Quadrant | BADHDUFLAG | Total packets | Discarded packets |
| A | 0 | 10 | 0 |
| B | 0 | 10 | 0 |
| C | 0 | 10 | 0 |
| D | 0 | 10 | 0 |
| Quadrant | Total seconds | Saturated seconds | Saturation percentage |
|---|---|---|---|
| A | 5847 | 40 | 0.684112% |
| B | 5847 | 40 | 0.684112% |
| C | 5848 | 88 | 1.504788% |
| D | 5848 | 277 | 4.736662% |
Noise dominated data is calculated using 1-second bins in cleaned event files. If a bin has >2000 counts, and if more than 50% of those come from <1% of pixels, then it is considered to be noise-dominated and hence unusable.
| Quadrant | # 1 sec bins | Bins with >0 counts | Bins with >2000 counts | High rate bins dominated by noise | Noise dominated (total time) | Noise dominated (detector-on time) | Marked lightcurve |
|---|---|---|---|---|---|---|---|
| A | 6882 | 5848 | 5 | 5 | 0.07% | 0.09% |  |
| B | 6882 | 5848 | 5 | 5 | 0.07% | 0.09% |  |
| C | 6883 | 5849 | 19 | 19 | 0.28% | 0.32% |  |
| D | 6883 | 5849 | 223 | 223 | 3.24% | 3.81% |  |
Top three noisy pixels from each quadrant. If the there are fewer than three noisy pixels in the level2.evt file, extra rows are filled as -1
| Pixel properties | Quadrant properties | ||||||
|---|---|---|---|---|---|---|---|
| Quadrant | DetID | PixID | Counts | Sigma | Mean | Median | Sigma |
| A | 0 | 13 | 64753 | 451.61 | 704 | 689 | 141.9 |
| A | 12 | 189 | 11604 | 76.94 | 704 | 689 | 141.9 |
| A | 13 | 254 | 10218 | 67.17 | 704 | 689 | 141.9 |
| B | 0 | 244 | 90186 | 671.75 | 700 | 683 | 133.2 |
| B | 5 | 172 | 43838 | 323.89 | 700 | 683 | 133.2 |
| B | 12 | 111 | 15140 | 108.5 | 700 | 683 | 133.2 |
| C | 3 | 233 | 494681 | 3126.11 | 677 | 683 | 158.0 |
| C | 14 | 238 | 107432 | 675.53 | 677 | 683 | 158.0 |
| C | 2 | 16 | 41600 | 258.93 | 677 | 683 | 158.0 |
| D | 1 | 52 | 758355 | 4691.11 | 676 | 661 | 161.5 |
| D | 12 | 233 | 593501 | 3670.45 | 676 | 661 | 161.5 |
| D | 12 | 227 | 88066 | 541.15 | 676 | 661 | 161.5 |
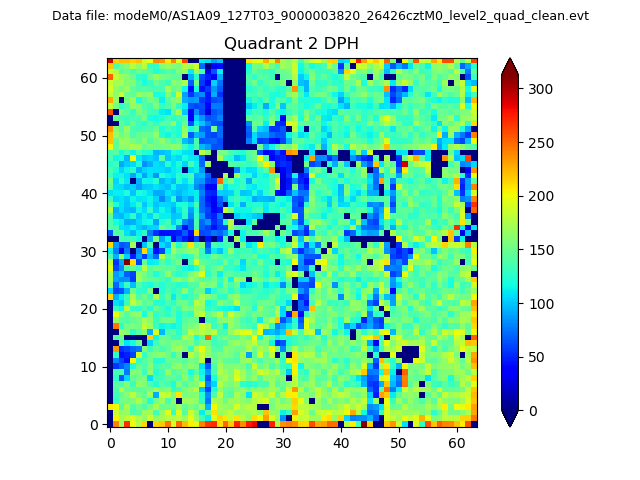
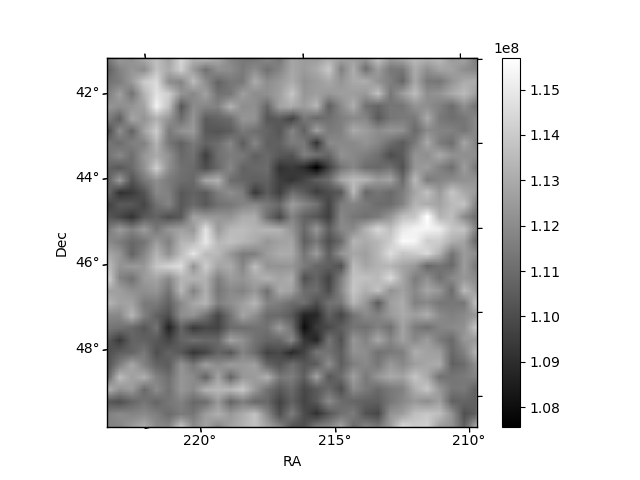
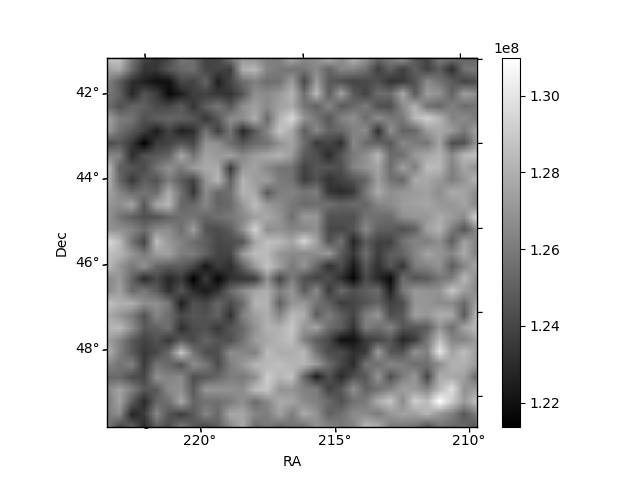
Histogram calculated using DETX and DETY for each event in the final _common_clean file
| Quadrant A | 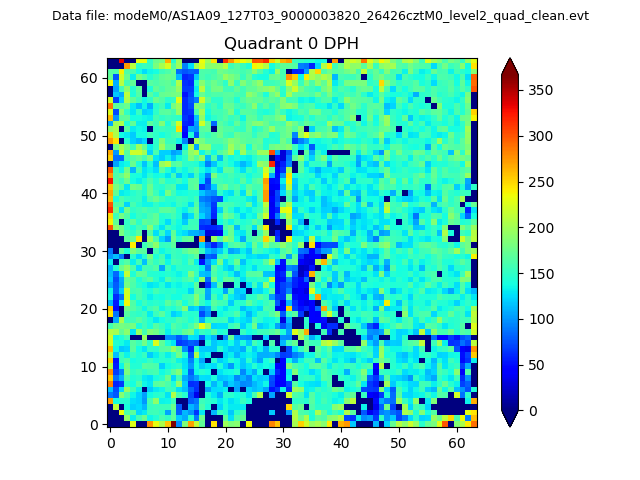 |
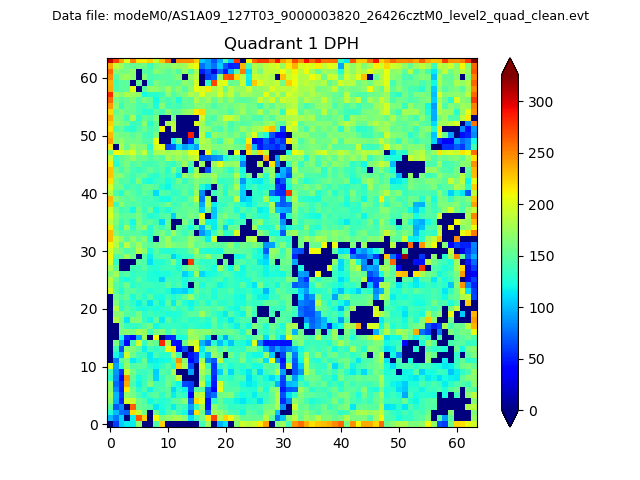 |
Quadrant B |
|---|---|---|---|
| Quadrant D | 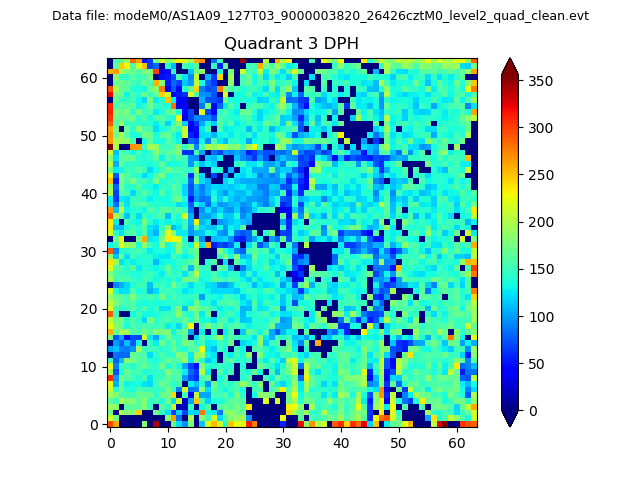 |
 |
Quadrant C |
| Plot type | Count rate plots | Images |
|---|---|---|
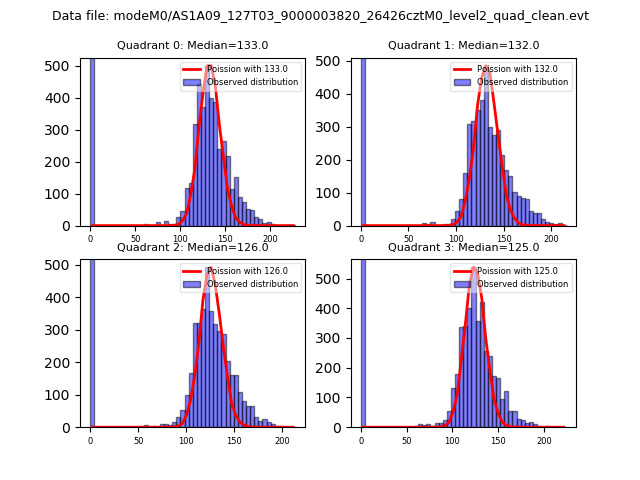
| Comparison with Poisson distribution Blue bars denote a histogram of data divided into 1 sec bins. Red curve is a Poisson curve with rate = median count rate of data. |
 |
 |
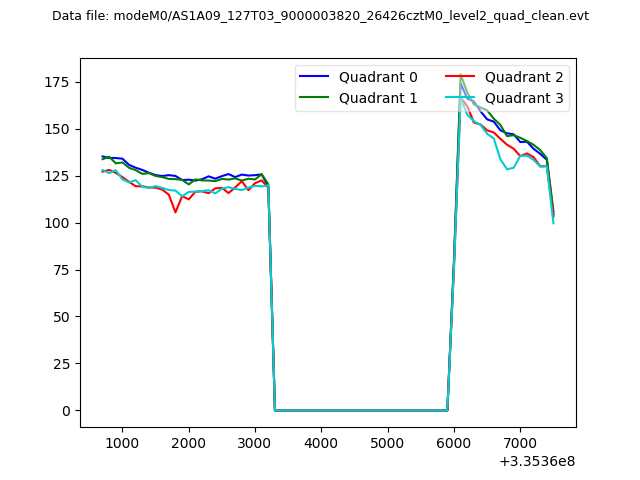
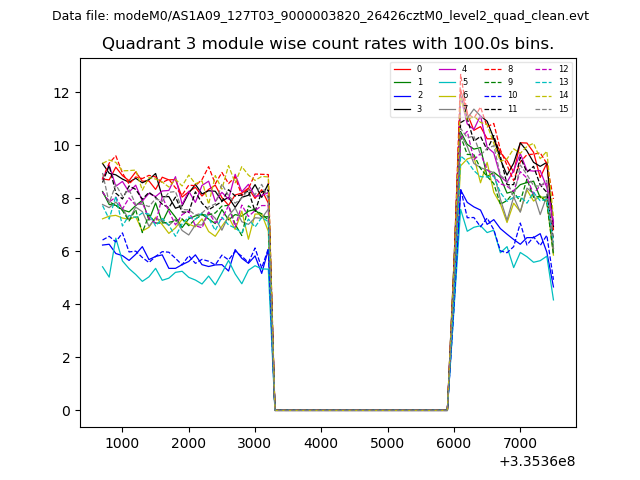
| Quadrant-wise count rates Data is divided into 100 sec bins |
 |
|
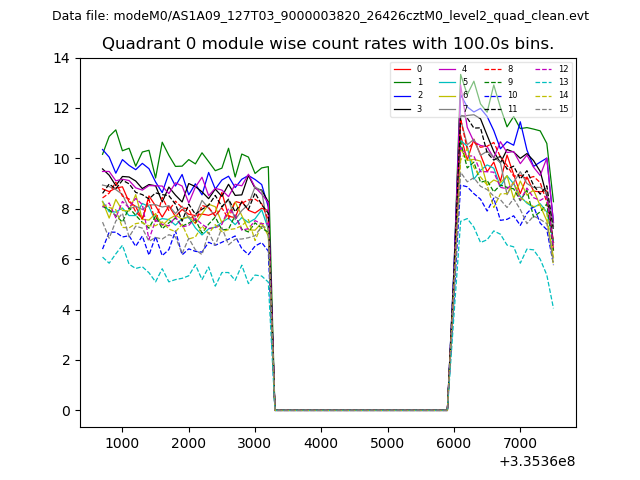
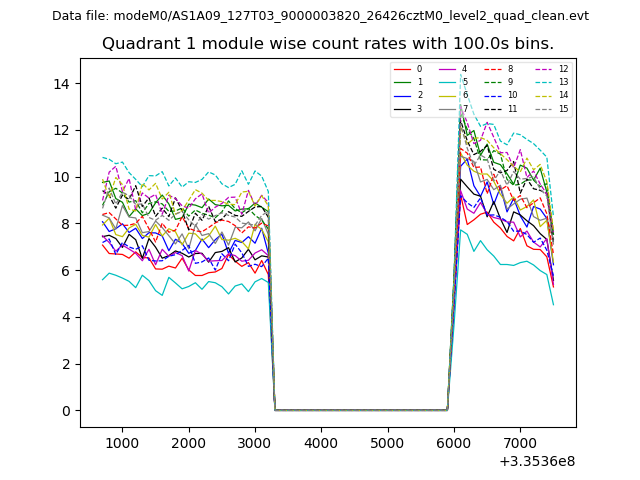
| Module-wise count rates for Quadrant A Data is divided into 100 sec bins |
 |
 |
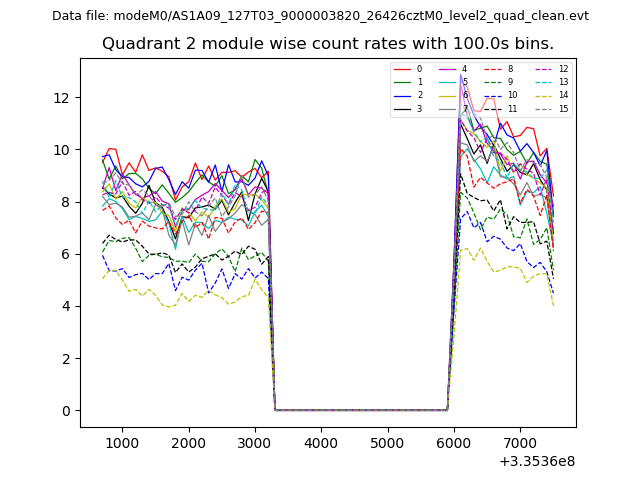
| Module-wise count rates for Quadrant B Data is divided into 100 sec bins |
 |
 |
| Module-wise count rates for Quadrant C Data is divided into 100 sec bins |
 |
 |
| Module-wise count rates for Quadrant D Data is divided into 100 sec bins |
 |
 |
| Parameter | Plot |
|---|---|
| CZT HV Monitor | 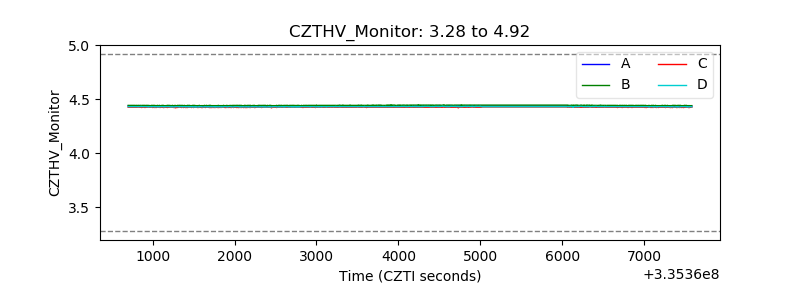 |
| D_VDD | 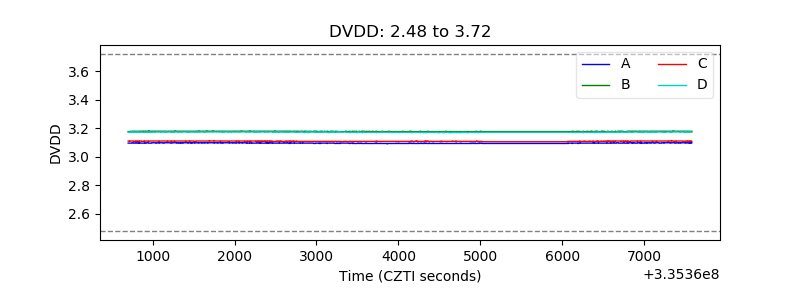 |
| Temperature 1 | 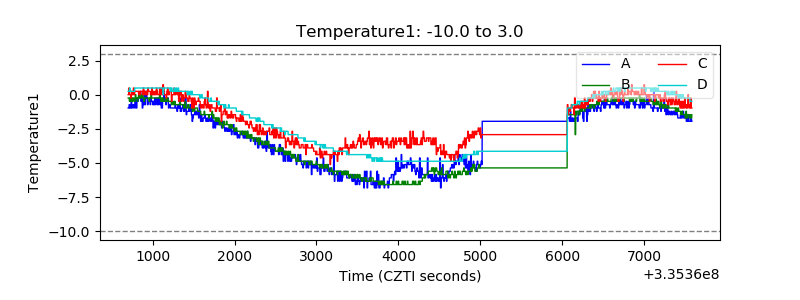 |
| Veto HV Monitor | 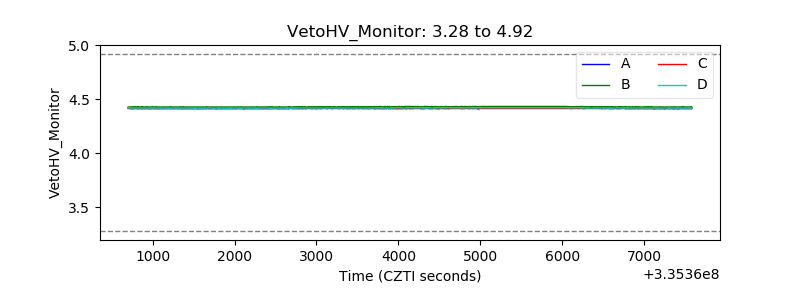 |
| Veto LLD | 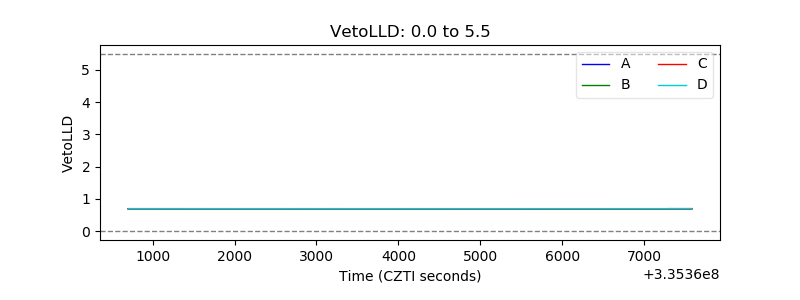 |
| Alpha Counter | 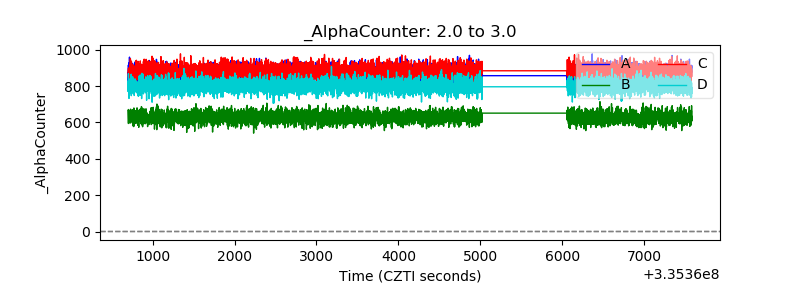 |
| _CPM_Rate | 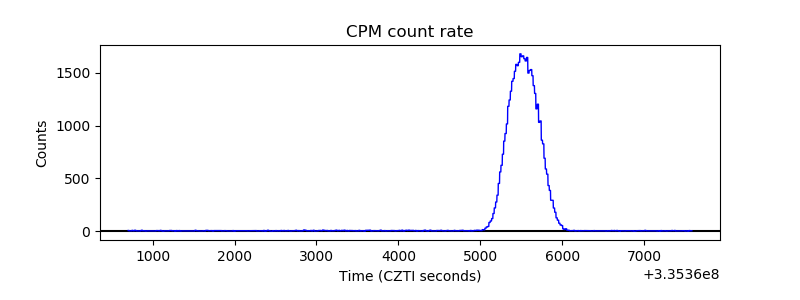 |
| CZT Counter | 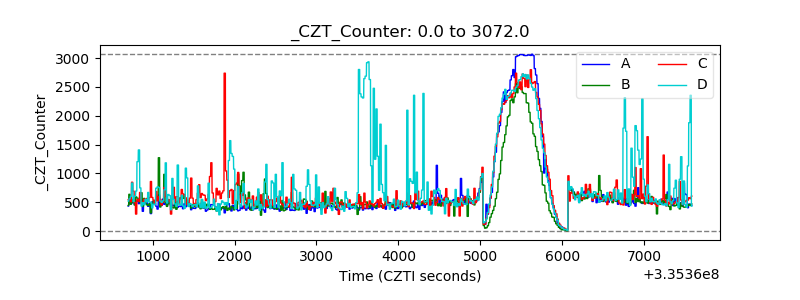 |
| +2.5 Volts monitor |  |
| +5 Volts monitor |  |
| _ROLL_ROT | 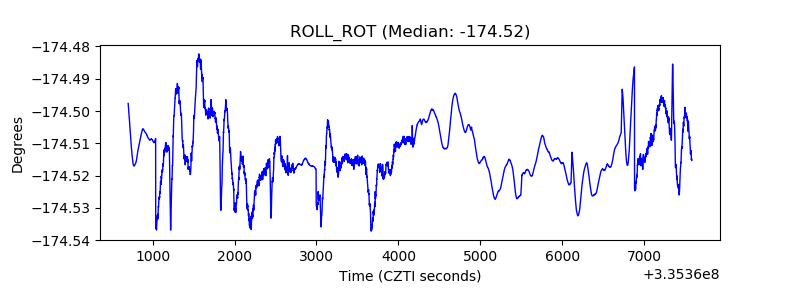 |
| _Roll_DEC | 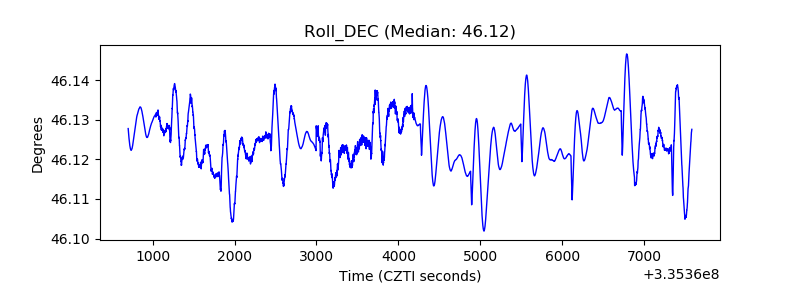 |
| _Roll_RA | 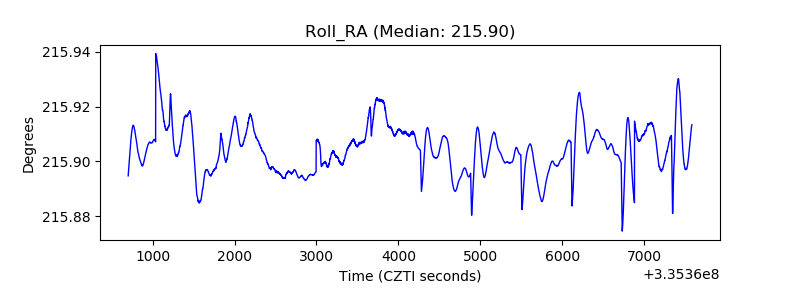 |
| Veto Counter | 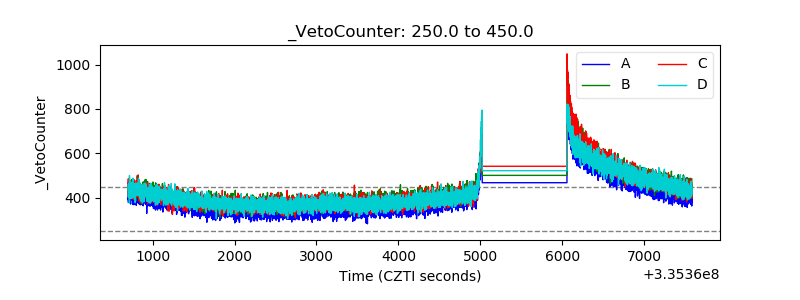 |