| Param | Original file | Final file |
|---|---|---|
| Filename | modeM0/AS1A09_127T03_9000003820_26428cztM0_level2.evt | modeM0/AS1A09_127T03_9000003820_26428cztM0_level2_quad_clean.evt |
| Size (bytes) | 421,960,320 | 84,677,760 |
| Size | 402.4 MB | 80.8 MB |
| Events in quadrant A | 2,971,513 | 549,367 |
| Events in quadrant B | 2,876,199 | 559,865 |
| Events in quadrant C | 3,025,763 | 532,864 |
| Events in quadrant D | 3,517,195 | 522,745 |
| Mode M0 | |||
|---|---|---|---|
| Quadrant | BADHDUFLAG | Total packets | Discarded packets |
| A | 0 | 12648 | 0 |
| B | 0 | 12245 | 0 |
| C | 0 | 12534 | 0 |
| D | 0 | 14325 | 0 |
| Mode M9 | |||
|---|---|---|---|
| Quadrant | BADHDUFLAG | Total packets | Discarded packets |
| A | 0 | 11 | 0 |
| B | 0 | 11 | 0 |
| C | 0 | 11 | 0 |
| D | 0 | 11 | 0 |
| Quadrant | Total seconds | Saturated seconds | Saturation percentage |
|---|---|---|---|
| A | 5707 | 83 | 1.454354% |
| B | 5708 | 54 | 0.946041% |
| C | 5708 | 81 | 1.419061% |
| D | 5708 | 147 | 2.575333% |
Noise dominated data is calculated using 1-second bins in cleaned event files. If a bin has >2000 counts, and if more than 50% of those come from <1% of pixels, then it is considered to be noise-dominated and hence unusable.
| Quadrant | # 1 sec bins | Bins with >0 counts | Bins with >2000 counts | High rate bins dominated by noise | Noise dominated (total time) | Noise dominated (detector-on time) | Marked lightcurve |
|---|---|---|---|---|---|---|---|
| A | 6872 | 5707 | 29 | 29 | 0.42% | 0.51% | 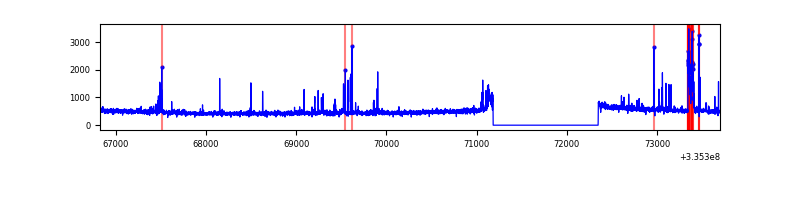 |
| B | 6873 | 5708 | 6 | 6 | 0.09% | 0.11% | 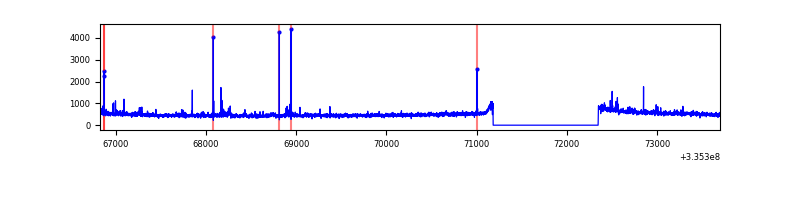 |
| C | 6873 | 5709 | 6 | 6 | 0.09% | 0.11% | 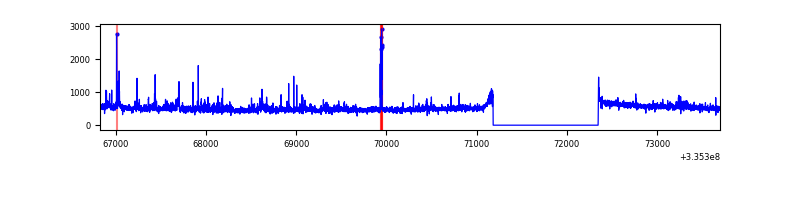 |
| D | 6873 | 5708 | 85 | 85 | 1.24% | 1.49% | 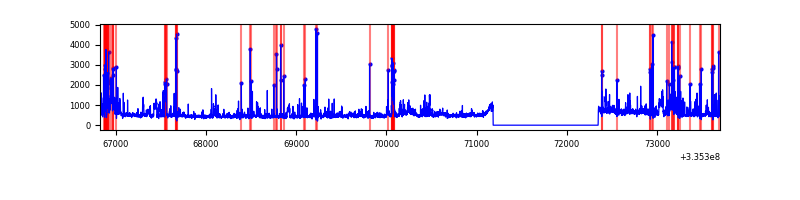 |
Top three noisy pixels from each quadrant. If the there are fewer than three noisy pixels in the level2.evt file, extra rows are filled as -1
| Pixel properties | Quadrant properties | ||||||
|---|---|---|---|---|---|---|---|
| Quadrant | DetID | PixID | Counts | Sigma | Mean | Median | Sigma |
| A | 0 | 13 | 214436 | 1532.32 | 704 | 691 | 139.5 |
| A | 6 | 16 | 23453 | 163.18 | 704 | 691 | 139.5 |
| A | 12 | 189 | 13826 | 94.16 | 704 | 691 | 139.5 |
| B | 0 | 244 | 49963 | 375.23 | 704 | 689 | 131.3 |
| B | 5 | 172 | 25861 | 191.69 | 704 | 689 | 131.3 |
| B | 12 | 111 | 14667 | 106.44 | 704 | 689 | 131.3 |
| C | 3 | 233 | 230037 | 1436.06 | 683 | 689 | 159.7 |
| C | 14 | 238 | 108243 | 673.45 | 683 | 689 | 159.7 |
| C | 2 | 16 | 12864 | 76.23 | 683 | 689 | 159.7 |
| D | 1 | 52 | 499861 | 3072.02 | 687 | 672 | 162.5 |
| D | 7 | 80 | 156511 | 959.04 | 687 | 672 | 162.5 |
| D | 7 | 223 | 85046 | 519.24 | 687 | 672 | 162.5 |
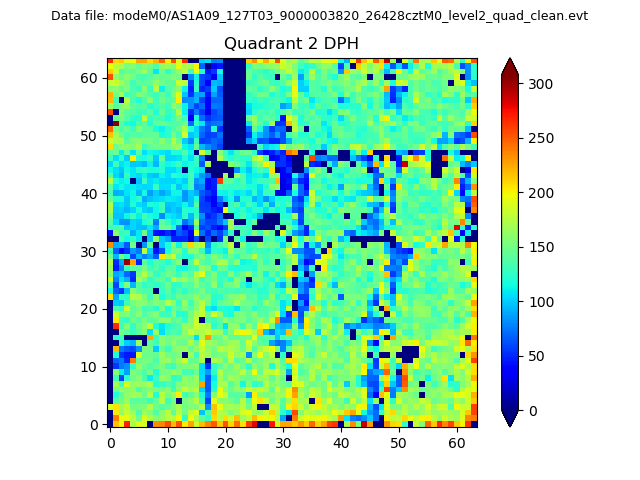
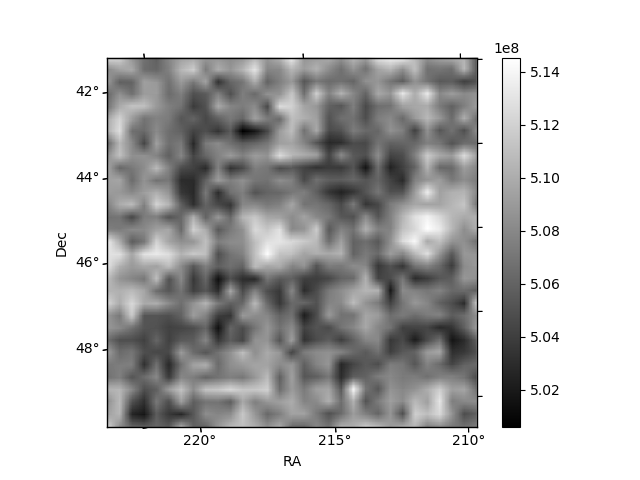
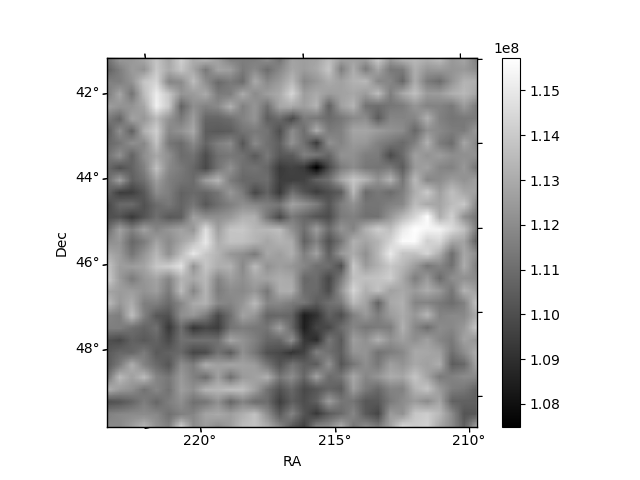
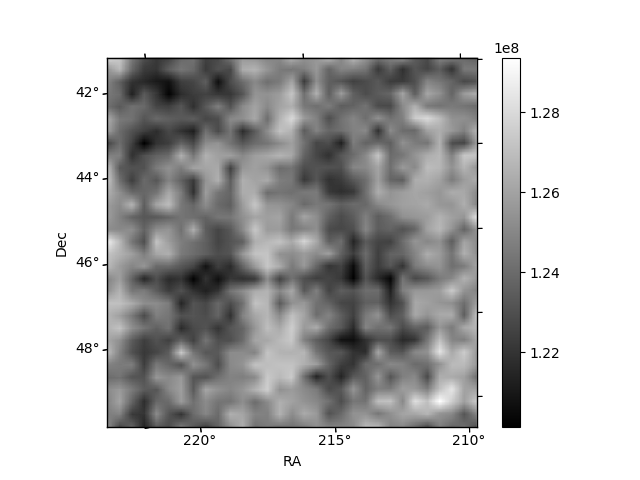
Histogram calculated using DETX and DETY for each event in the final _common_clean file
| Quadrant A | 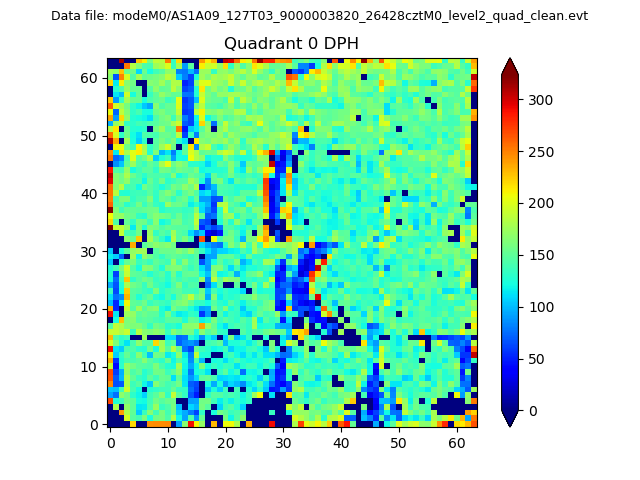 |
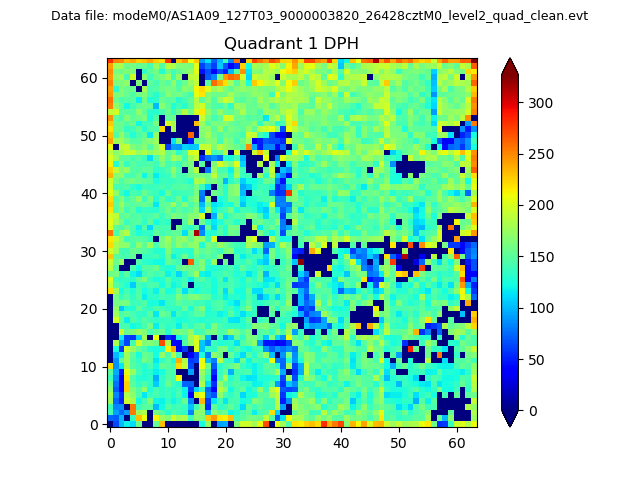 |
Quadrant B |
|---|---|---|---|
| Quadrant D | 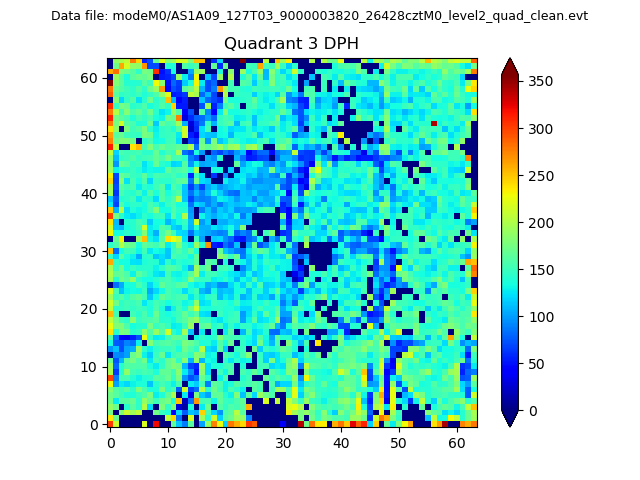 |
 |
Quadrant C |
| Plot type | Count rate plots | Images |
|---|---|---|
| Comparison with Poisson distribution Blue bars denote a histogram of data divided into 1 sec bins. Red curve is a Poisson curve with rate = median count rate of data. |
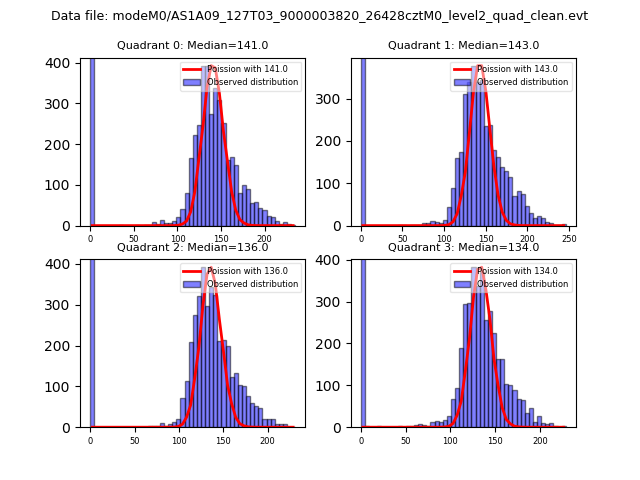 |
 |
| Quadrant-wise count rates Data is divided into 100 sec bins |
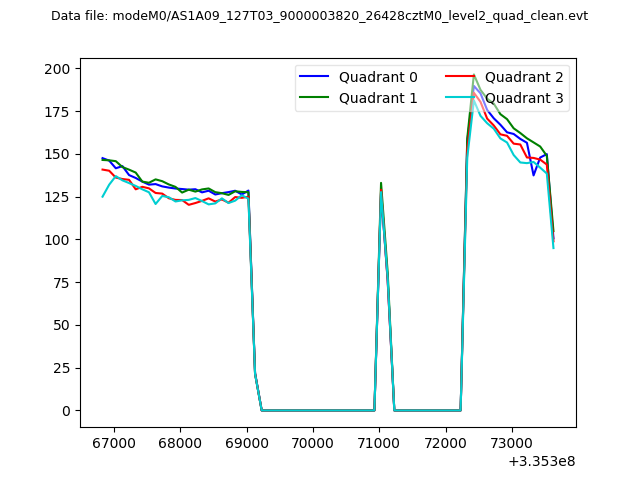 |
|
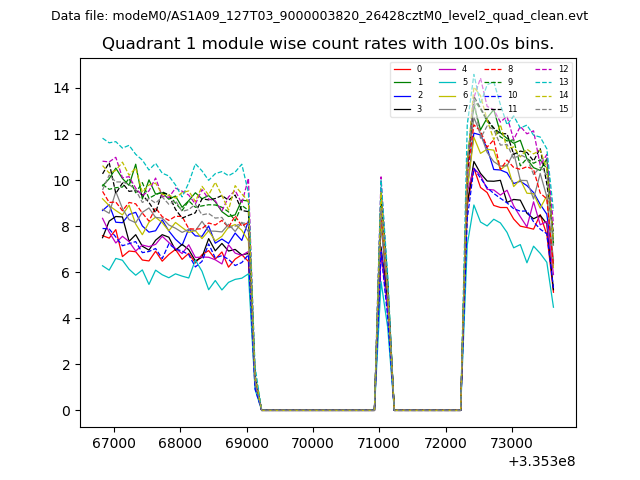
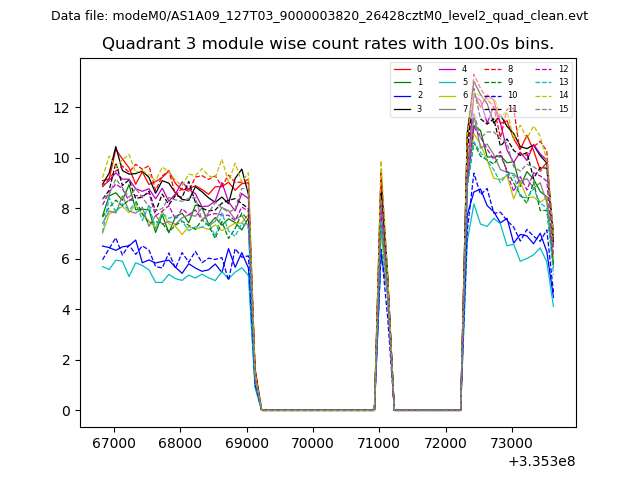
| Module-wise count rates for Quadrant A Data is divided into 100 sec bins |
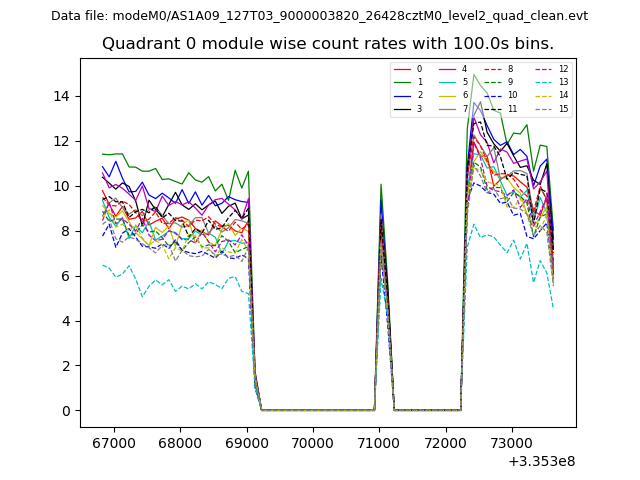 |
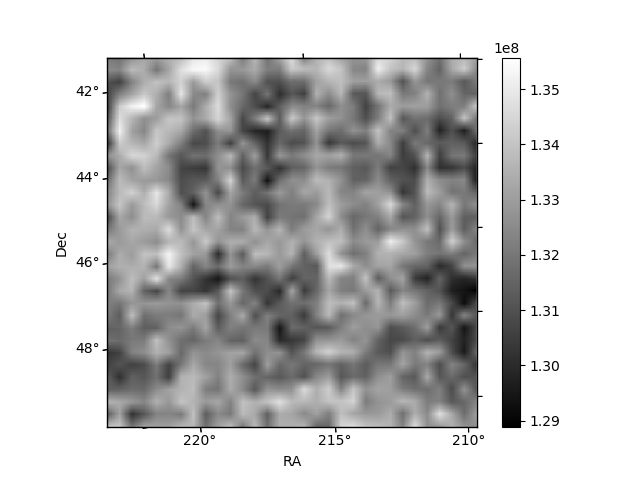 |
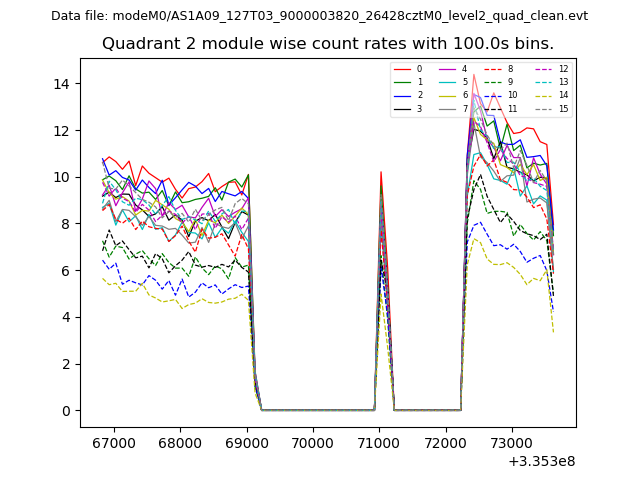
| Module-wise count rates for Quadrant B Data is divided into 100 sec bins |
 |
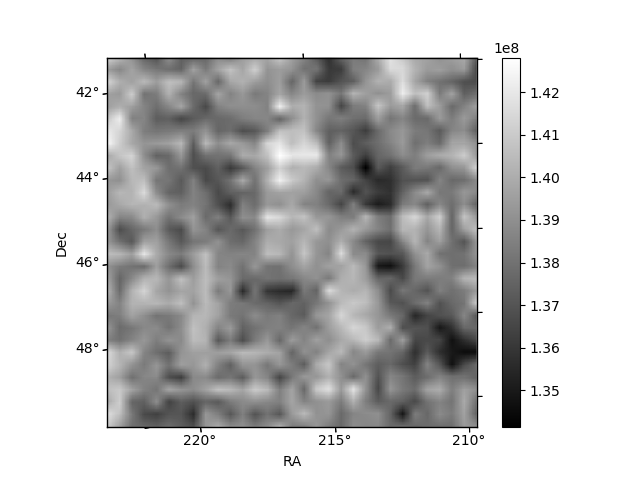 |
| Module-wise count rates for Quadrant C Data is divided into 100 sec bins |
 |
 |
| Module-wise count rates for Quadrant D Data is divided into 100 sec bins |
 |
 |
| Parameter | Plot |
|---|---|
| CZT HV Monitor | 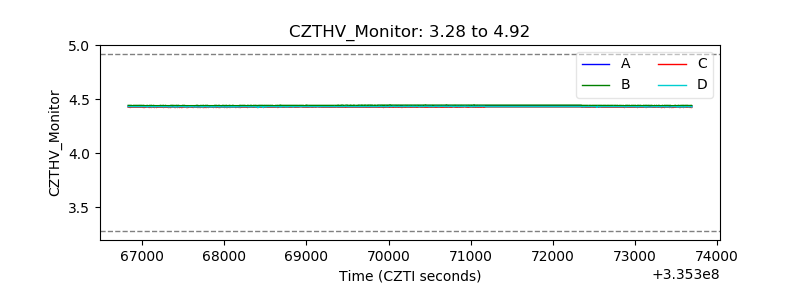 |
| D_VDD | 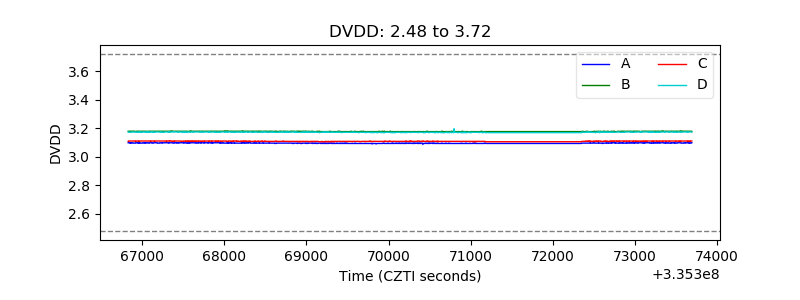 |
| Temperature 1 |  |
| Veto HV Monitor | 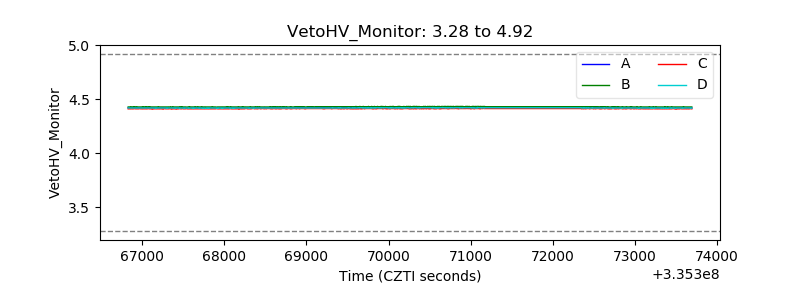 |
| Veto LLD | 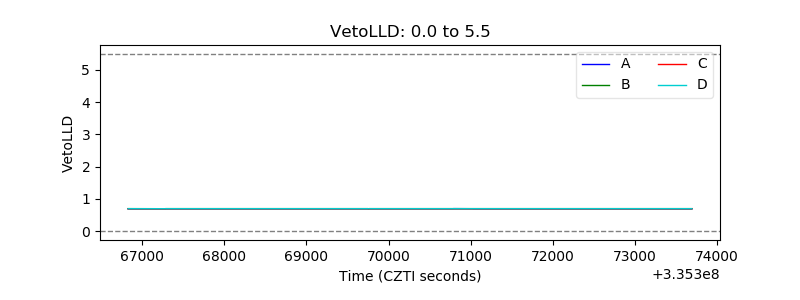 |
| Alpha Counter | 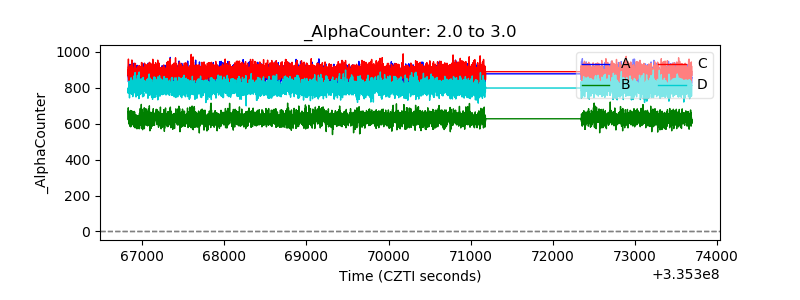 |
| _CPM_Rate | 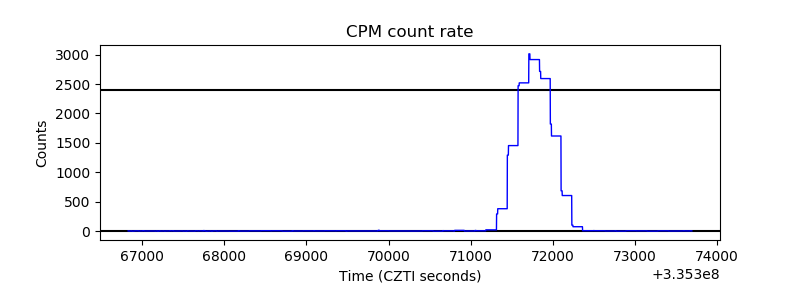 |
| CZT Counter | 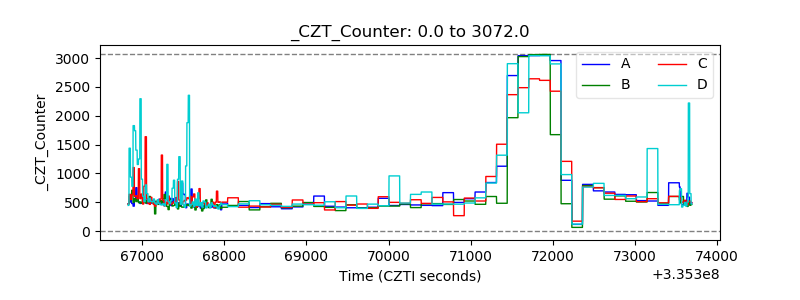 |
| +2.5 Volts monitor | 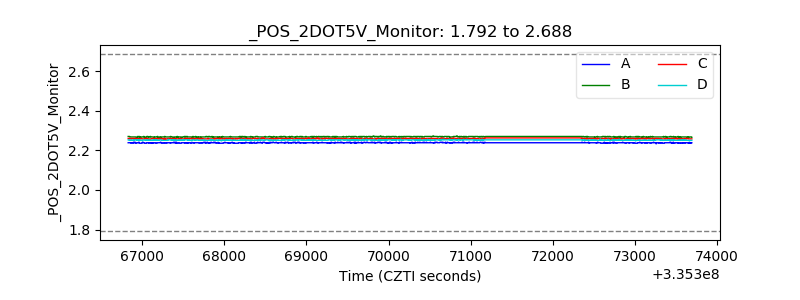 |
| +5 Volts monitor | 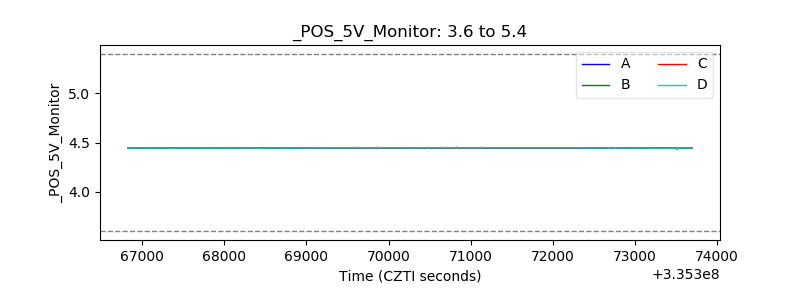 |
| _ROLL_ROT | 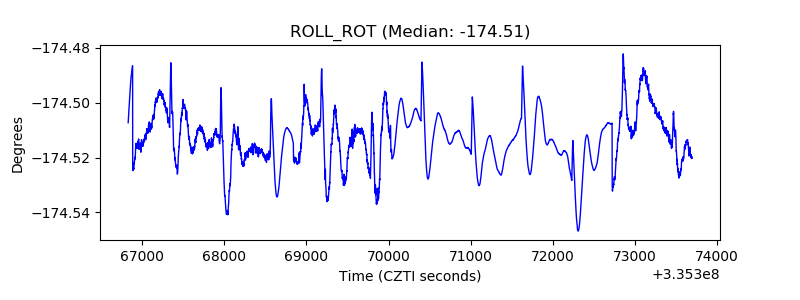 |
| _Roll_DEC | 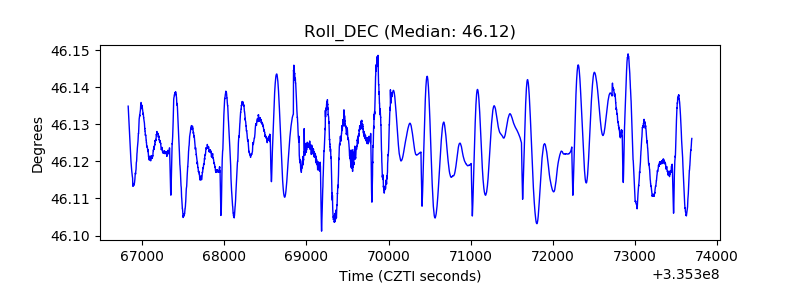 |
| _Roll_RA | 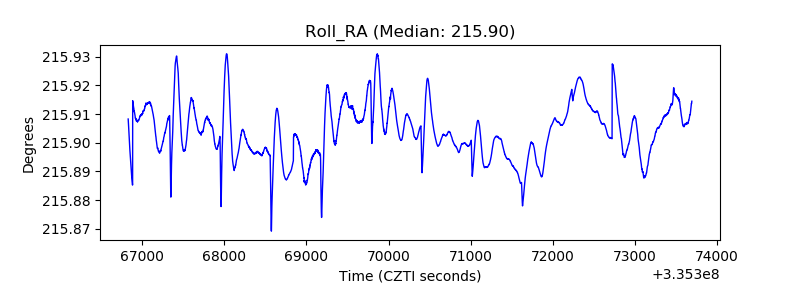 |
| Veto Counter | 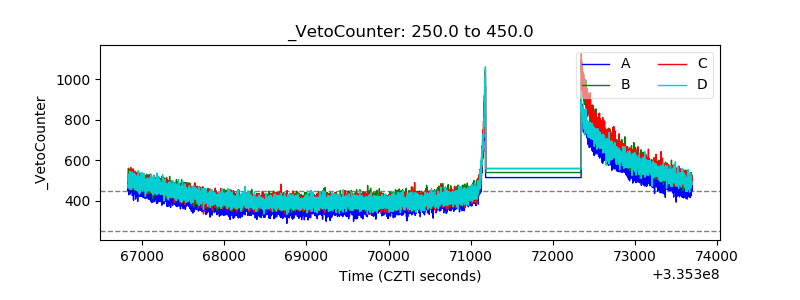 |