| Param | Original file | Final file |
|---|---|---|
| Filename | modeM0/AS1A09_127T03_9000003820_26429cztM0_level2.evt | modeM0/AS1A09_127T03_9000003820_26429cztM0_level2_quad_clean.evt |
| Size (bytes) | 173,488,320 | 47,574,720 |
| Size | 165.5 MB | 45.4 MB |
| Events in quadrant A | 1,237,901 | 326,617 |
| Events in quadrant B | 1,171,551 | 335,539 |
| Events in quadrant C | 1,177,827 | 317,938 |
| Events in quadrant D | 1,521,903 | 308,148 |
| Mode M0 | |||
|---|---|---|---|
| Quadrant | BADHDUFLAG | Total packets | Discarded packets |
| A | 0 | 5090 | 0 |
| B | 0 | 4827 | 0 |
| C | 0 | 4842 | 0 |
| D | 0 | 5975 | 0 |
| Quadrant | Total seconds | Saturated seconds | Saturation percentage |
|---|---|---|---|
| A | 2100 | 34 | 1.619048% |
| B | 2101 | 12 | 0.571157% |
| C | 2101 | 25 | 1.189910% |
| D | 2101 | 75 | 3.569729% |
Noise dominated data is calculated using 1-second bins in cleaned event files. If a bin has >2000 counts, and if more than 50% of those come from <1% of pixels, then it is considered to be noise-dominated and hence unusable.
| Quadrant | # 1 sec bins | Bins with >0 counts | Bins with >2000 counts | High rate bins dominated by noise | Noise dominated (total time) | Noise dominated (detector-on time) | Marked lightcurve |
|---|---|---|---|---|---|---|---|
| A | 2100 | 2100 | 26 | 26 | 1.24% | 1.24% |  |
| B | 2101 | 2101 | 4 | 4 | 0.19% | 0.19% |  |
| C | 2101 | 2101 | 4 | 4 | 0.19% | 0.19% |  |
| D | 2101 | 2101 | 61 | 61 | 2.90% | 2.90% |  |
Top three noisy pixels from each quadrant. If the there are fewer than three noisy pixels in the level2.evt file, extra rows are filled as -1
| Pixel properties | Quadrant properties | ||||||
|---|---|---|---|---|---|---|---|
| Quadrant | DetID | PixID | Counts | Sigma | Mean | Median | Sigma |
| A | 0 | 13 | 116776 | 2075.47 | 279 | 273 | 56.1 |
| A | 6 | 16 | 24136 | 425.11 | 279 | 273 | 56.1 |
| A | 5 | 203 | 12019 | 209.25 | 279 | 273 | 56.1 |
| B | 0 | 244 | 25873 | 492.34 | 278 | 273 | 52.0 |
| B | 5 | 172 | 25744 | 489.86 | 278 | 273 | 52.0 |
| B | 0 | 182 | 18061 | 342.1 | 278 | 273 | 52.0 |
| C | 14 | 238 | 42839 | 675.62 | 271 | 274 | 63.0 |
| C | 2 | 16 | 36298 | 571.8 | 271 | 274 | 63.0 |
| C | 3 | 233 | 35204 | 554.43 | 271 | 274 | 63.0 |
| D | 12 | 233 | 189503 | 2909.74 | 272 | 266 | 65.0 |
| D | 1 | 52 | 163003 | 2502.27 | 272 | 266 | 65.0 |
| D | 7 | 223 | 56705 | 867.82 | 272 | 266 | 65.0 |
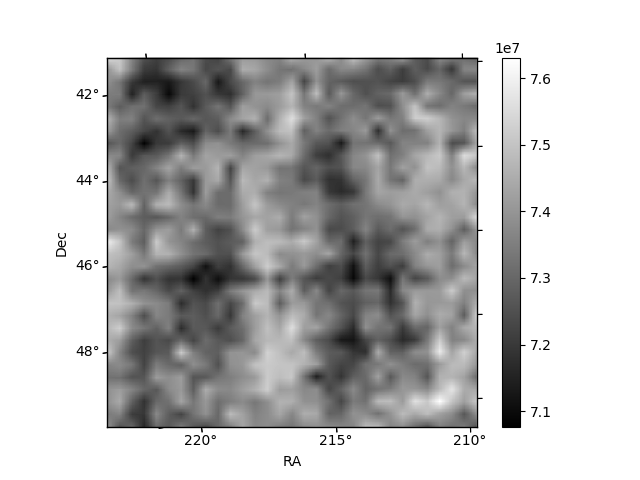
Histogram calculated using DETX and DETY for each event in the final _common_clean file
| Quadrant A | 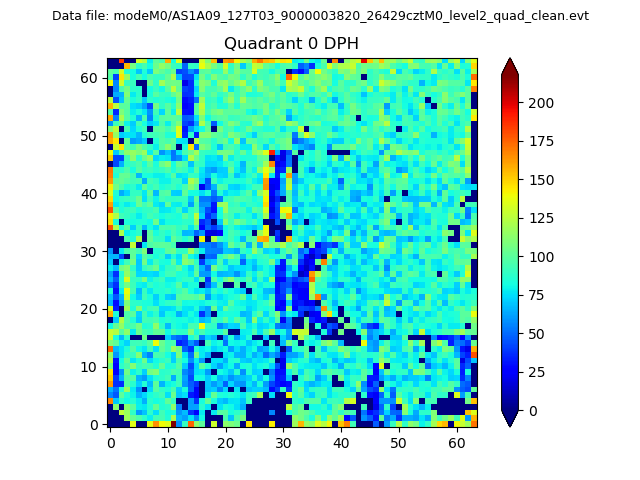 |
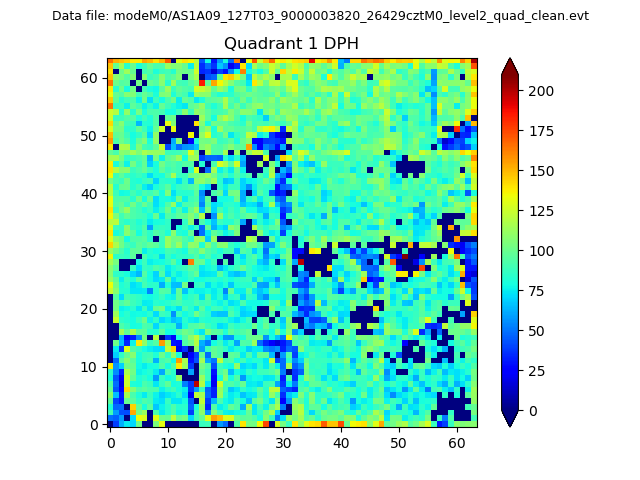 |
Quadrant B |
|---|---|---|---|
| Quadrant D | 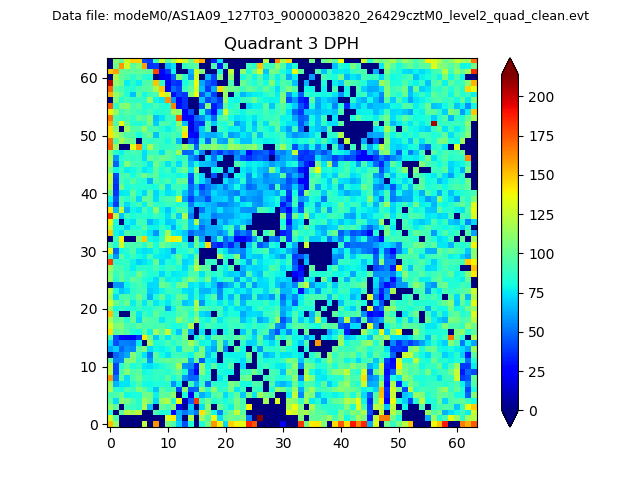 |
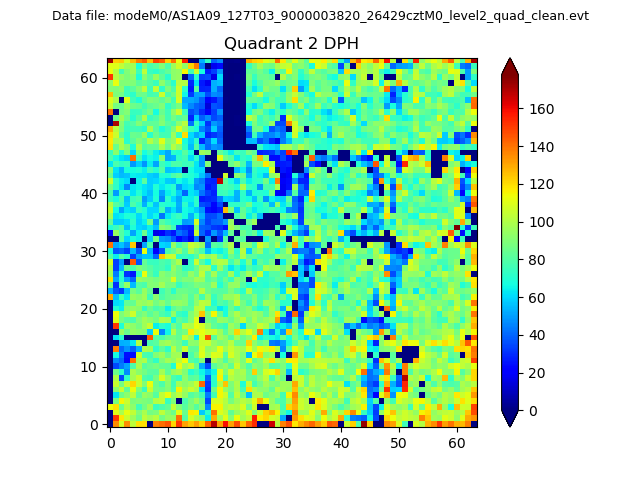 |
Quadrant C |
| Plot type | Count rate plots | Images |
|---|---|---|
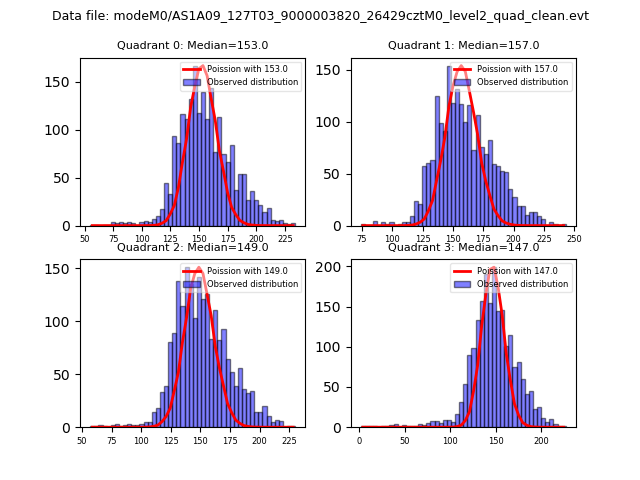
| Comparison with Poisson distribution Blue bars denote a histogram of data divided into 1 sec bins. Red curve is a Poisson curve with rate = median count rate of data. |
 |
 |
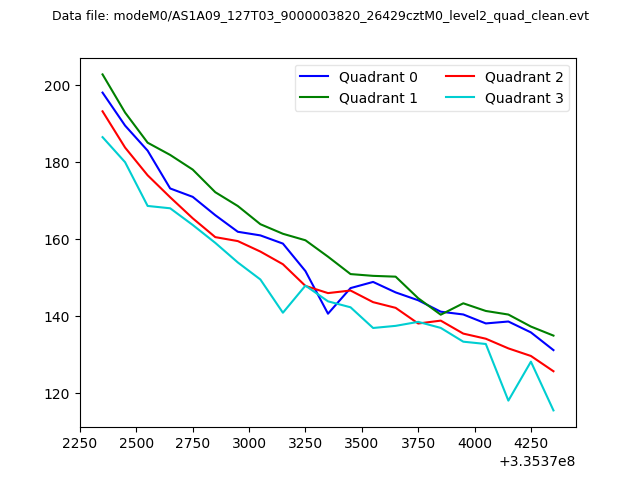
| Quadrant-wise count rates Data is divided into 100 sec bins |
 |
|
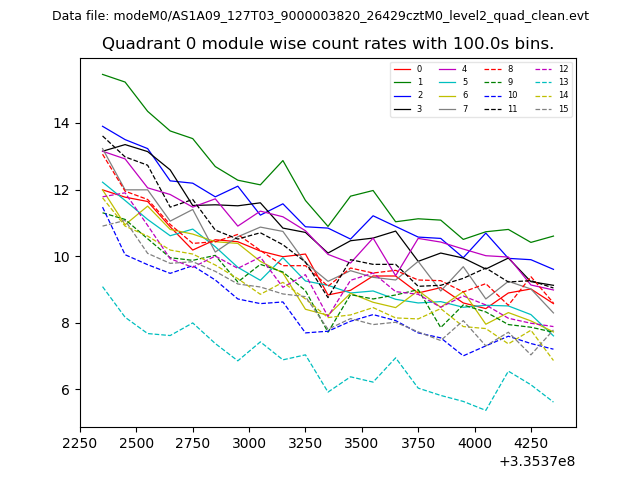
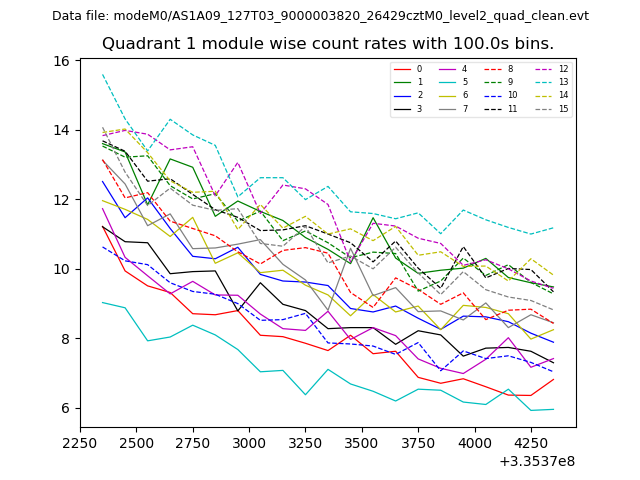
| Module-wise count rates for Quadrant A Data is divided into 100 sec bins |
 |
 |
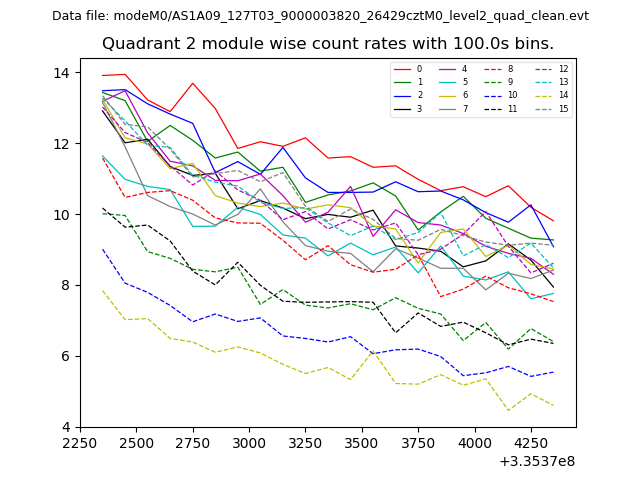
| Module-wise count rates for Quadrant B Data is divided into 100 sec bins |
 |
 |
| Module-wise count rates for Quadrant C Data is divided into 100 sec bins |
 |
 |
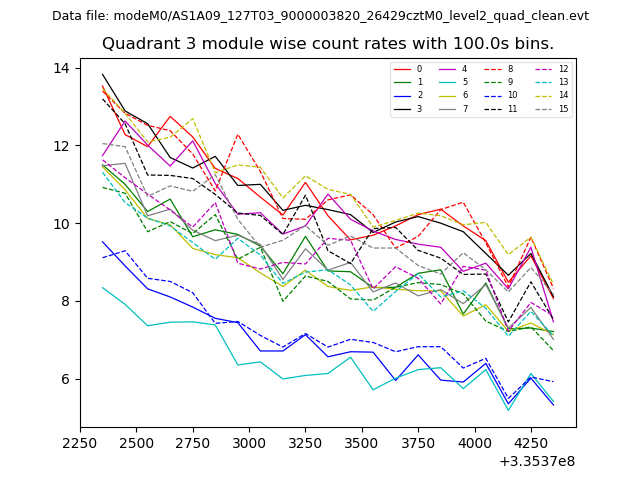
| Module-wise count rates for Quadrant D Data is divided into 100 sec bins |
 |
 |
| Parameter | Plot |
|---|---|
| CZT HV Monitor | 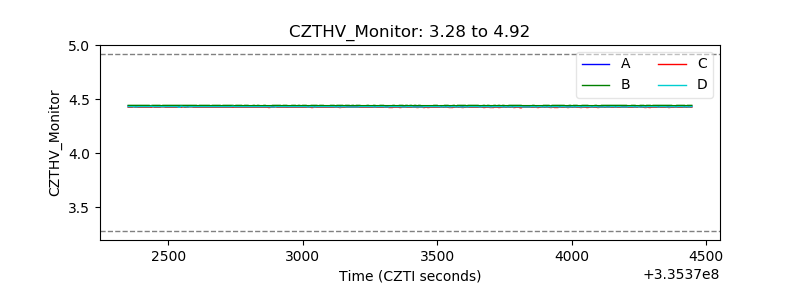 |
| D_VDD | 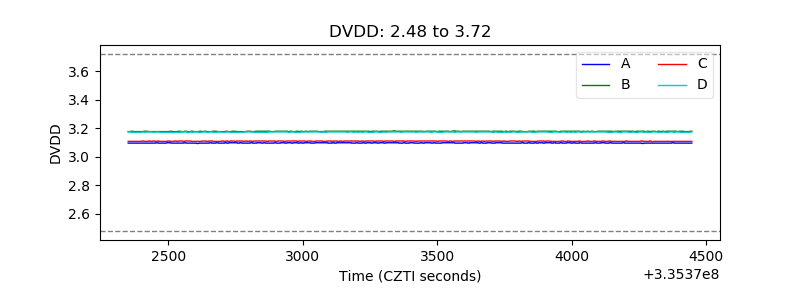 |
| Temperature 1 | 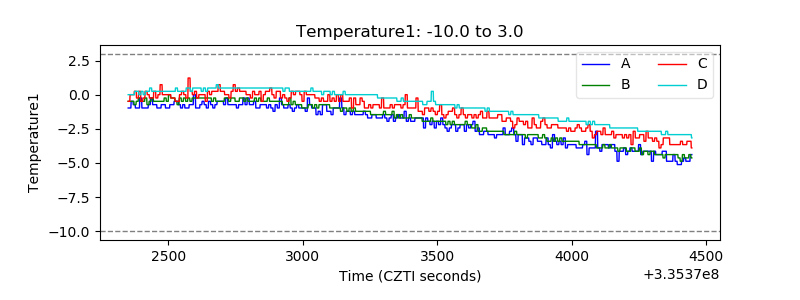 |
| Veto HV Monitor | 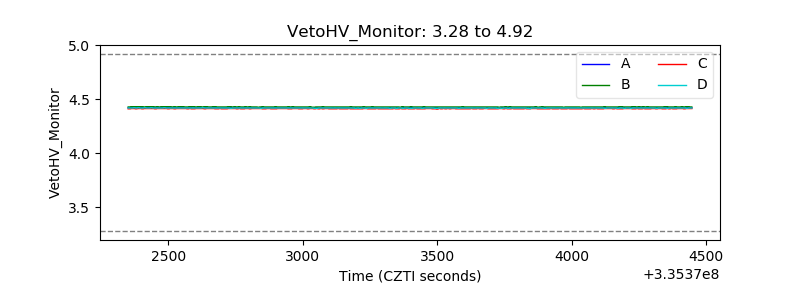 |
| Veto LLD | 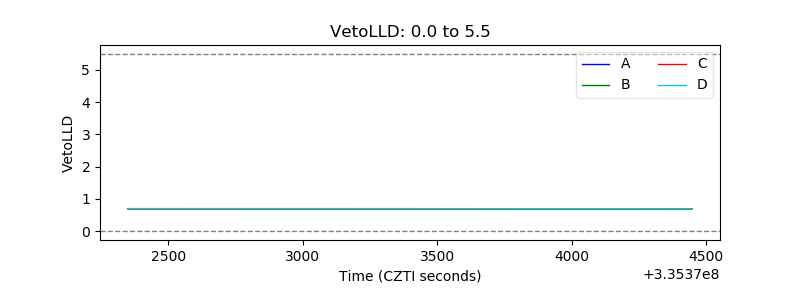 |
| Alpha Counter | 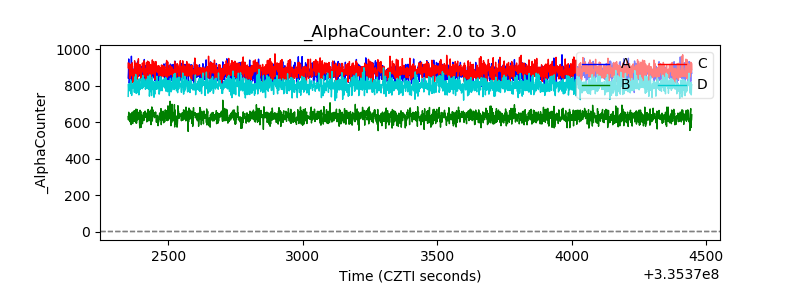 |
| _CPM_Rate | 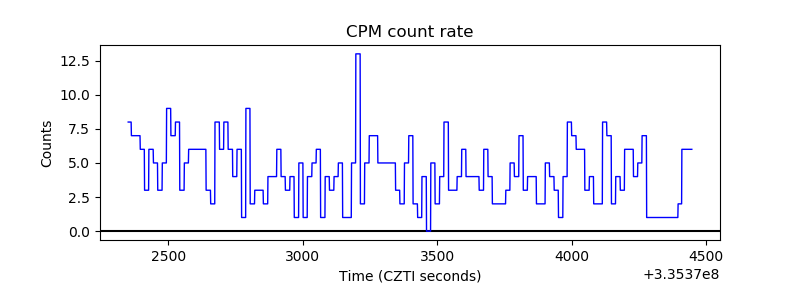 |
| CZT Counter | 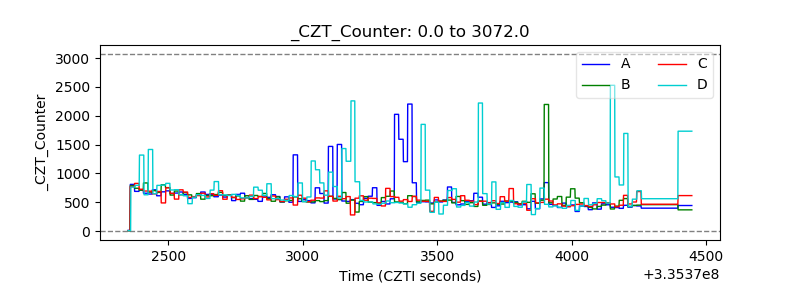 |
| +2.5 Volts monitor | 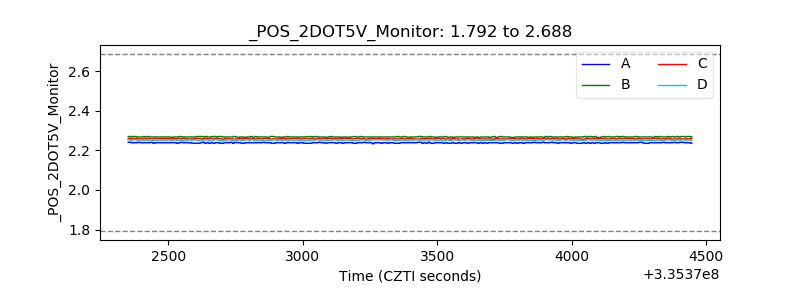 |
| +5 Volts monitor |  |
| _ROLL_ROT | 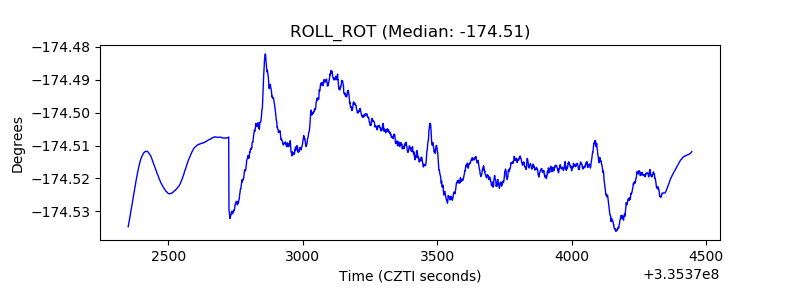 |
| _Roll_DEC |  |
| _Roll_RA |  |
| Veto Counter | 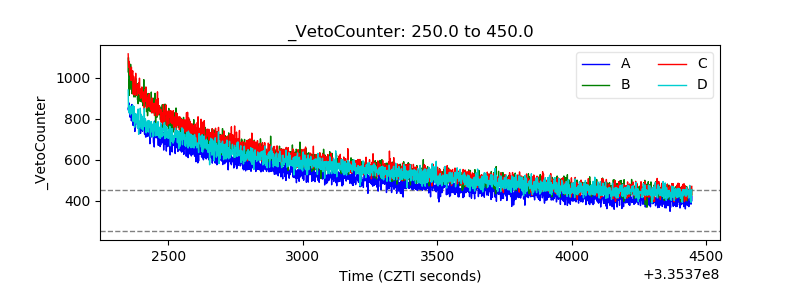 |