| Param | Original file | Final file |
|---|---|---|
| Filename | modeM0/AS1A09_108T02_9000003822cztM0_level2.fits | modeM0/AS1A09_108T02_9000003822cztM0_level2_quad_clean.evt |
| Size (bytes) | 604,399,680 | 472,118,400 |
| Size | 576.4 MB | 450.2 MB |
| Events in quadrant A | 3,741,280 | 2,657,392 |
| Events in quadrant B | 3,614,836 | 2,703,217 |
| Events in quadrant C | 3,686,600 | 2,575,753 |
| Events in quadrant D | 3,153,082 | 2,252,044 |
| Mode M9 | |||
|---|---|---|---|
| Quadrant | BADHDUFLAG | Total packets | Discarded packets |
| A | 0 | 94 | 0 |
| B | 0 | 94 | 0 |
| C | 0 | 94 | 0 |
| D | 0 | 94 | 0 |
| Mode M0 | |||
|---|---|---|---|
| Quadrant | BADHDUFLAG | Total packets | Discarded packets |
| A | 0 | 126965 | 0 |
| B | 0 | 126487 | 0 |
| C | 0 | 135400 | 0 |
| D | 0 | 167959 | 0 |
| Mode SS | |||
|---|---|---|---|
| Quadrant | BADHDUFLAG | Total packets | Discarded packets |
| A | 0 | 1220 | 0 |
| B | 0 | 1220 | 0 |
| C | 0 | 1220 | 0 |
| D | 0 | 1220 | 0 |
| Quadrant | Total seconds | Saturated seconds | Saturation percentage |
|---|---|---|---|
| A | 59878 | 618 | 1.032099% |
| B | 59878 | 734 | 1.225826% |
| C | 59878 | 1489 | 2.486723% |
| D | 59878 | 4031 | 6.732022% |
Noise dominated data is calculated using 1-second bins in cleaned event files. If a bin has >2000 counts, and if more than 50% of those come from <1% of pixels, then it is considered to be noise-dominated and hence unusable.
| Quadrant | # 1 sec bins | Bins with >0 counts | Bins with >2000 counts | High rate bins dominated by noise | Noise dominated (total time) | Noise dominated (detector-on time) | Marked lightcurve |
|---|---|---|---|---|---|---|---|
| A | 69268 | 59874 | 0 | 0 | 0.00% | 0.00% | 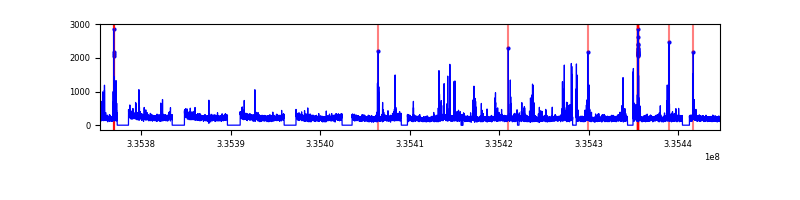 |
| B | 69268 | 59874 | 0 | 0 | 0.00% | 0.00% | 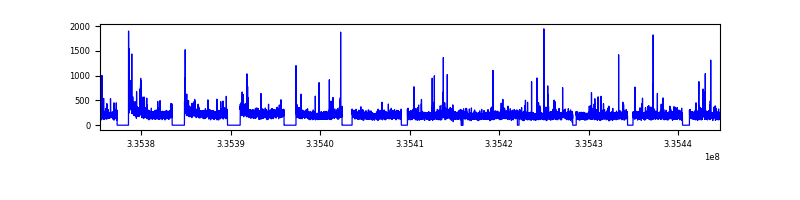 |
| C | 69268 | 59865 | 0 | 0 | 0.00% | 0.00% | 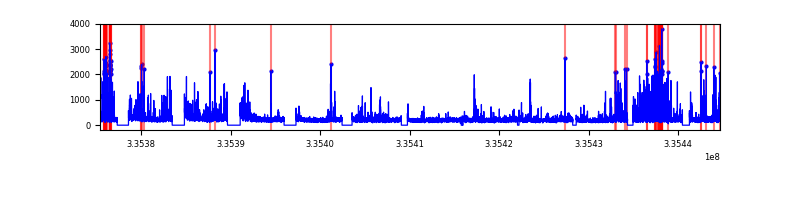 |
| D | 69268 | 59811 | 0 | 0 | 0.00% | 0.00% | 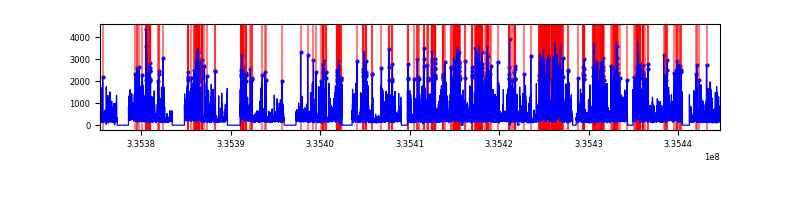 |
Top three noisy pixels from each quadrant. If the there are fewer than three noisy pixels in the level2.evt file, extra rows are filled as -1
| Pixel properties | Quadrant properties | ||||||
|---|---|---|---|---|---|---|---|
| Quadrant | DetID | PixID | Counts | Sigma | Mean | Median | Sigma |
| A | 0 | 29 | 3018 | 8.83 | 972 | 914 | 238.4 |
| A | 7 | 110 | 3013 | 8.81 | 972 | 914 | 238.4 |
| A | 9 | 19 | 2753 | 7.71 | 972 | 914 | 238.4 |
| B | 2 | 9 | 2818 | 10.13 | 955 | 912 | 188.1 |
| B | 5 | 255 | 2371 | 7.76 | 955 | 912 | 188.1 |
| B | 3 | 80 | 2363 | 7.71 | 955 | 912 | 188.1 |
| C | 1 | 81 | 2958 | 8.31 | 973 | 913 | 246.1 |
| C | 1 | 80 | 2877 | 7.98 | 973 | 913 | 246.1 |
| C | 3 | 126 | 2466 | 6.31 | 973 | 913 | 246.1 |
| D | 3 | 14 | 2339 | 6.36 | 899 | 820 | 239.0 |
| D | 10 | 189 | 2273 | 6.08 | 899 | 820 | 239.0 |
| D | 7 | 3 | 2261 | 6.03 | 899 | 820 | 239.0 |
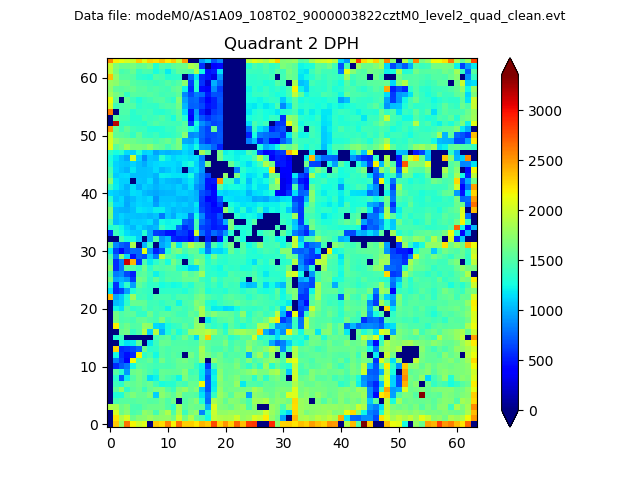
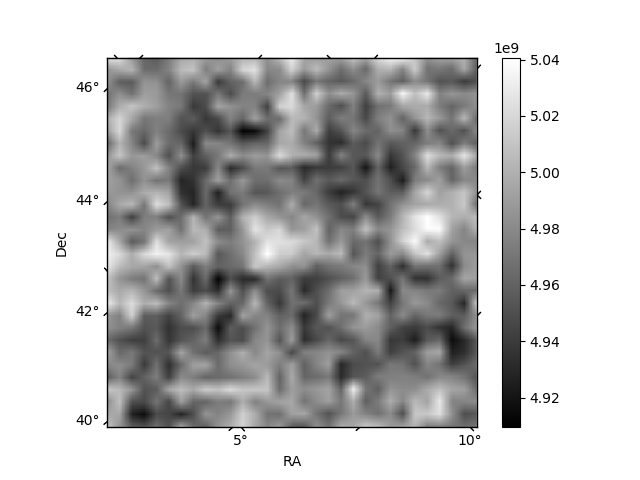
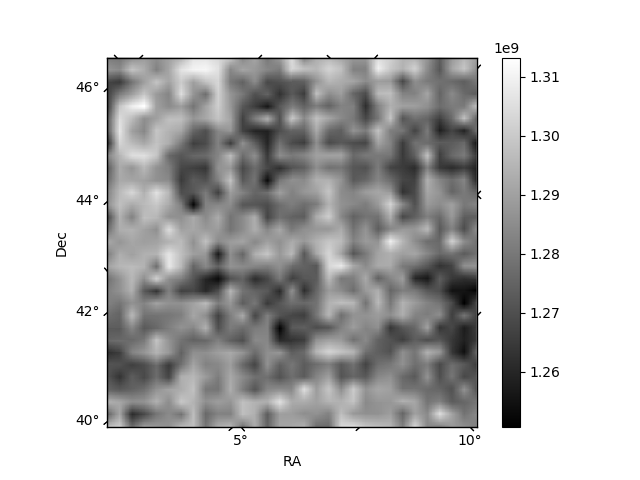
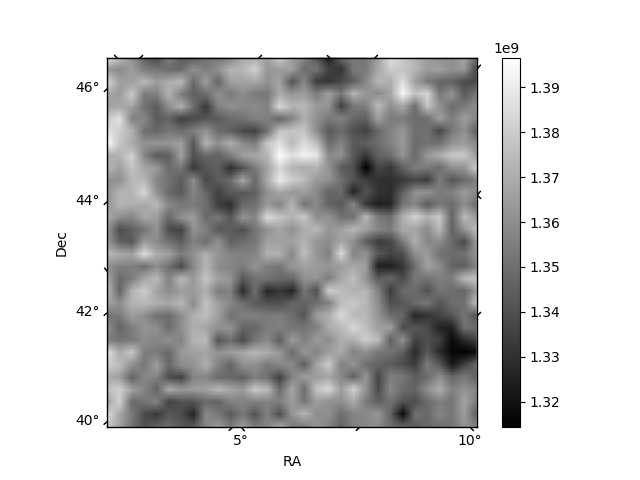
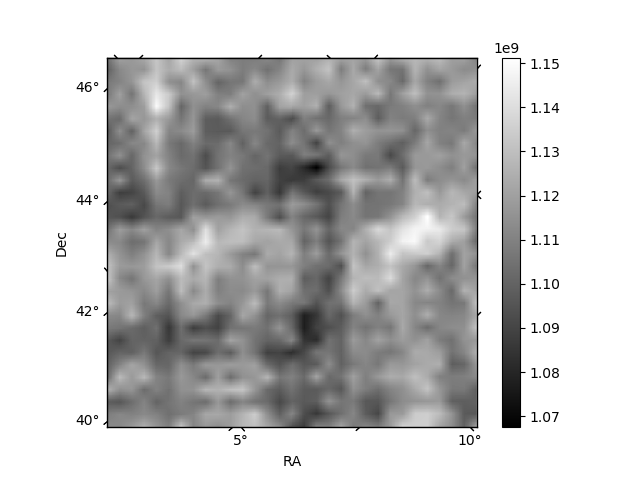
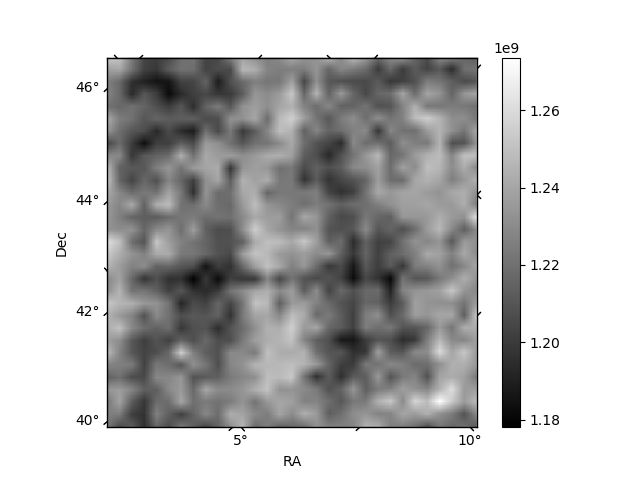
Histogram calculated using DETX and DETY for each event in the final _common_clean file
| Quadrant A | 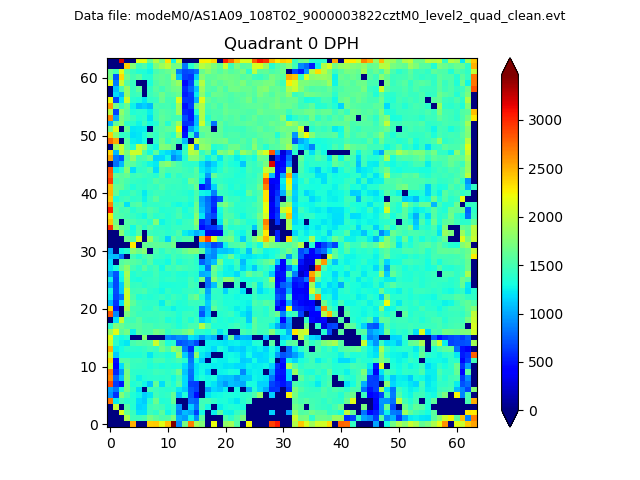 |
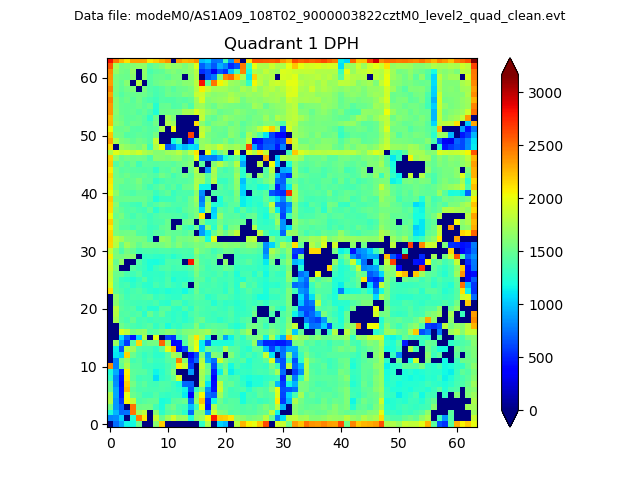 |
Quadrant B |
|---|---|---|---|
| Quadrant D | 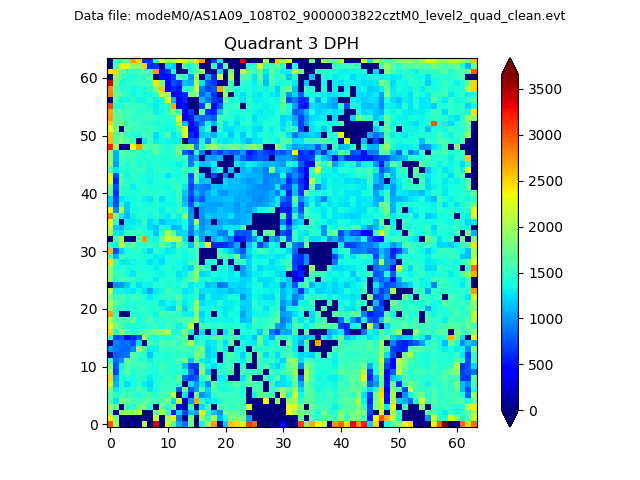 |
 |
Quadrant C |
| Plot type | Count rate plots | Images |
|---|---|---|
| Comparison with Poisson distribution Blue bars denote a histogram of data divided into 1 sec bins. Red curve is a Poisson curve with rate = median count rate of data. |
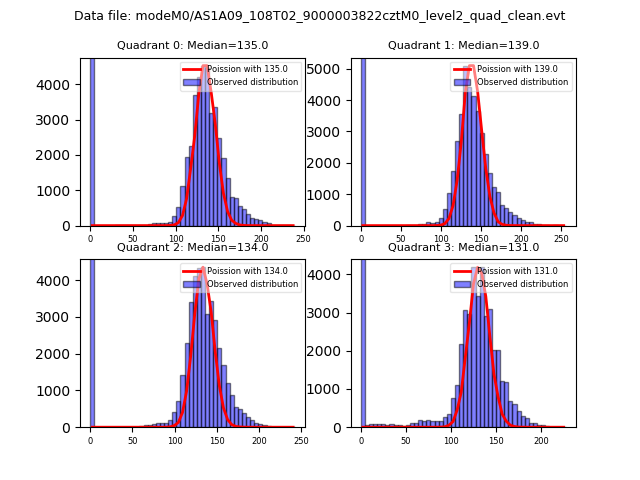 |
 |
| Quadrant-wise count rates Data is divided into 100 sec bins |
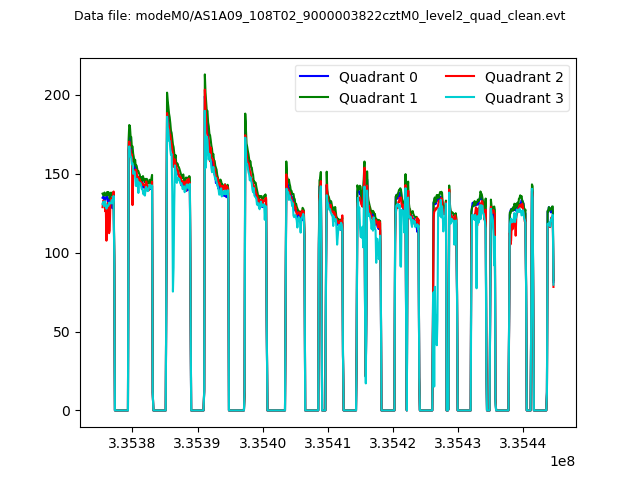 |
|
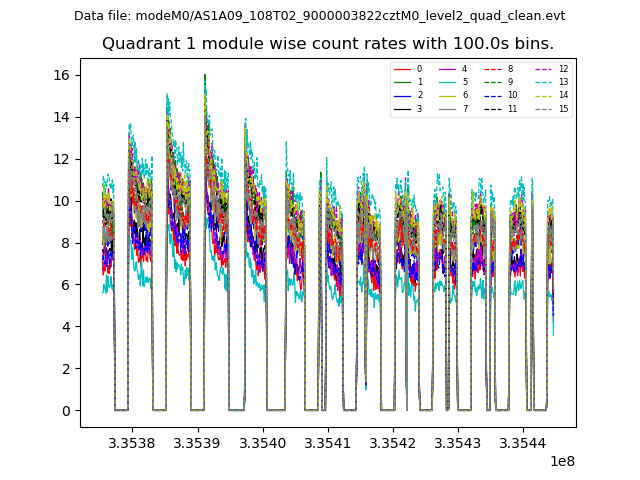
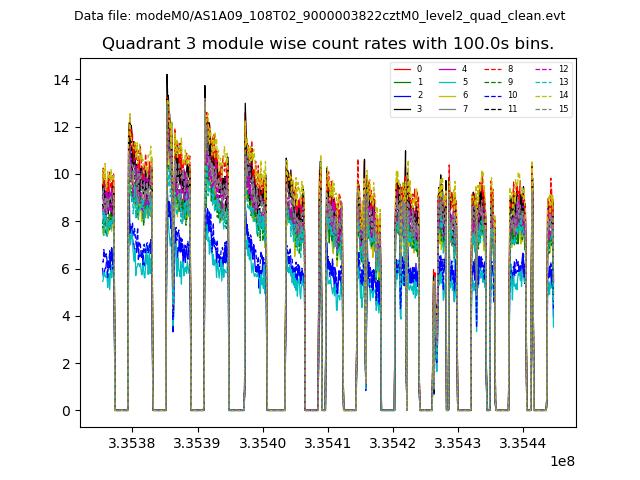
| Module-wise count rates for Quadrant A Data is divided into 100 sec bins |
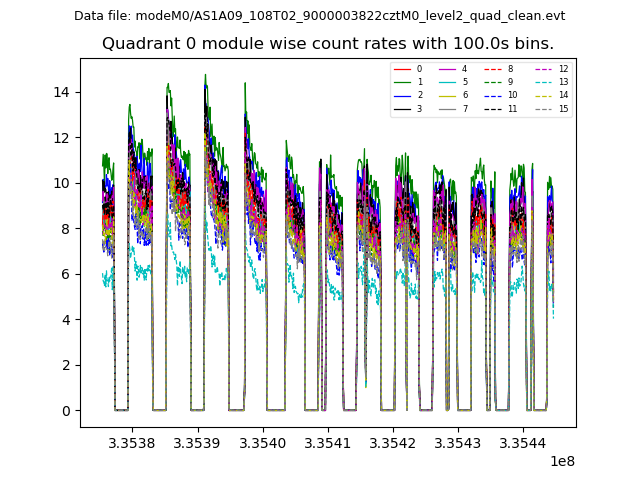 |
 |
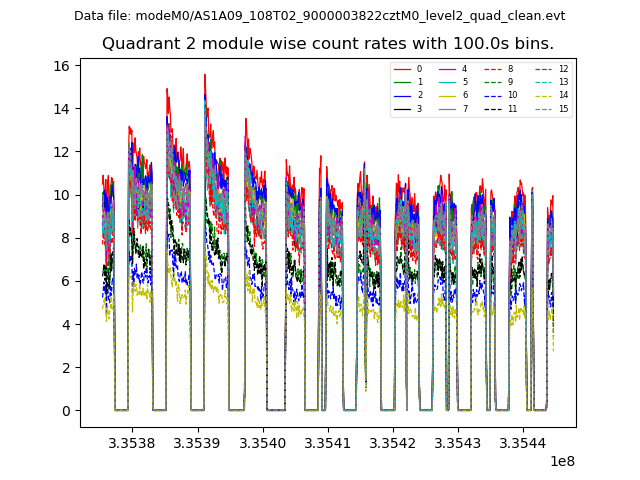
| Module-wise count rates for Quadrant B Data is divided into 100 sec bins |
 |
 |
| Module-wise count rates for Quadrant C Data is divided into 100 sec bins |
 |
 |
| Module-wise count rates for Quadrant D Data is divided into 100 sec bins |
 |
 |
| Parameter | Plot |
|---|---|
| CZT HV Monitor | 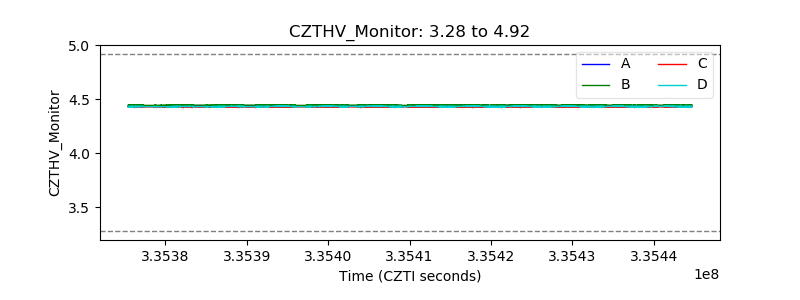 |
| D_VDD | 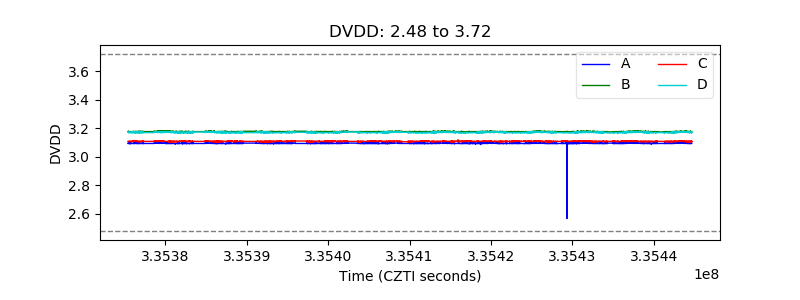 |
| Temperature 1 | 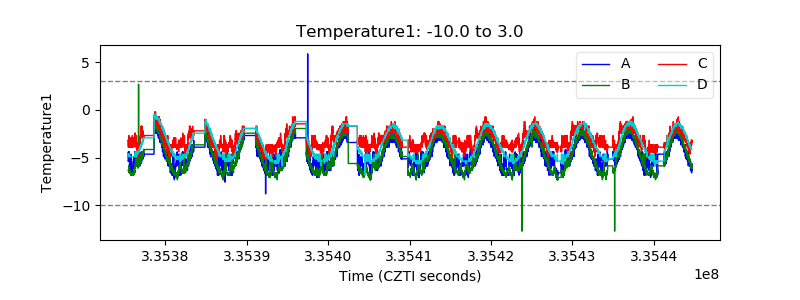 |
| Veto HV Monitor | 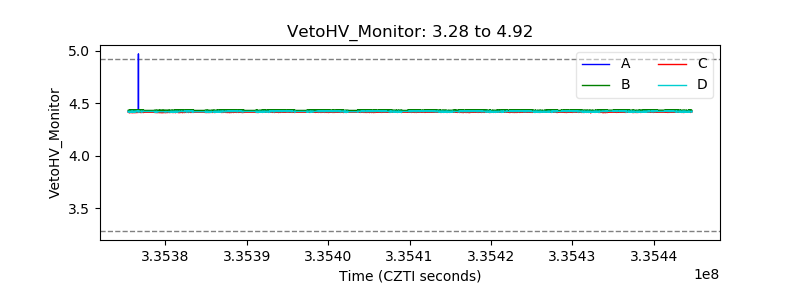 |
| Veto LLD | 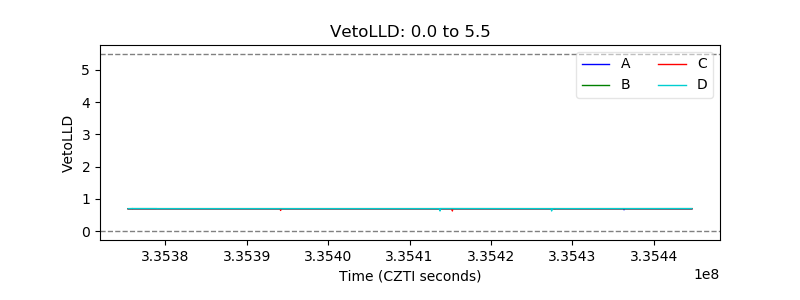 |
| Alpha Counter | 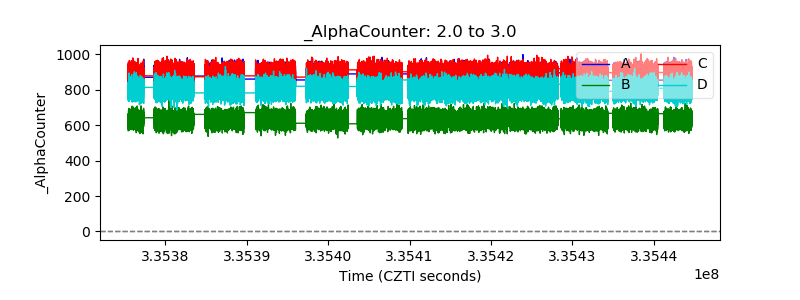 |
| _CPM_Rate | 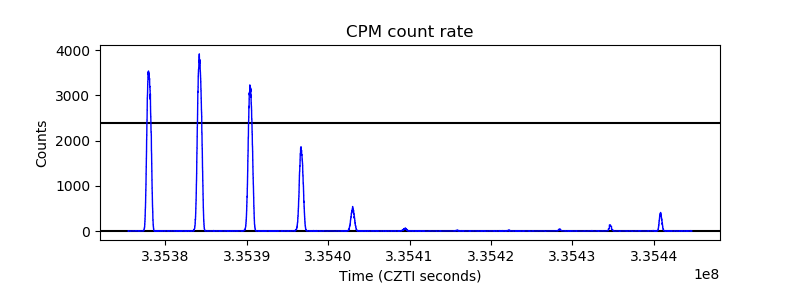 |
| CZT Counter | 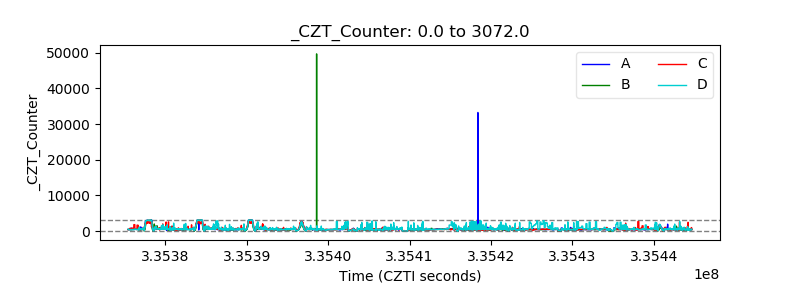 |
| +2.5 Volts monitor | 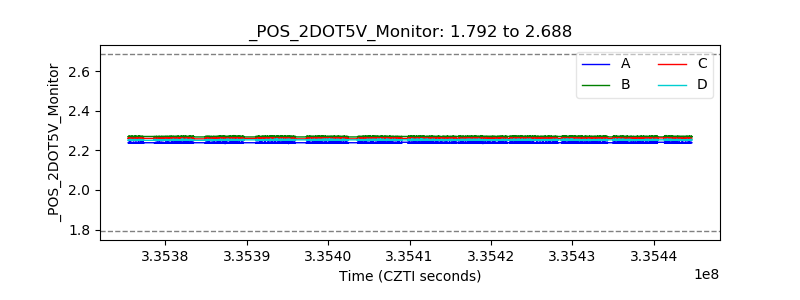 |
| +5 Volts monitor | 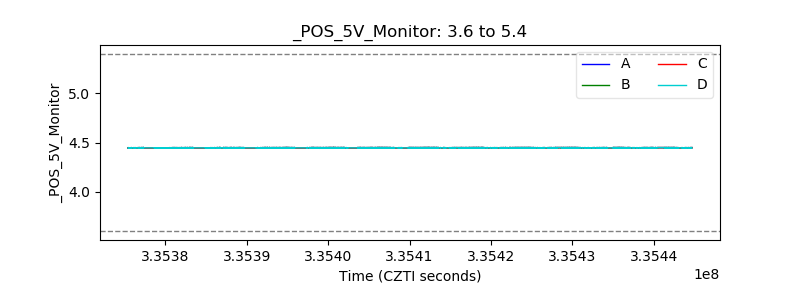 |
| _ROLL_ROT | 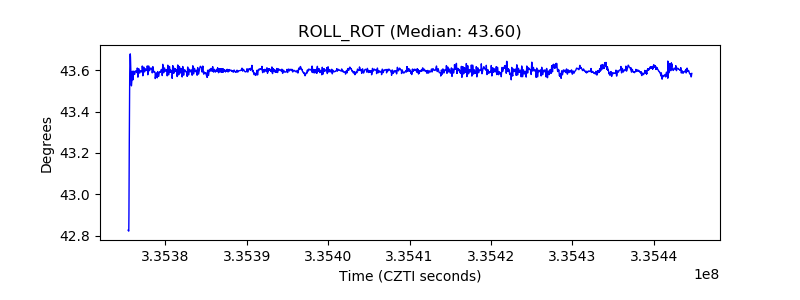 |
| _Roll_DEC | 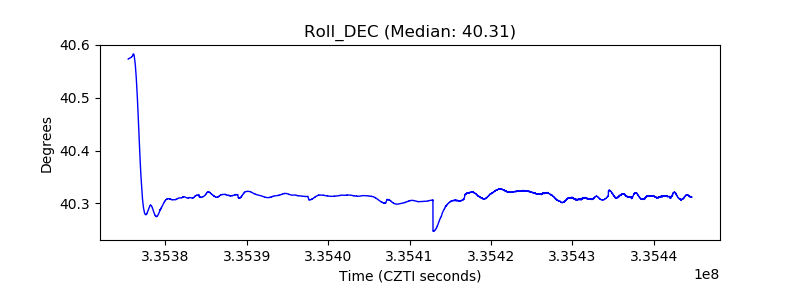 |
| _Roll_RA | 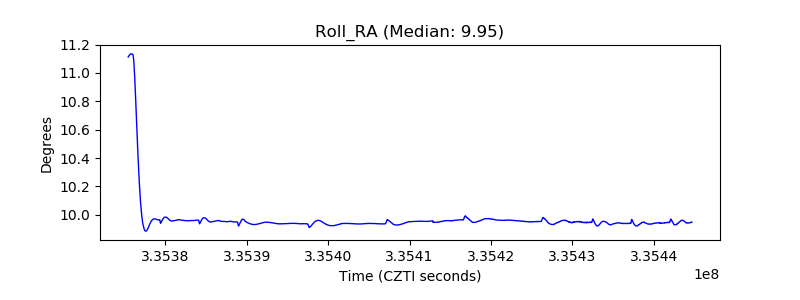 |
| Veto Counter | 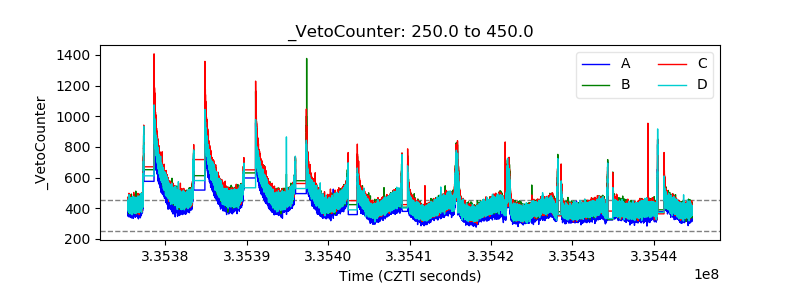 |