| Param | Original file | Final file |
|---|---|---|
| Filename | modeM0/AS1A09_108T02_9000003822_26429cztM0_level2.evt | modeM0/AS1A09_108T02_9000003822_26429cztM0_level2_quad_clean.evt |
| Size (bytes) | 263,237,760 | 47,952,000 |
| Size | 251.0 MB | 45.7 MB |
| Events in quadrant A | 1,790,509 | 310,776 |
| Events in quadrant B | 1,866,172 | 319,587 |
| Events in quadrant C | 2,232,425 | 298,877 |
| Events in quadrant D | 1,872,154 | 303,080 |
| Mode M9 | |||
|---|---|---|---|
| Quadrant | BADHDUFLAG | Total packets | Discarded packets |
| A | 0 | 13 | 0 |
| B | 0 | 13 | 0 |
| C | 0 | 13 | 0 |
| D | 0 | 13 | 0 |
| Mode M0 | |||
|---|---|---|---|
| Quadrant | BADHDUFLAG | Total packets | Discarded packets |
| A | 0 | 7533 | 0 |
| B | 0 | 7649 | 0 |
| C | 0 | 8769 | 0 |
| D | 0 | 7710 | 0 |
| Quadrant | Total seconds | Saturated seconds | Saturation percentage |
|---|---|---|---|
| A | 3090 | 71 | 2.297735% |
| B | 3090 | 91 | 2.944984% |
| C | 3090 | 228 | 7.378641% |
| D | 3089 | 78 | 2.525089% |
Noise dominated data is calculated using 1-second bins in cleaned event files. If a bin has >2000 counts, and if more than 50% of those come from <1% of pixels, then it is considered to be noise-dominated and hence unusable.
| Quadrant | # 1 sec bins | Bins with >0 counts | Bins with >2000 counts | High rate bins dominated by noise | Noise dominated (total time) | Noise dominated (detector-on time) | Marked lightcurve |
|---|---|---|---|---|---|---|---|
| A | 4355 | 3090 | 7 | 7 | 0.16% | 0.23% | 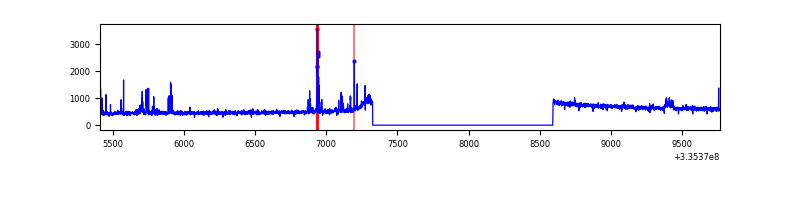 |
| B | 4355 | 3090 | 3 | 3 | 0.07% | 0.10% | 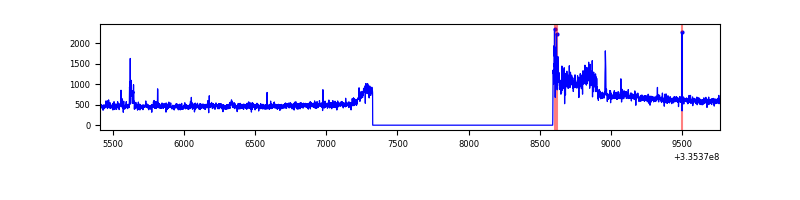 |
| C | 4355 | 3090 | 92 | 92 | 2.11% | 2.98% | 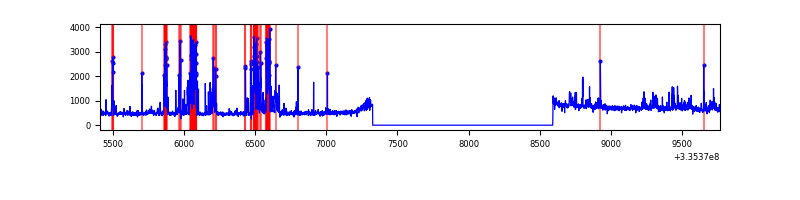 |
| D | 4354 | 3089 | 22 | 22 | 0.51% | 0.71% | 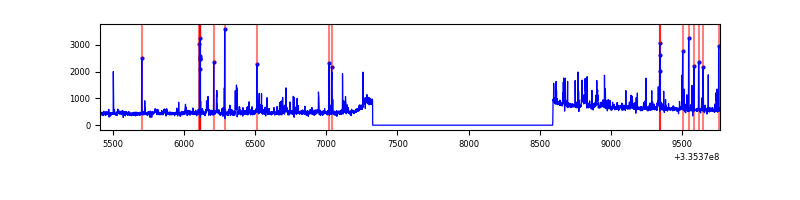 |
Top three noisy pixels from each quadrant. If the there are fewer than three noisy pixels in the level2.evt file, extra rows are filled as -1
| Pixel properties | Quadrant properties | ||||||
|---|---|---|---|---|---|---|---|
| Quadrant | DetID | PixID | Counts | Sigma | Mean | Median | Sigma |
| A | 0 | 13 | 74805 | 844.29 | 434 | 427 | 88.1 |
| A | 6 | 16 | 39454 | 443.01 | 434 | 427 | 88.1 |
| A | 13 | 254 | 4866 | 50.39 | 434 | 427 | 88.1 |
| B | 0 | 244 | 84259 | 1014.44 | 434 | 425 | 82.6 |
| B | 5 | 172 | 30113 | 359.24 | 434 | 425 | 82.6 |
| B | 7 | 205 | 19094 | 225.91 | 434 | 425 | 82.6 |
| C | 2 | 16 | 423238 | 4339.33 | 415 | 419 | 97.4 |
| C | 3 | 233 | 73675 | 751.82 | 415 | 419 | 97.4 |
| C | 14 | 238 | 66288 | 676.0 | 415 | 419 | 97.4 |
| D | 1 | 52 | 162247 | 1595.67 | 425 | 416 | 101.4 |
| D | 11 | 176 | 67757 | 663.99 | 425 | 416 | 101.4 |
| D | 2 | 234 | 14290 | 136.8 | 425 | 416 | 101.4 |
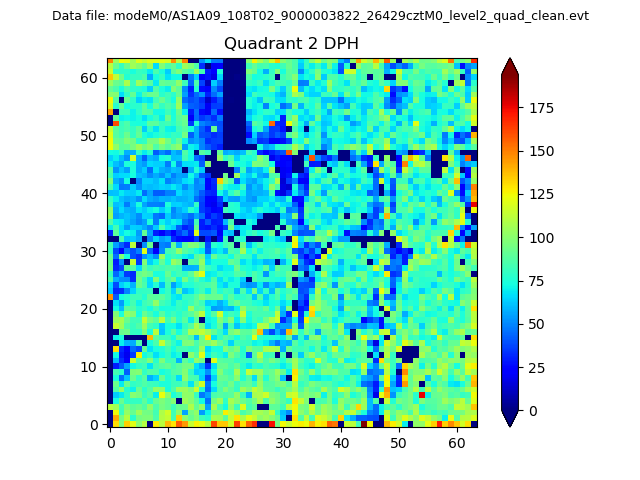
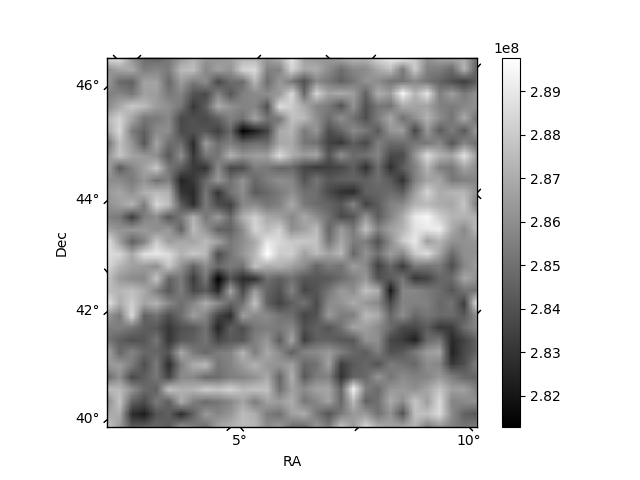
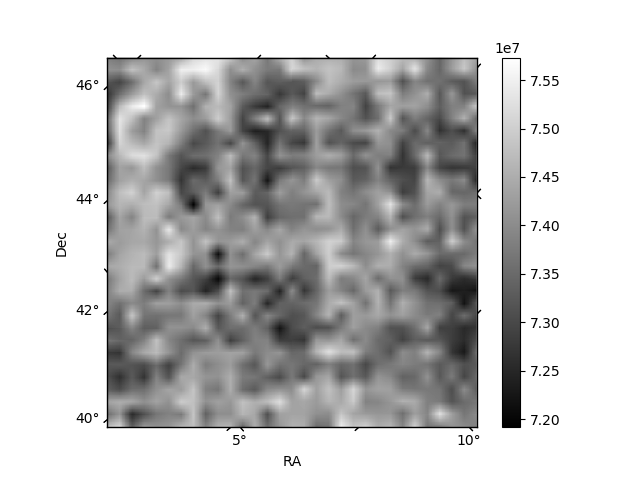
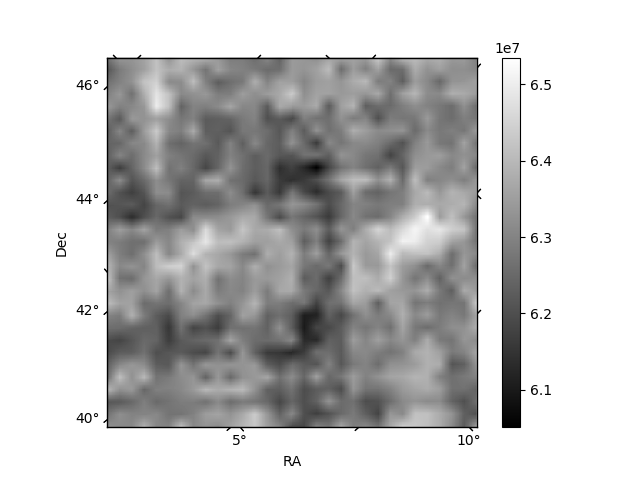
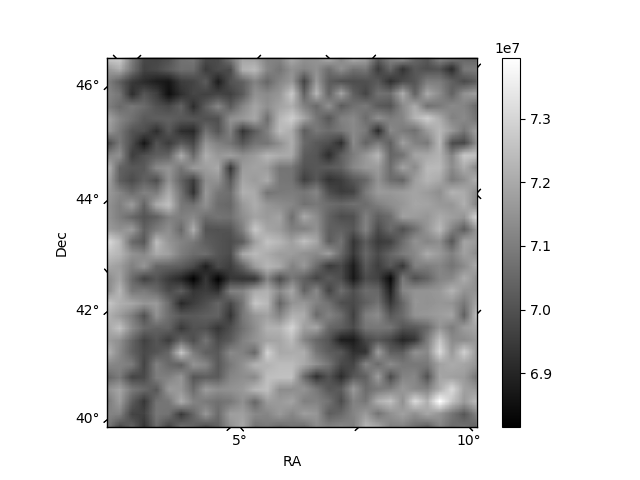
Histogram calculated using DETX and DETY for each event in the final _common_clean file
| Quadrant A | 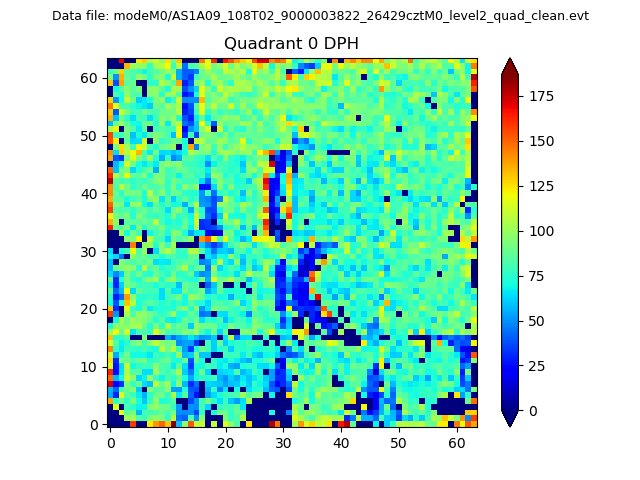 |
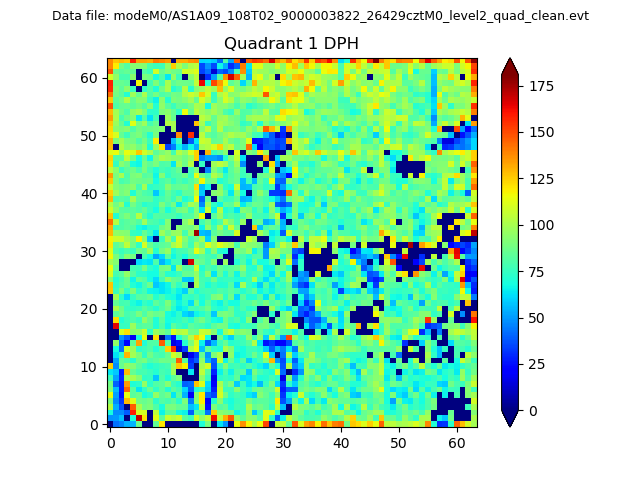 |
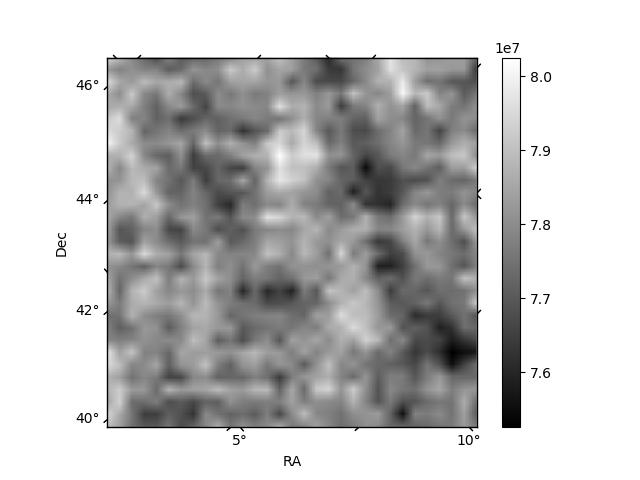
Quadrant B |
|---|---|---|---|
| Quadrant D | 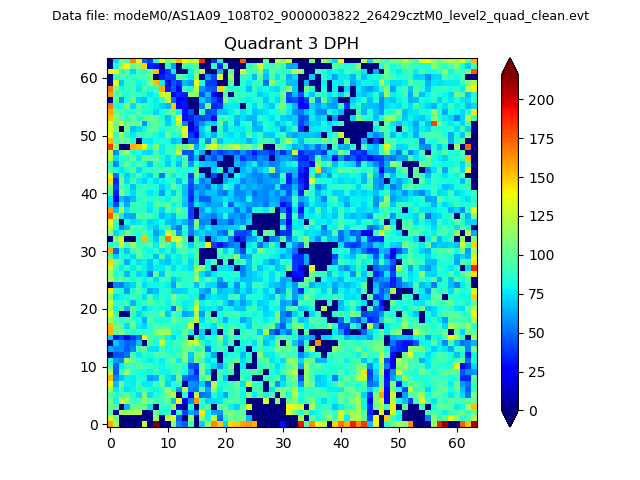 |
 |
Quadrant C |
| Plot type | Count rate plots | Images |
|---|---|---|
| Comparison with Poisson distribution Blue bars denote a histogram of data divided into 1 sec bins. Red curve is a Poisson curve with rate = median count rate of data. |
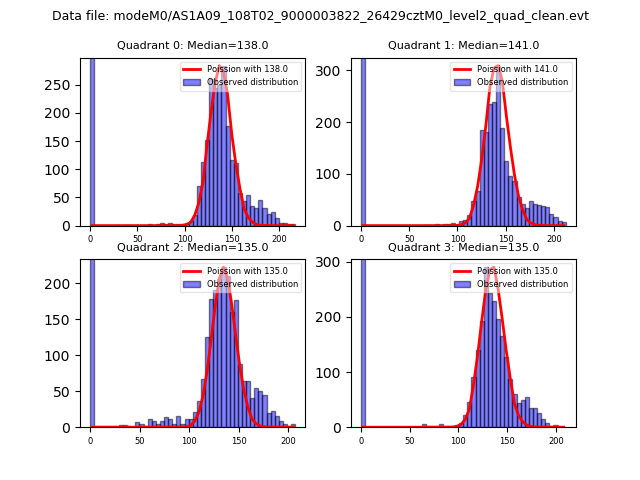 |
 |
| Quadrant-wise count rates Data is divided into 100 sec bins |
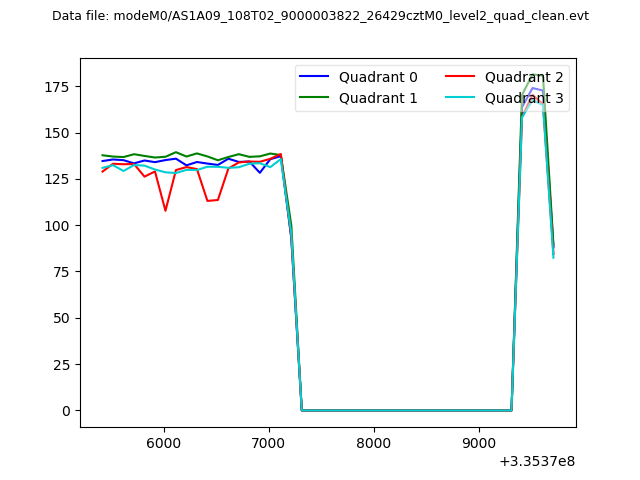 |
|
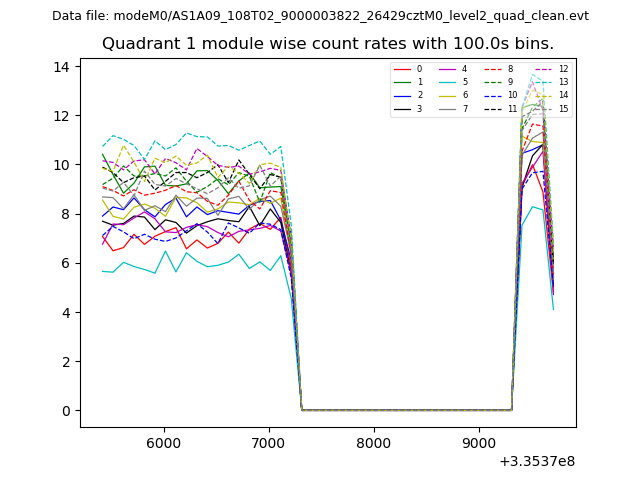
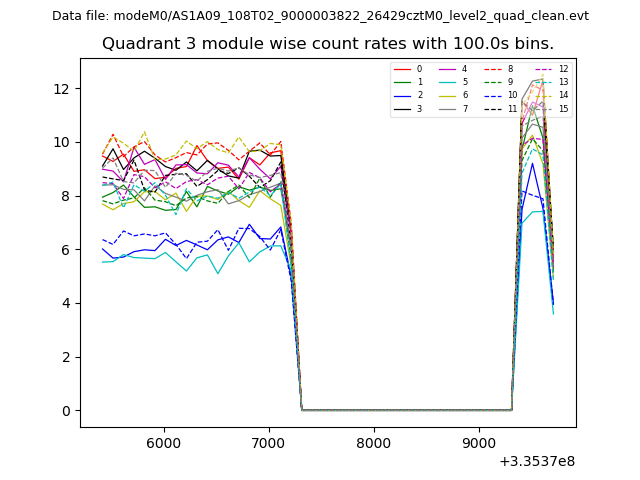
| Module-wise count rates for Quadrant A Data is divided into 100 sec bins |
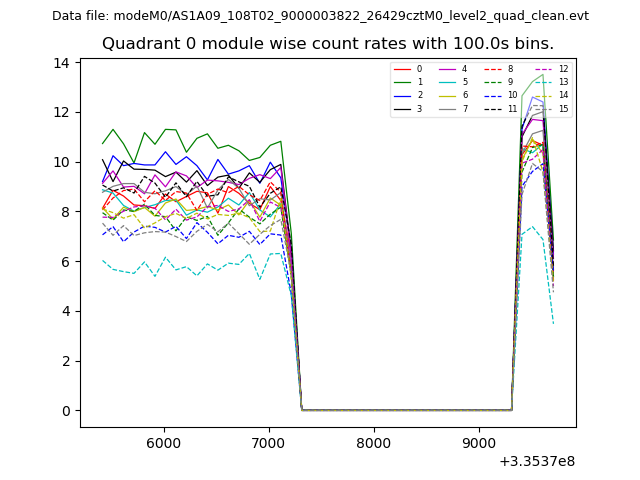 |
 |
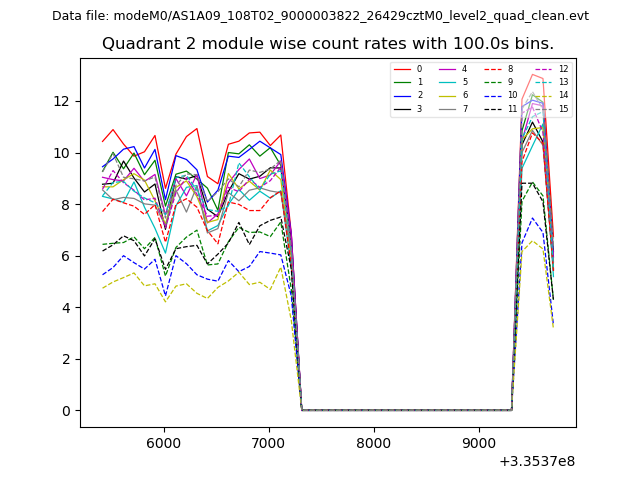
| Module-wise count rates for Quadrant B Data is divided into 100 sec bins |
 |
 |
| Module-wise count rates for Quadrant C Data is divided into 100 sec bins |
 |
 |
| Module-wise count rates for Quadrant D Data is divided into 100 sec bins |
 |
 |
| Parameter | Plot |
|---|---|
| CZT HV Monitor | 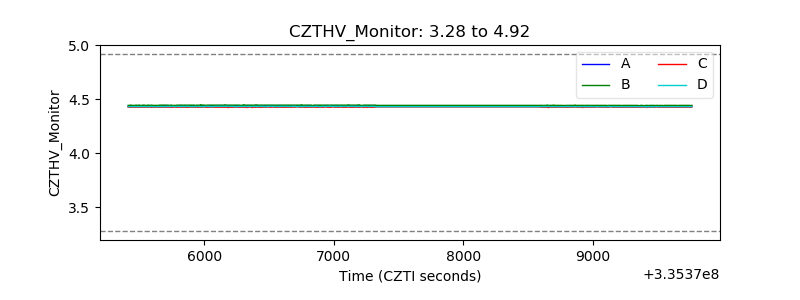 |
| D_VDD | 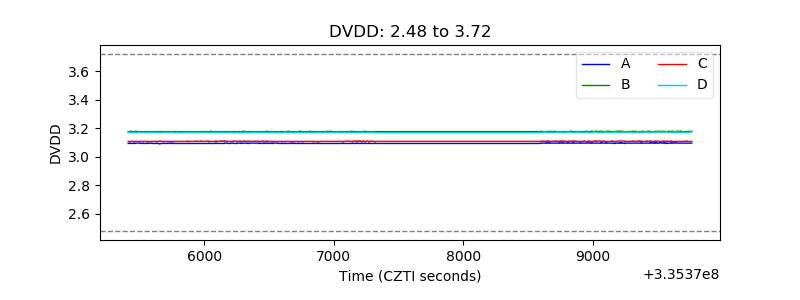 |
| Temperature 1 | 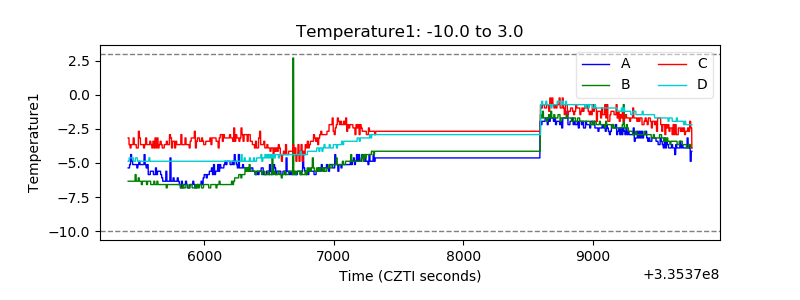 |
| Veto HV Monitor | 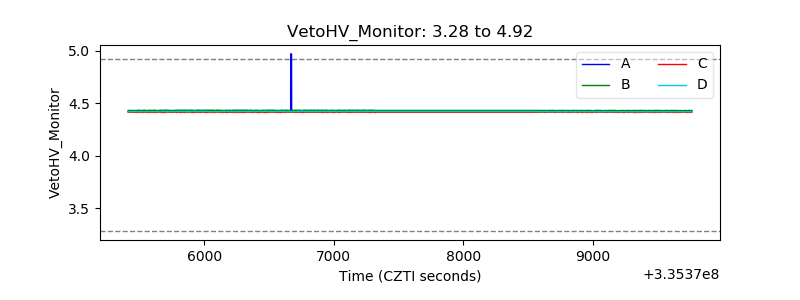 |
| Veto LLD | 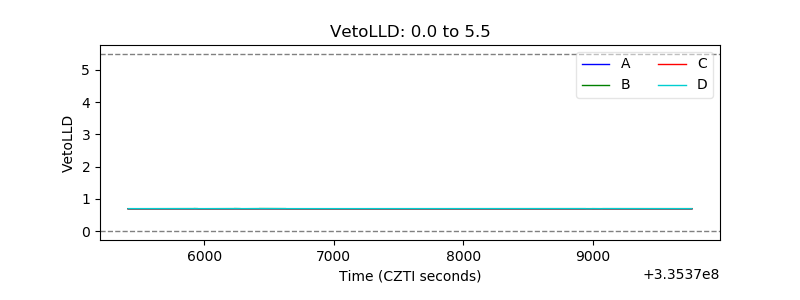 |
| Alpha Counter | 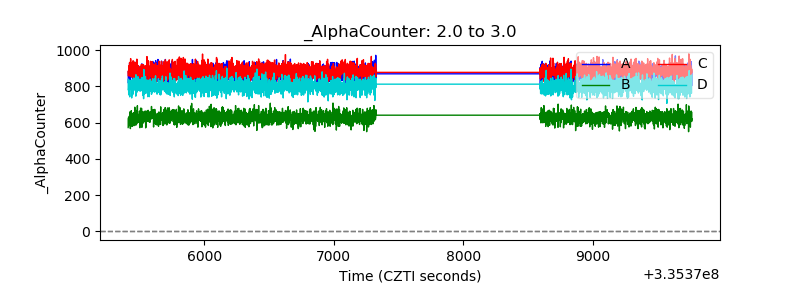 |
| _CPM_Rate | 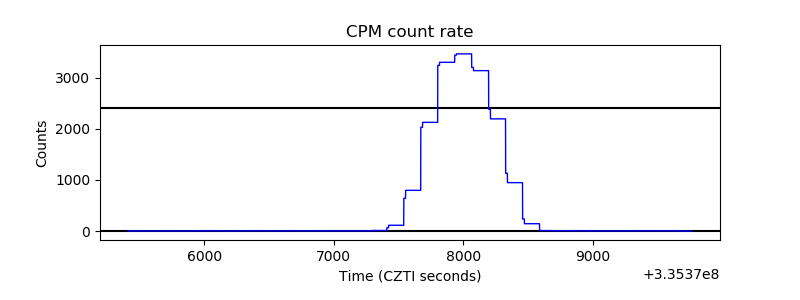 |
| CZT Counter | 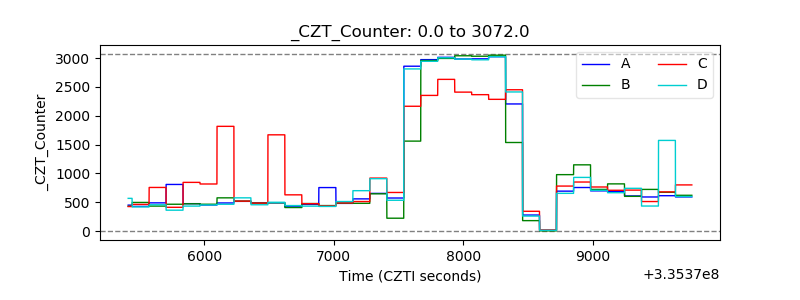 |
| +2.5 Volts monitor |  |
| +5 Volts monitor |  |
| _ROLL_ROT | 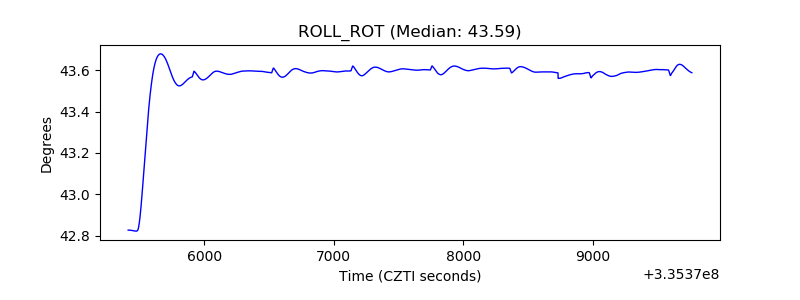 |
| _Roll_DEC | 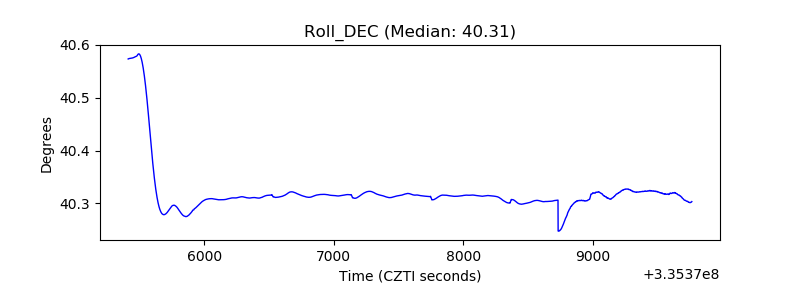 |
| _Roll_RA | 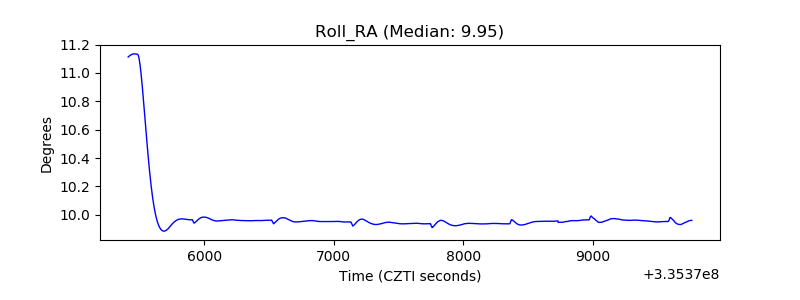 |
| Veto Counter | 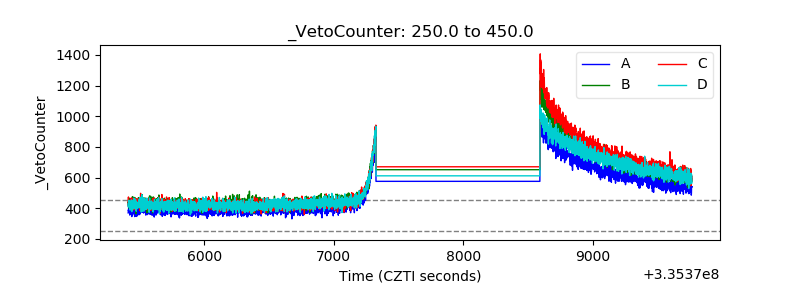 |