| Param | Original file | Final file |
|---|---|---|
| Filename | modeM0/AS1A09_108T02_9000003822_26430cztM0_level2.evt | modeM0/AS1A09_108T02_9000003822_26430cztM0_level2_quad_clean.evt |
| Size (bytes) | 525,461,760 | 109,056,960 |
| Size | 501.1 MB | 104.0 MB |
| Events in quadrant A | 3,552,297 | 717,396 |
| Events in quadrant B | 3,704,565 | 741,261 |
| Events in quadrant C | 4,076,599 | 709,951 |
| Events in quadrant D | 4,156,402 | 698,036 |
| Mode M9 | |||
|---|---|---|---|
| Quadrant | BADHDUFLAG | Total packets | Discarded packets |
| A | 0 | 27 | 0 |
| B | 0 | 27 | 0 |
| C | 0 | 27 | 0 |
| D | 0 | 27 | 0 |
| Mode M0 | |||
|---|---|---|---|
| Quadrant | BADHDUFLAG | Total packets | Discarded packets |
| A | 0 | 14720 | 0 |
| B | 0 | 15164 | 0 |
| C | 0 | 16383 | 0 |
| D | 0 | 16604 | 0 |
| Quadrant | Total seconds | Saturated seconds | Saturation percentage |
|---|---|---|---|
| A | 6256 | 100 | 1.598465% |
| B | 6257 | 141 | 2.253476% |
| C | 6257 | 263 | 4.203292% |
| D | 6257 | 191 | 3.052581% |
Noise dominated data is calculated using 1-second bins in cleaned event files. If a bin has >2000 counts, and if more than 50% of those come from <1% of pixels, then it is considered to be noise-dominated and hence unusable.
| Quadrant | # 1 sec bins | Bins with >0 counts | Bins with >2000 counts | High rate bins dominated by noise | Noise dominated (total time) | Noise dominated (detector-on time) | Marked lightcurve |
|---|---|---|---|---|---|---|---|
| A | 8896 | 6257 | 0 | 0 | 0.00% | 0.00% | 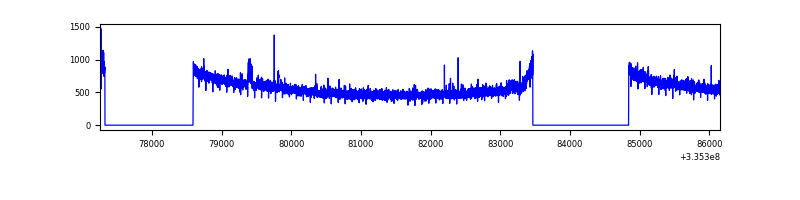 |
| B | 8897 | 6258 | 3 | 3 | 0.03% | 0.05% | 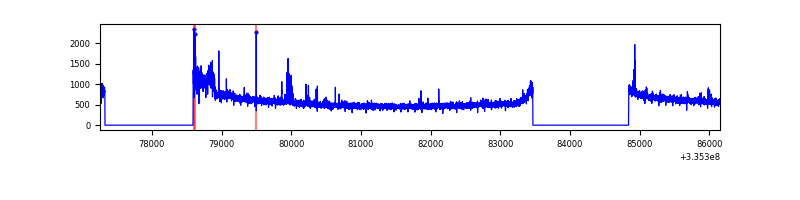 |
| C | 8897 | 6258 | 43 | 43 | 0.48% | 0.69% | 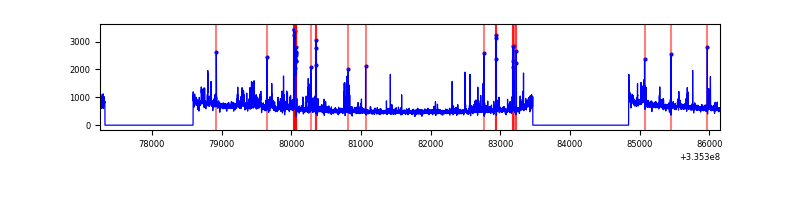 |
| D | 8897 | 6258 | 85 | 85 | 0.96% | 1.36% | 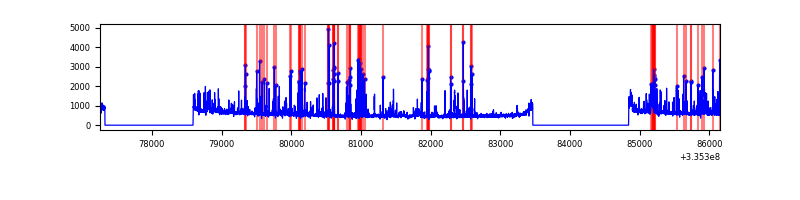 |
Top three noisy pixels from each quadrant. If the there are fewer than three noisy pixels in the level2.evt file, extra rows are filled as -1
| Pixel properties | Quadrant properties | ||||||
|---|---|---|---|---|---|---|---|
| Quadrant | DetID | PixID | Counts | Sigma | Mean | Median | Sigma |
| A | 6 | 16 | 97089 | 548.24 | 894 | 879 | 175.5 |
| A | 13 | 254 | 11221 | 58.93 | 894 | 879 | 175.5 |
| A | 0 | 226 | 7721 | 38.99 | 894 | 879 | 175.5 |
| B | 0 | 244 | 101669 | 613.43 | 898 | 879 | 164.3 |
| B | 5 | 172 | 45810 | 273.46 | 898 | 879 | 164.3 |
| B | 0 | 182 | 29203 | 172.39 | 898 | 879 | 164.3 |
| C | 2 | 16 | 259594 | 1274.99 | 880 | 890 | 202.9 |
| C | 3 | 233 | 223024 | 1094.76 | 880 | 890 | 202.9 |
| C | 14 | 238 | 140196 | 686.55 | 880 | 890 | 202.9 |
| D | 1 | 52 | 327404 | 1565.49 | 887 | 870 | 208.6 |
| D | 12 | 16 | 215297 | 1028.02 | 887 | 870 | 208.6 |
| D | 11 | 176 | 136752 | 651.45 | 887 | 870 | 208.6 |
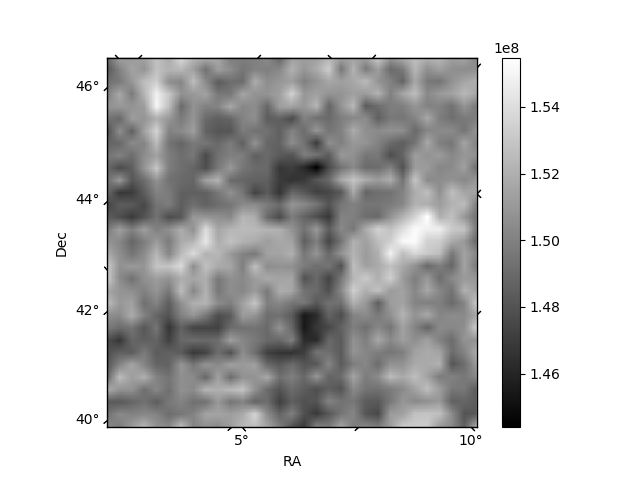
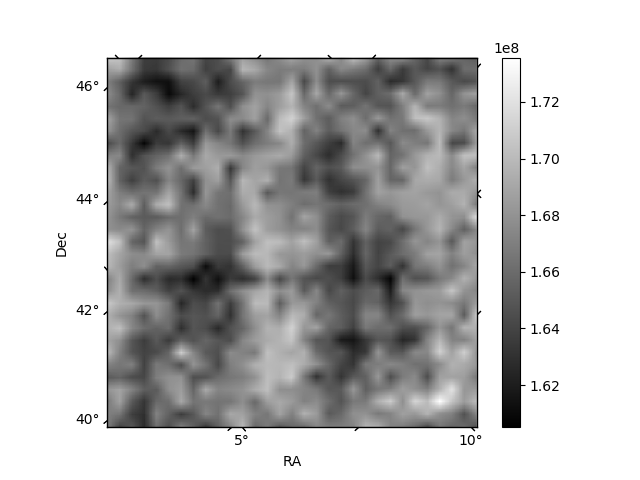
Histogram calculated using DETX and DETY for each event in the final _common_clean file
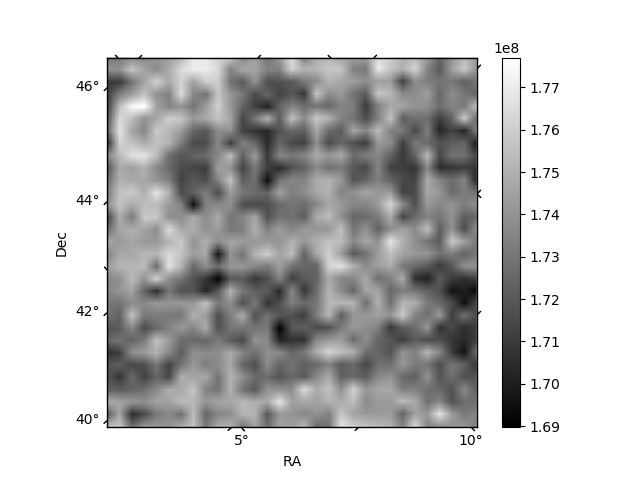
| Quadrant A | 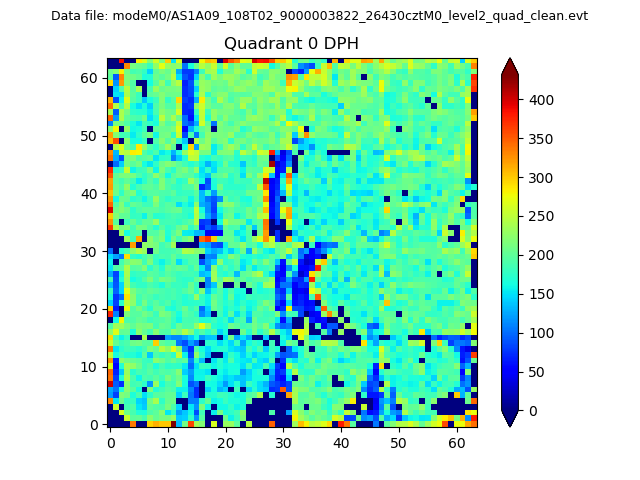 |
 |
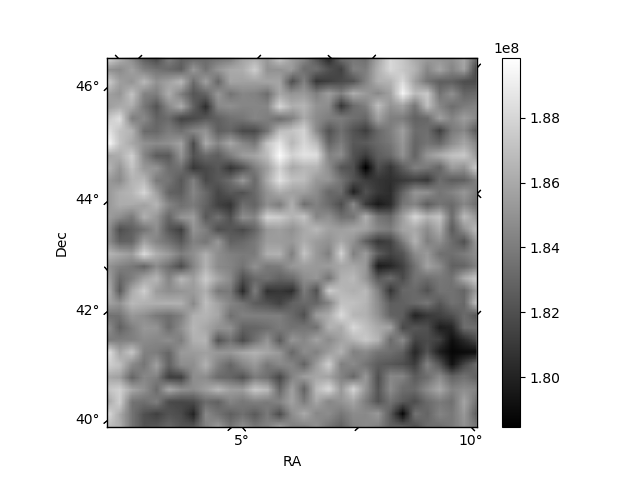
Quadrant B |
|---|---|---|---|
| Quadrant D | 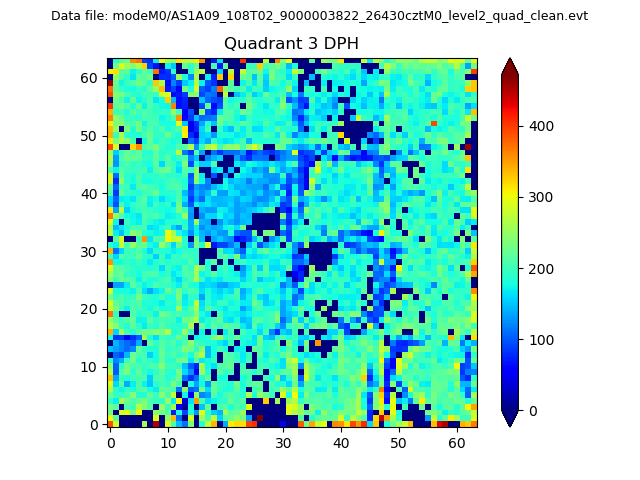 |
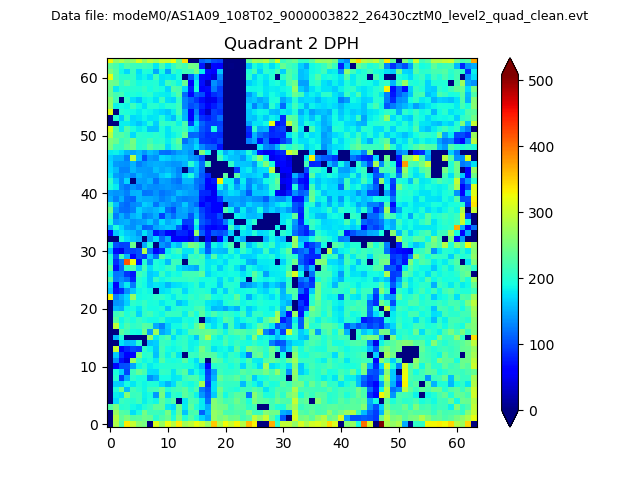 |
Quadrant C |
| Plot type | Count rate plots | Images |
|---|---|---|
| Comparison with Poisson distribution Blue bars denote a histogram of data divided into 1 sec bins. Red curve is a Poisson curve with rate = median count rate of data. |
 |
 |
| Quadrant-wise count rates Data is divided into 100 sec bins |
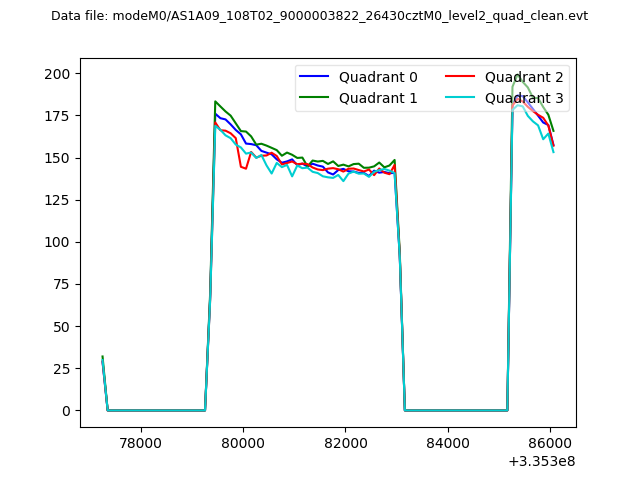 |
|
| Module-wise count rates for Quadrant A Data is divided into 100 sec bins |
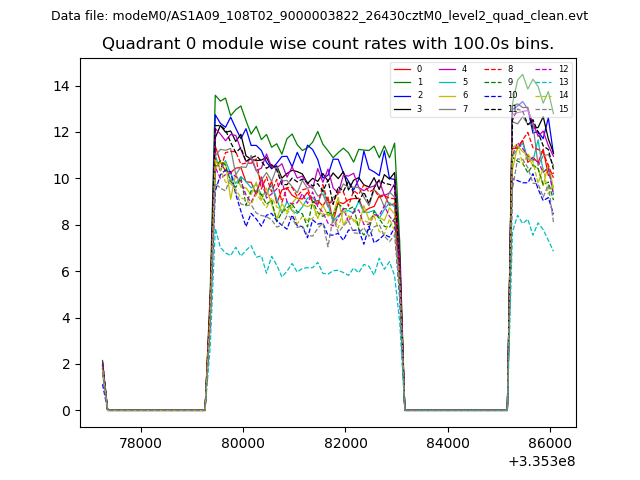 |
 |
| Module-wise count rates for Quadrant B Data is divided into 100 sec bins |
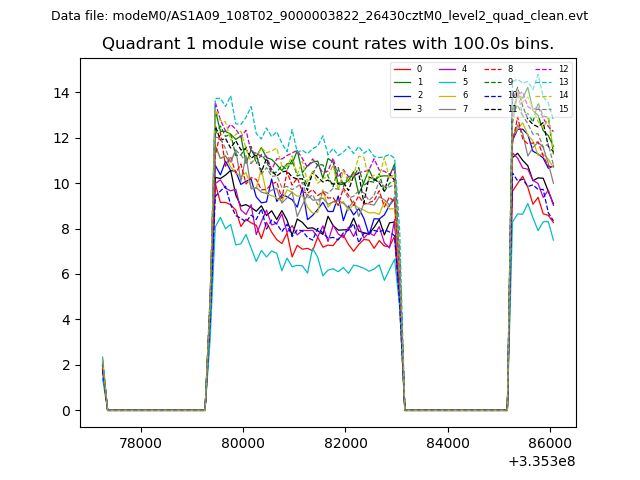 |
 |
| Module-wise count rates for Quadrant C Data is divided into 100 sec bins |
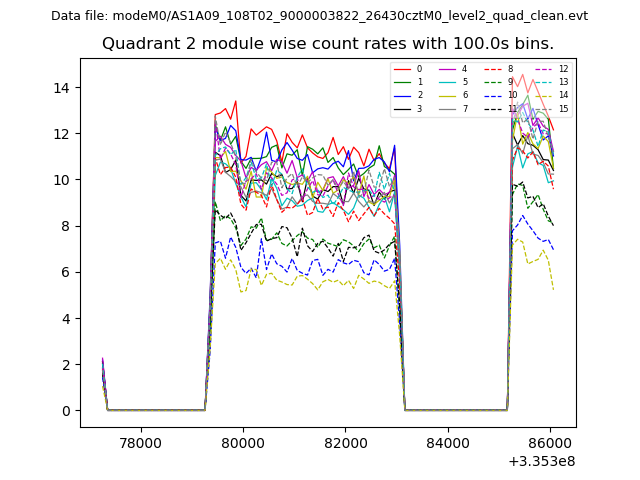 |
 |
| Module-wise count rates for Quadrant D Data is divided into 100 sec bins |
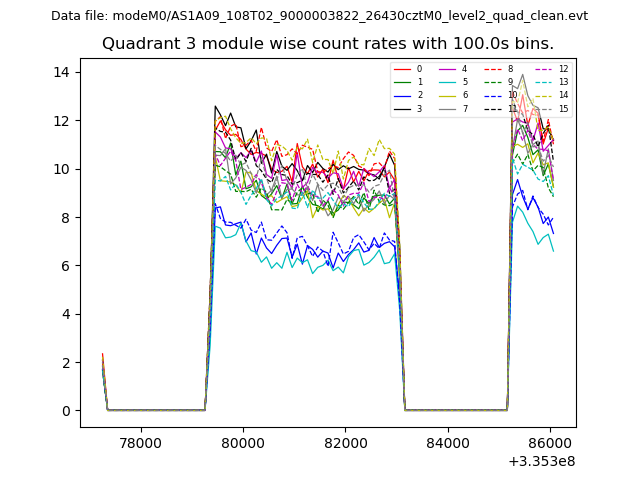 |
 |
| Parameter | Plot |
|---|---|
| CZT HV Monitor | 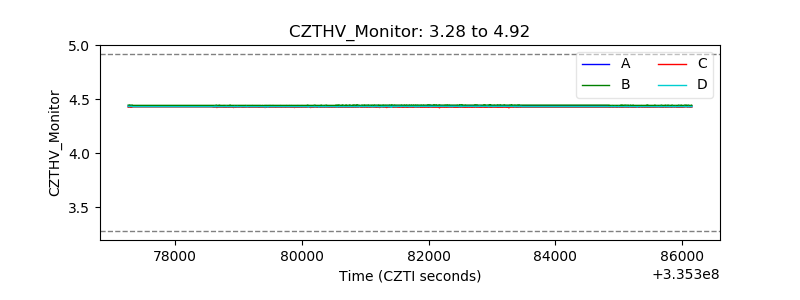 |
| D_VDD | 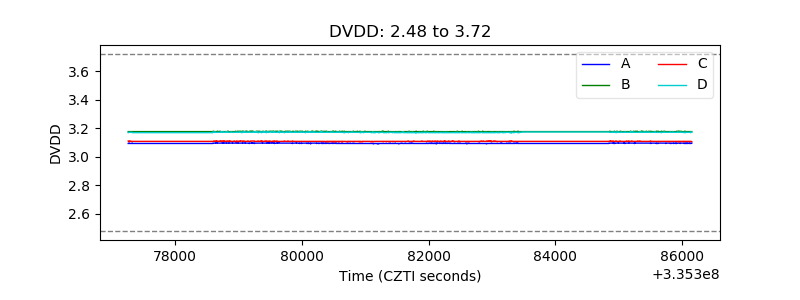 |
| Temperature 1 | 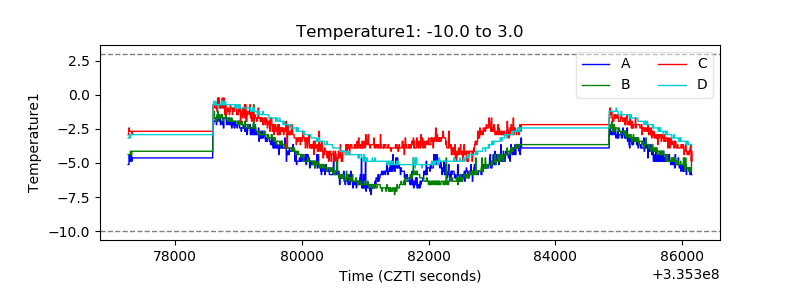 |
| Veto HV Monitor | 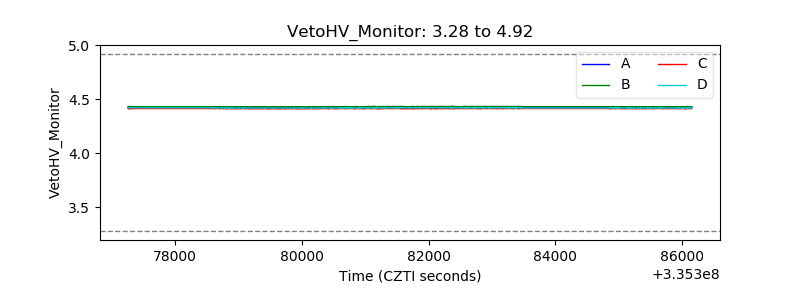 |
| Veto LLD |  |
| Alpha Counter | 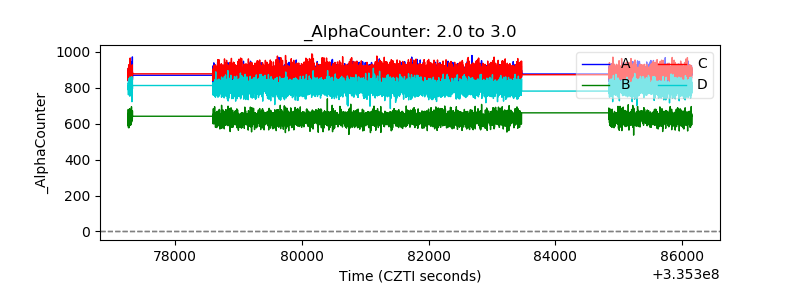 |
| _CPM_Rate |  |
| CZT Counter | 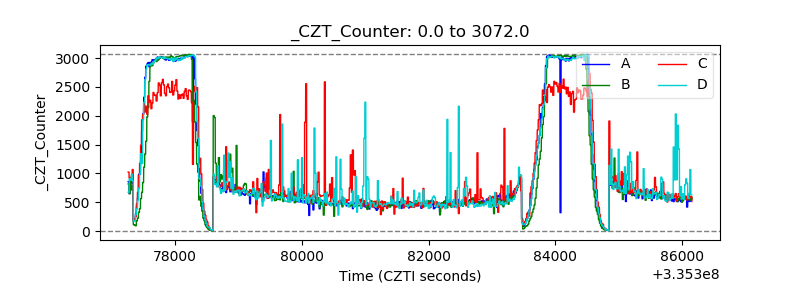 |
| +2.5 Volts monitor |  |
| +5 Volts monitor |  |
| _ROLL_ROT | 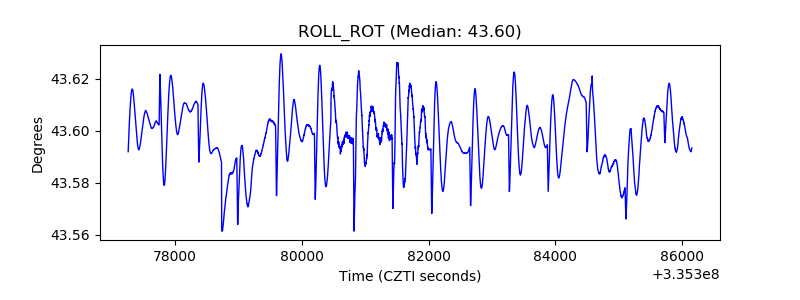 |
| _Roll_DEC |  |
| _Roll_RA | 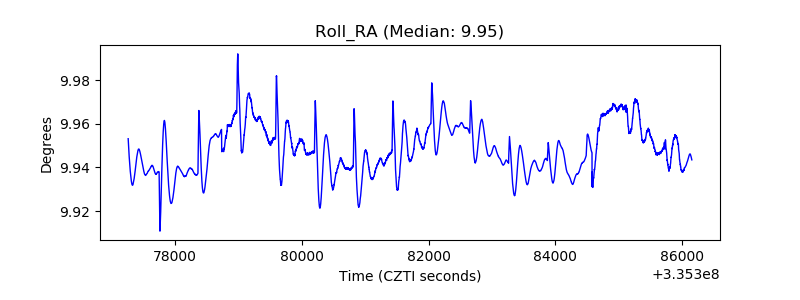 |
| Veto Counter | 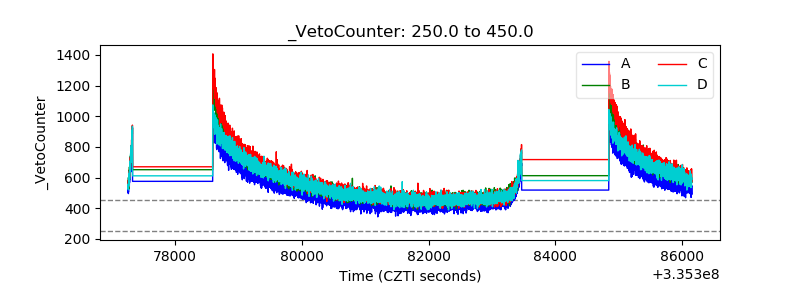 |