| Param | Original file | Final file |
|---|---|---|
| Filename | modeM0/AS1A09_108T02_9000003822_26431cztM0_level2.evt | modeM0/AS1A09_108T02_9000003822_26431cztM0_level2_quad_clean.evt |
| Size (bytes) | 515,715,840 | 117,023,040 |
| Size | 491.8 MB | 111.6 MB |
| Events in quadrant A | 3,265,241 | 783,380 |
| Events in quadrant B | 3,391,271 | 816,507 |
| Events in quadrant C | 3,873,961 | 785,616 |
| Events in quadrant D | 4,679,124 | 737,491 |
| Mode M9 | |||
|---|---|---|---|
| Quadrant | BADHDUFLAG | Total packets | Discarded packets |
| A | 0 | 20 | 0 |
| B | 0 | 21 | 0 |
| C | 0 | 21 | 0 |
| D | 0 | 21 | 0 |
| Mode M0 | |||
|---|---|---|---|
| Quadrant | BADHDUFLAG | Total packets | Discarded packets |
| A | 0 | 13577 | 0 |
| B | 0 | 13960 | 0 |
| C | 0 | 15555 | 0 |
| D | 0 | 18056 | 0 |
| Quadrant | Total seconds | Saturated seconds | Saturation percentage |
|---|---|---|---|
| A | 6028 | 40 | 0.663570% |
| B | 6028 | 49 | 0.812873% |
| C | 6028 | 169 | 2.803583% |
| D | 6028 | 434 | 7.199735% |
Noise dominated data is calculated using 1-second bins in cleaned event files. If a bin has >2000 counts, and if more than 50% of those come from <1% of pixels, then it is considered to be noise-dominated and hence unusable.
| Quadrant | # 1 sec bins | Bins with >0 counts | Bins with >2000 counts | High rate bins dominated by noise | Noise dominated (total time) | Noise dominated (detector-on time) | Marked lightcurve |
|---|---|---|---|---|---|---|---|
| A | 7453 | 6029 | 0 | 0 | 0.00% | 0.00% | 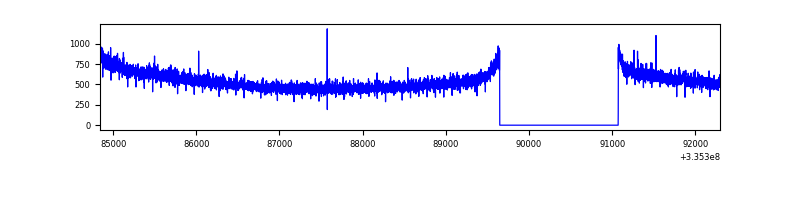 |
| B | 7453 | 6029 | 0 | 0 | 0.00% | 0.00% | 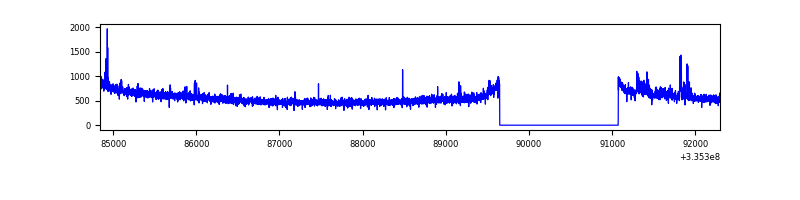 |
| C | 7453 | 6029 | 21 | 21 | 0.28% | 0.35% | 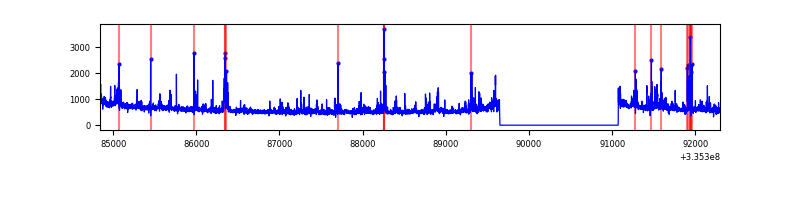 |
| D | 7453 | 6029 | 328 | 328 | 4.40% | 5.44% | 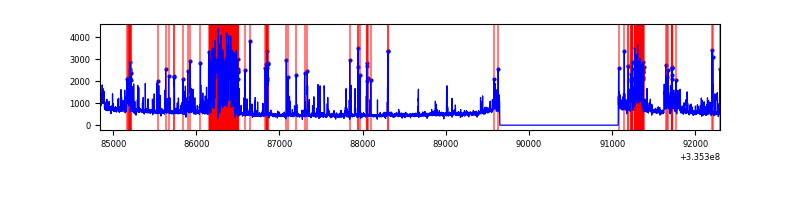 |
Top three noisy pixels from each quadrant. If the there are fewer than three noisy pixels in the level2.evt file, extra rows are filled as -1
| Pixel properties | Quadrant properties | ||||||
|---|---|---|---|---|---|---|---|
| Quadrant | DetID | PixID | Counts | Sigma | Mean | Median | Sigma |
| A | 6 | 16 | 16646 | 96.24 | 841 | 827 | 164.4 |
| A | 13 | 254 | 10440 | 58.48 | 841 | 827 | 164.4 |
| A | 0 | 226 | 7219 | 38.89 | 841 | 827 | 164.4 |
| B | 0 | 244 | 54173 | 340.35 | 850 | 833 | 156.7 |
| B | 12 | 111 | 17606 | 107.02 | 850 | 833 | 156.7 |
| B | 11 | 111 | 15663 | 94.63 | 850 | 833 | 156.7 |
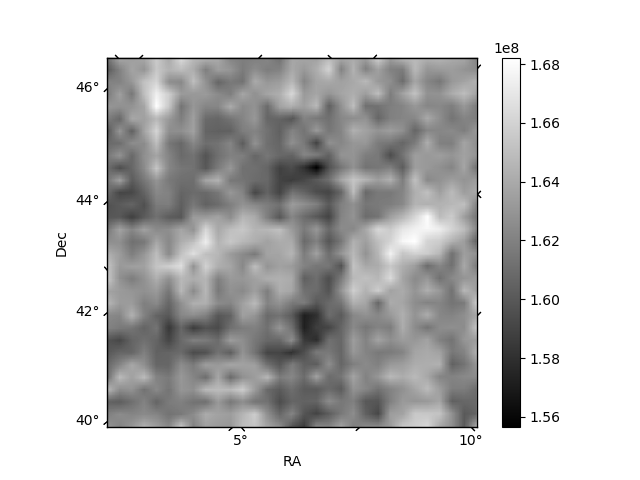
| C | 3 | 233 | 160006 | 829.42 | 833 | 842 | 191.9 |
| C | 4 | 254 | 158225 | 820.14 | 833 | 842 | 191.9 |
| C | 14 | 238 | 132503 | 686.1 | 833 | 842 | 191.9 |
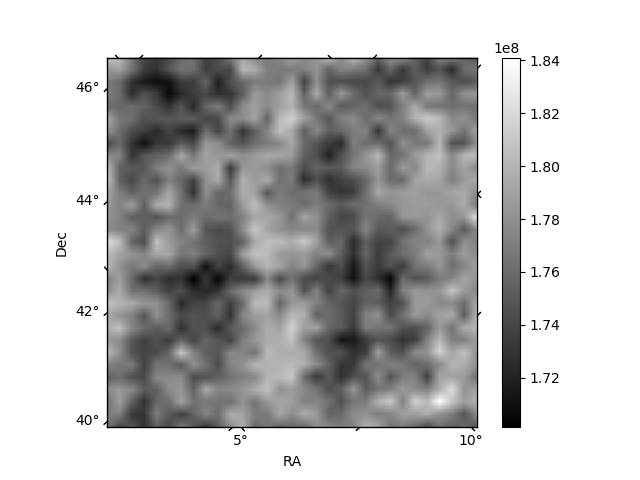
| D | 12 | 16 | 642059 | 3330.71 | 814 | 798 | 192.5 |
| D | 1 | 52 | 600920 | 3117.03 | 814 | 798 | 192.5 |
| D | 11 | 176 | 156699 | 809.75 | 814 | 798 | 192.5 |
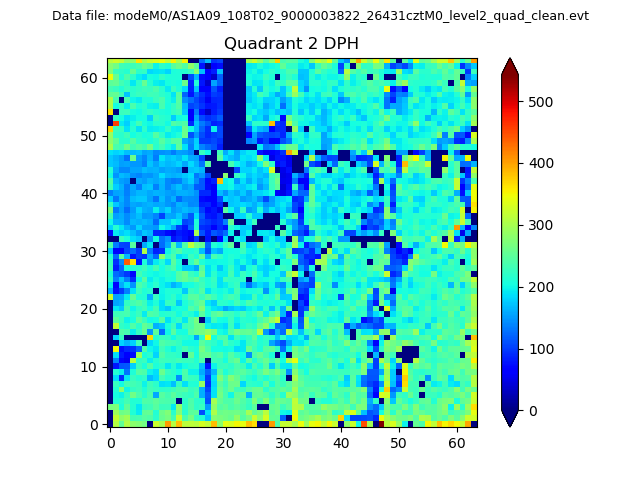
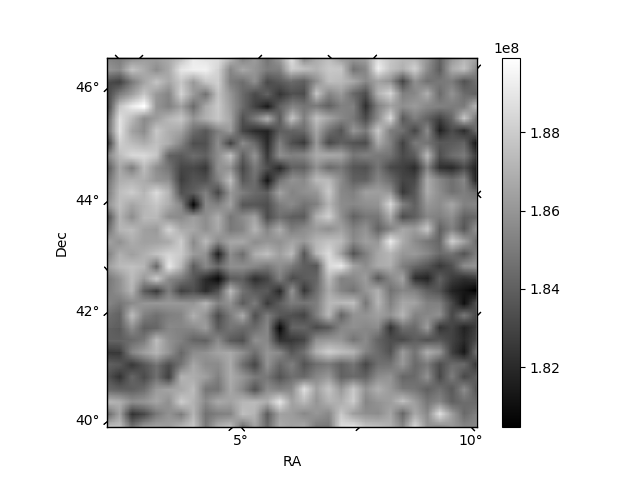
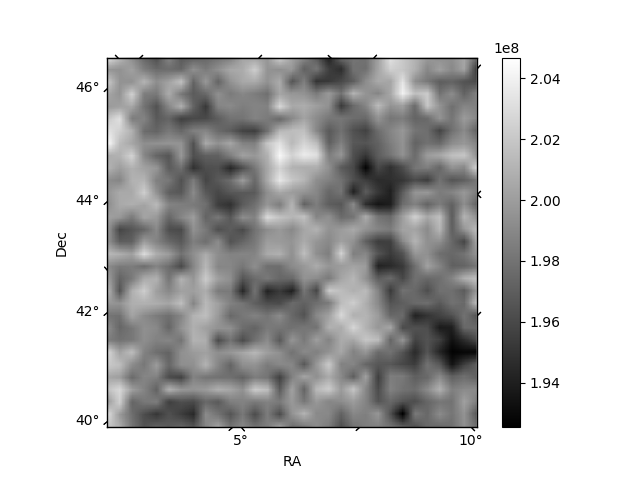
Histogram calculated using DETX and DETY for each event in the final _common_clean file
| Quadrant A |  |
 |
Quadrant B |
|---|---|---|---|
| Quadrant D |  |
 |
Quadrant C |
| Plot type | Count rate plots | Images |
|---|---|---|
| Comparison with Poisson distribution Blue bars denote a histogram of data divided into 1 sec bins. Red curve is a Poisson curve with rate = median count rate of data. |
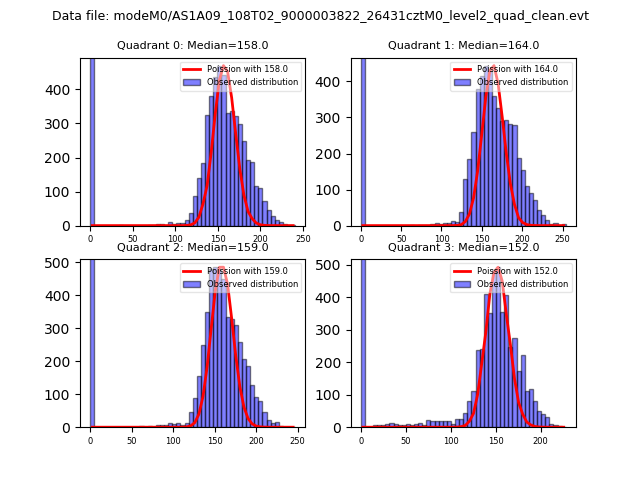 |
 |
| Quadrant-wise count rates Data is divided into 100 sec bins |
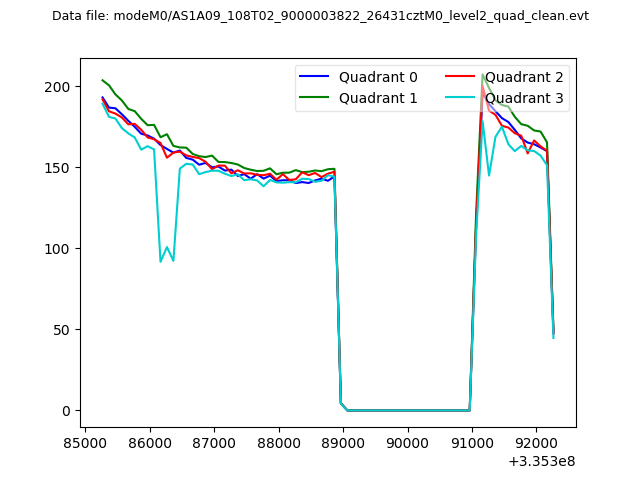 |
|
| Module-wise count rates for Quadrant A Data is divided into 100 sec bins |
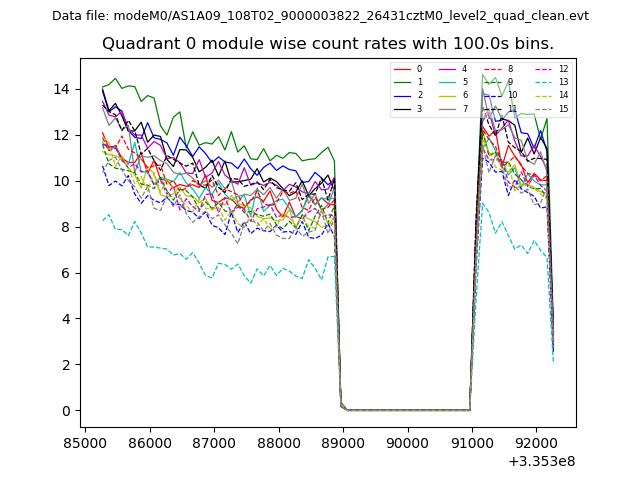 |
 |
| Module-wise count rates for Quadrant B Data is divided into 100 sec bins |
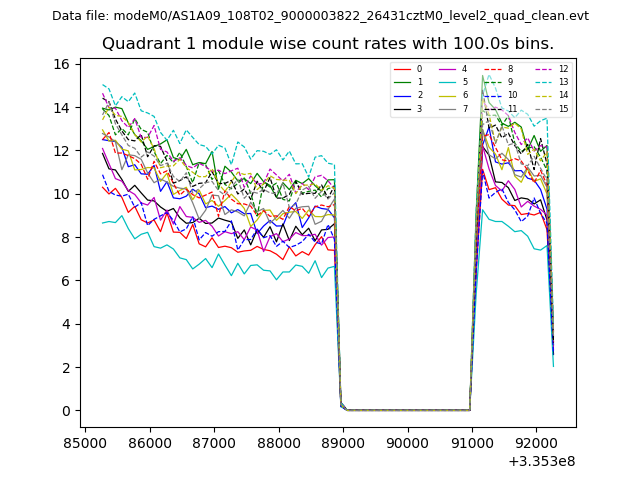 |
 |
| Module-wise count rates for Quadrant C Data is divided into 100 sec bins |
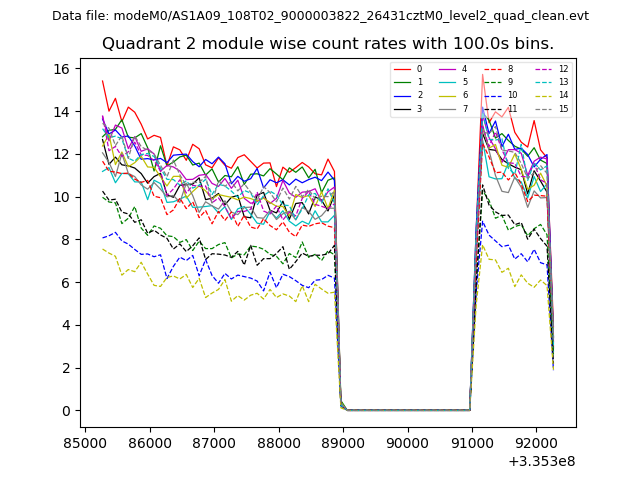 |
 |
| Module-wise count rates for Quadrant D Data is divided into 100 sec bins |
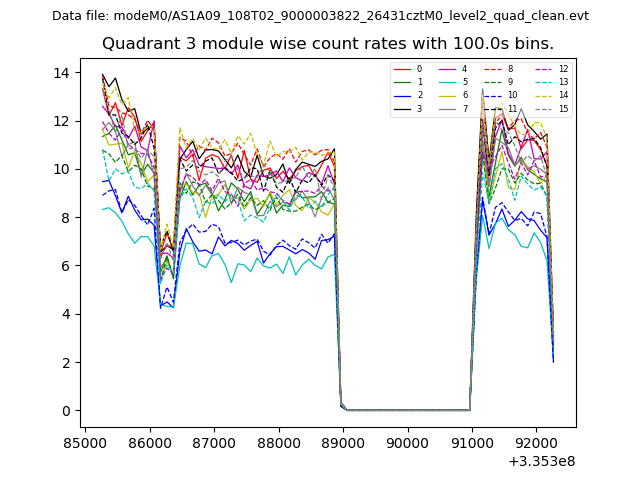 |
 |
| Parameter | Plot |
|---|---|
| CZT HV Monitor | 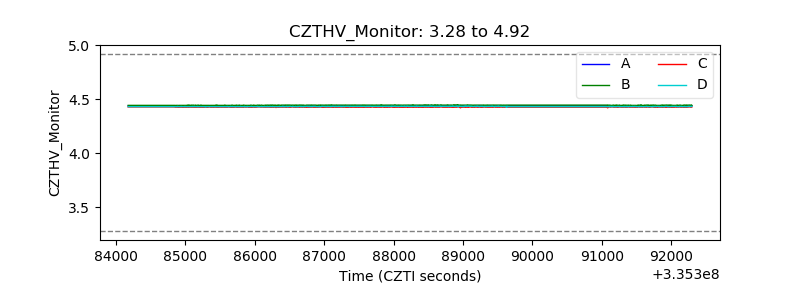 |
| D_VDD | 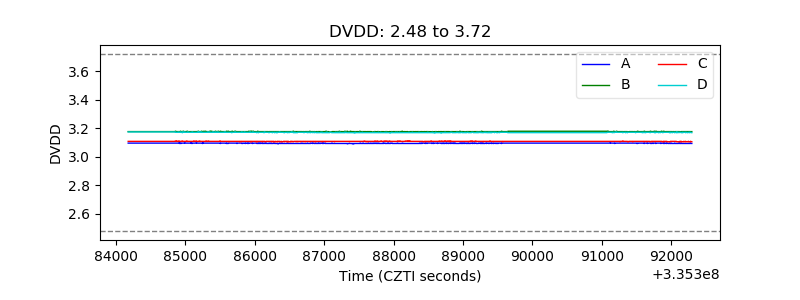 |
| Temperature 1 | 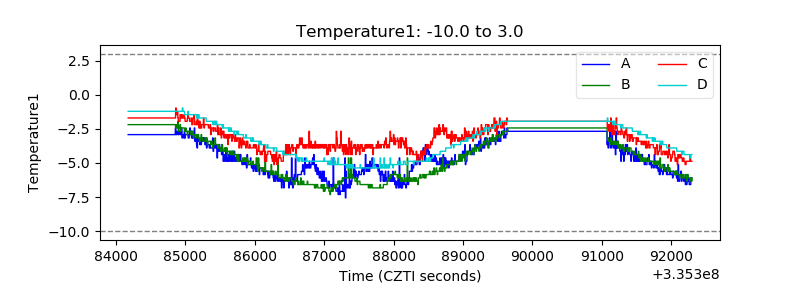 |
| Veto HV Monitor | 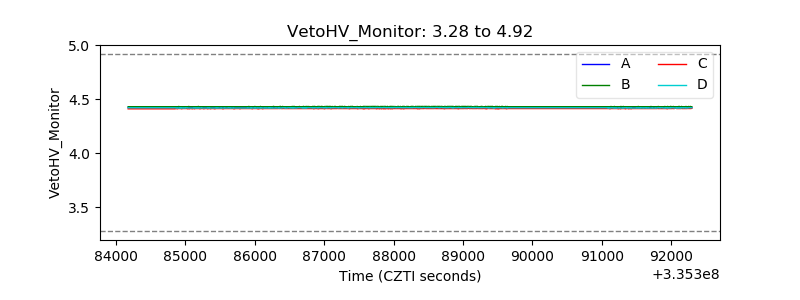 |
| Veto LLD | 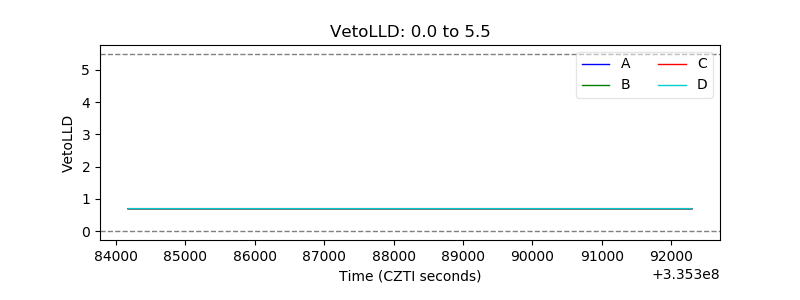 |
| Alpha Counter | 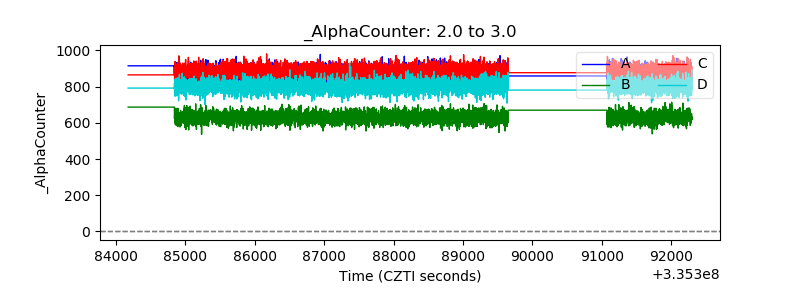 |
| _CPM_Rate | 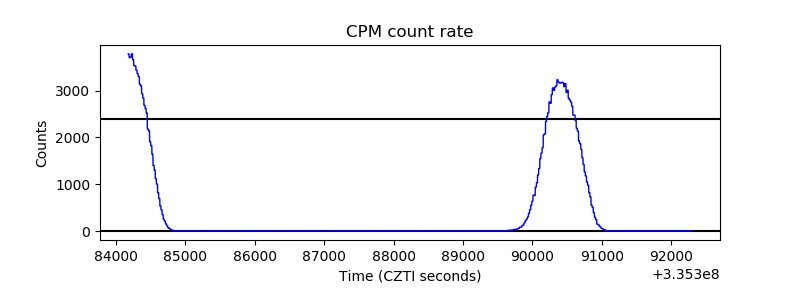 |
| CZT Counter | 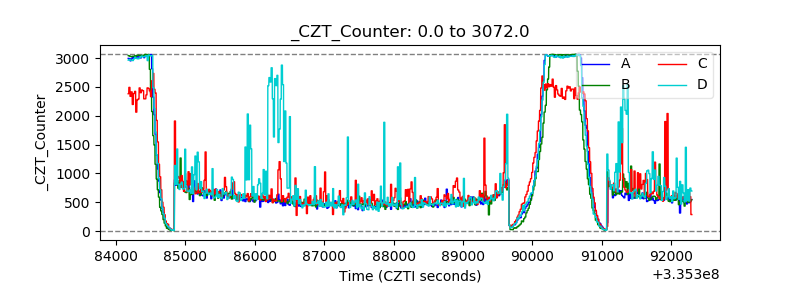 |
| +2.5 Volts monitor | 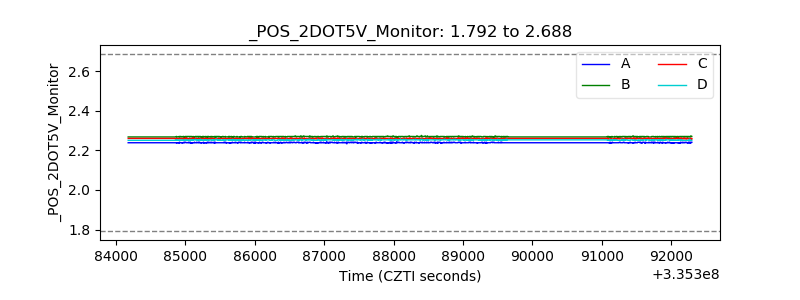 |
| +5 Volts monitor |  |
| _ROLL_ROT | 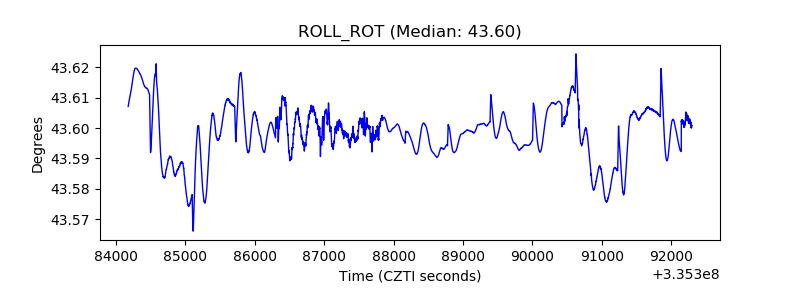 |
| _Roll_DEC | 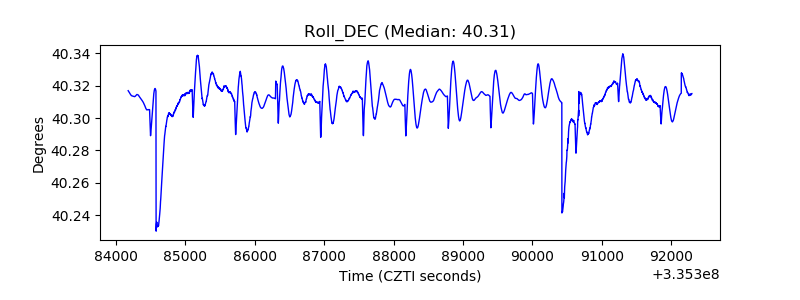 |
| _Roll_RA |  |
| Veto Counter | 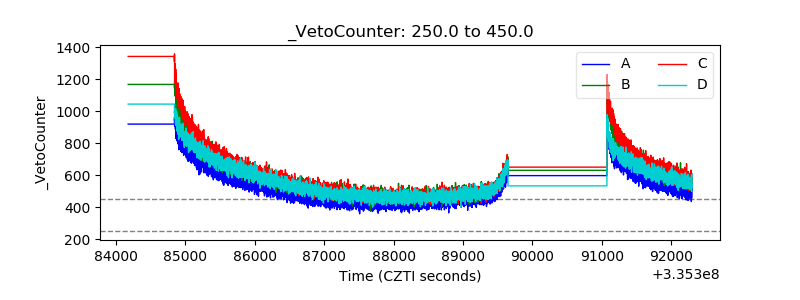 |