| Param | Original file | Final file |
|---|---|---|
| Filename | modeM0/AS1A09_108T02_9000003822_26433cztM0_level2.evt | modeM0/AS1A09_108T02_9000003822_26433cztM0_level2_quad_clean.evt |
| Size (bytes) | 522,276,480 | 104,359,680 |
| Size | 498.1 MB | 99.5 MB |
| Events in quadrant A | 3,492,268 | 665,676 |
| Events in quadrant B | 3,577,094 | 691,148 |
| Events in quadrant C | 3,734,445 | 666,383 |
| Events in quadrant D | 4,536,041 | 647,681 |
| Mode M9 | |||
|---|---|---|---|
| Quadrant | BADHDUFLAG | Total packets | Discarded packets |
| A | 0 | 25 | 0 |
| B | 0 | 25 | 0 |
| C | 0 | 25 | 0 |
| D | 0 | 25 | 0 |
| Mode M0 | |||
|---|---|---|---|
| Quadrant | BADHDUFLAG | Total packets | Discarded packets |
| A | 0 | 14938 | 0 |
| B | 0 | 15065 | 0 |
| C | 0 | 15538 | 0 |
| D | 0 | 18173 | 0 |
| Quadrant | Total seconds | Saturated seconds | Saturation percentage |
|---|---|---|---|
| A | 7033 | 52 | 0.739372% |
| B | 7034 | 116 | 1.649133% |
| C | 7034 | 155 | 2.203583% |
| D | 7033 | 395 | 5.616380% |
Noise dominated data is calculated using 1-second bins in cleaned event files. If a bin has >2000 counts, and if more than 50% of those come from <1% of pixels, then it is considered to be noise-dominated and hence unusable.
| Quadrant | # 1 sec bins | Bins with >0 counts | Bins with >2000 counts | High rate bins dominated by noise | Noise dominated (total time) | Noise dominated (detector-on time) | Marked lightcurve |
|---|---|---|---|---|---|---|---|
| A | 9488 | 7035 | 0 | 0 | 0.00% | 0.00% |  |
| B | 9489 | 7036 | 2 | 2 | 0.02% | 0.03% |  |
| C | 9489 | 7036 | 2 | 2 | 0.02% | 0.03% |  |
| D | 9488 | 7034 | 247 | 247 | 2.60% | 3.51% | 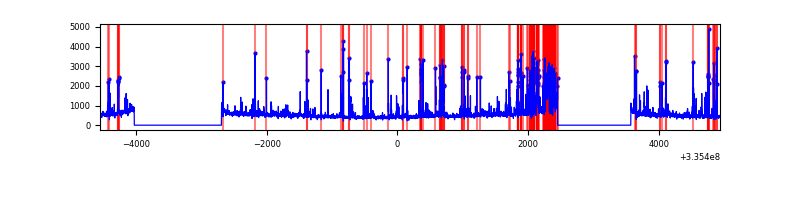 |
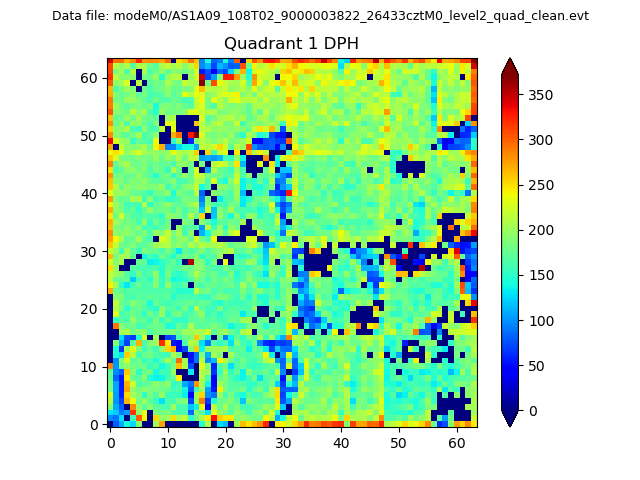
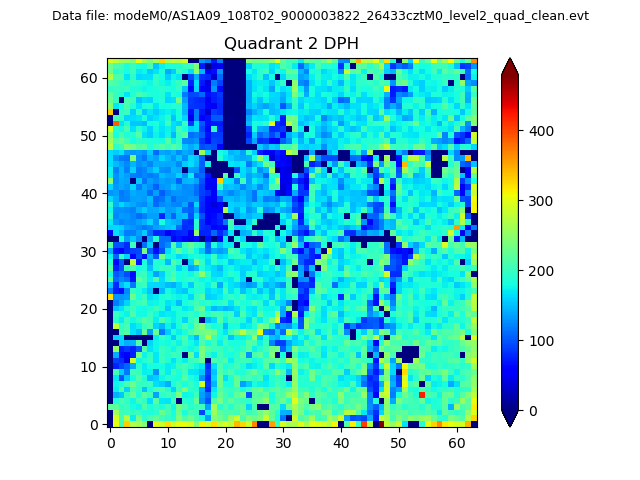
Top three noisy pixels from each quadrant. If the there are fewer than three noisy pixels in the level2.evt file, extra rows are filled as -1
| Pixel properties | Quadrant properties | ||||||
|---|---|---|---|---|---|---|---|
| Quadrant | DetID | PixID | Counts | Sigma | Mean | Median | Sigma |
| A | 13 | 254 | 10630 | 53.76 | 902 | 884 | 181.3 |
| A | 12 | 189 | 8985 | 44.69 | 902 | 884 | 181.3 |
| A | 3 | 137 | 8176 | 40.23 | 902 | 884 | 181.3 |
| B | 0 | 244 | 20567 | 115.35 | 909 | 884 | 170.6 |
| B | 12 | 111 | 20439 | 114.6 | 909 | 884 | 170.6 |
| B | 11 | 111 | 18410 | 102.71 | 909 | 884 | 170.6 |
| C | 14 | 238 | 139324 | 670.01 | 883 | 888 | 206.6 |
| C | 14 | 176 | 105427 | 505.95 | 883 | 888 | 206.6 |
| C | 3 | 233 | 38796 | 183.47 | 883 | 888 | 206.6 |
| D | 11 | 176 | 565709 | 2772.58 | 861 | 841 | 203.7 |
| D | 12 | 233 | 482712 | 2365.2 | 861 | 841 | 203.7 |
| D | 1 | 52 | 156630 | 764.67 | 861 | 841 | 203.7 |
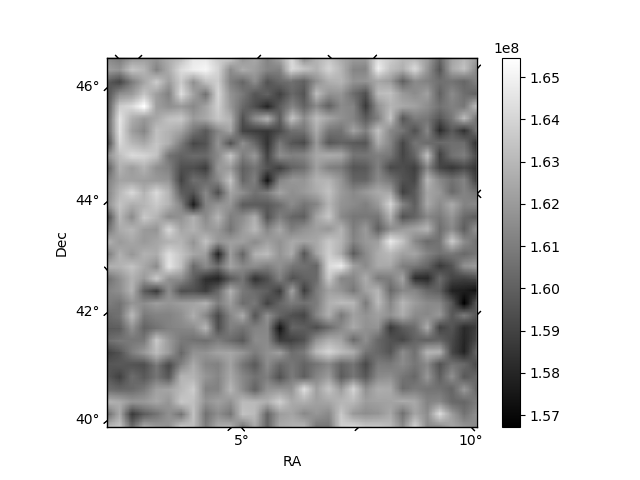
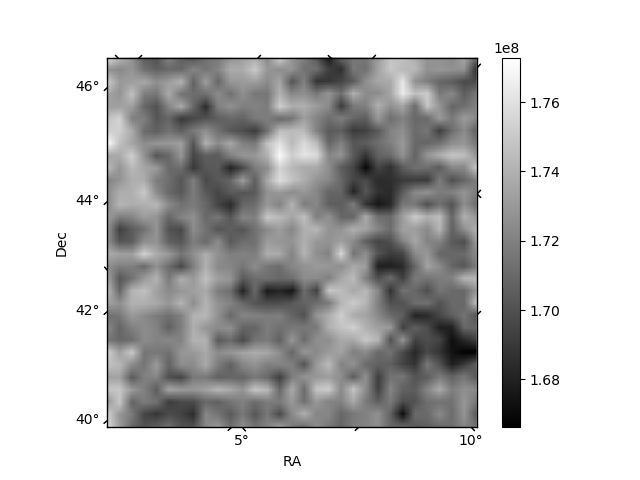
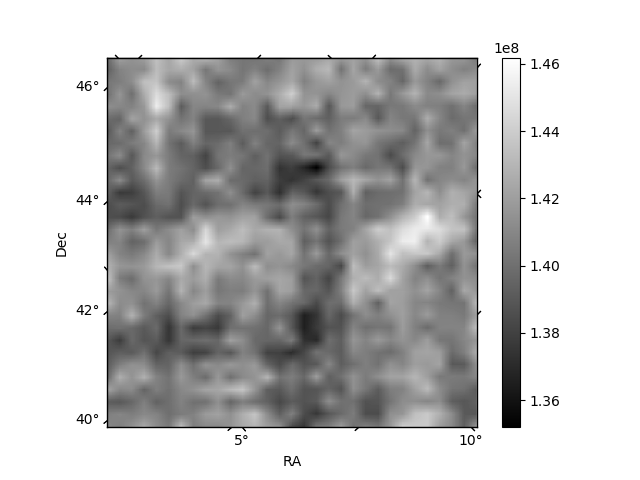
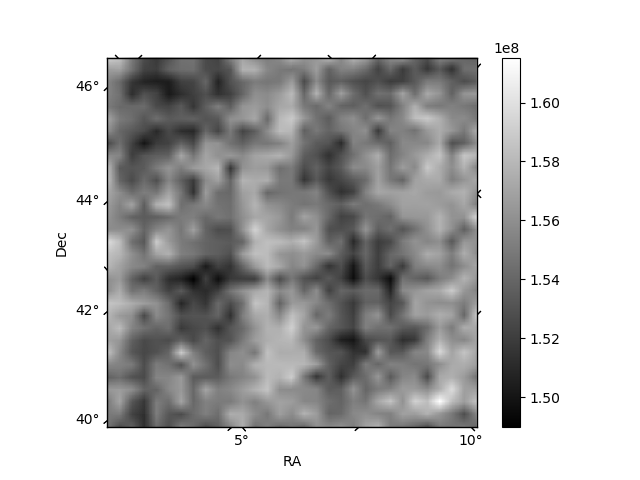
Histogram calculated using DETX and DETY for each event in the final _common_clean file
| Quadrant A | 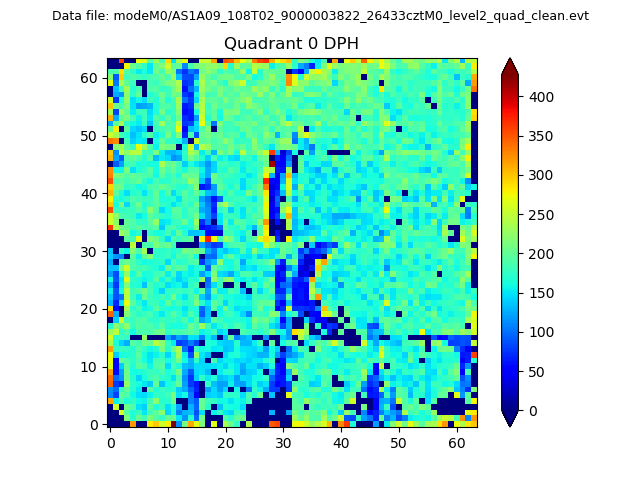 |
 |
Quadrant B |
|---|---|---|---|
| Quadrant D | 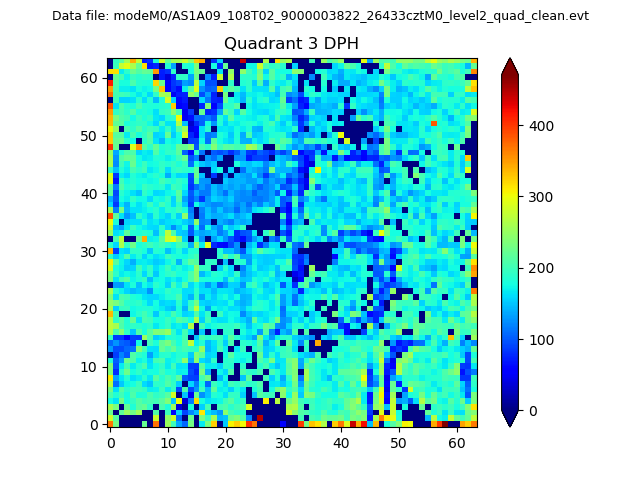 |
 |
Quadrant C |
| Plot type | Count rate plots | Images |
|---|---|---|
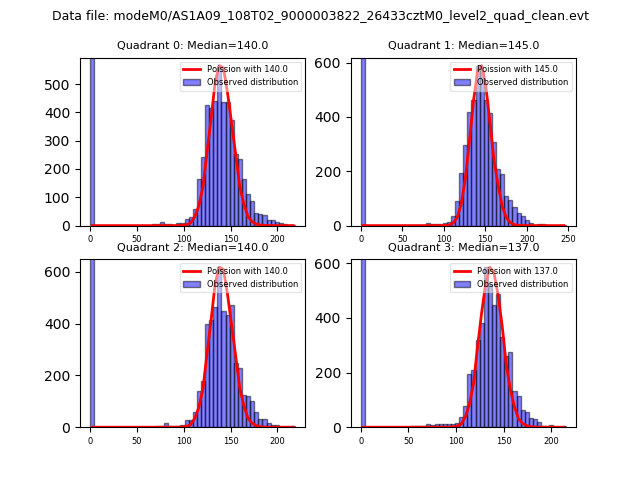
| Comparison with Poisson distribution Blue bars denote a histogram of data divided into 1 sec bins. Red curve is a Poisson curve with rate = median count rate of data. |
 |
 |
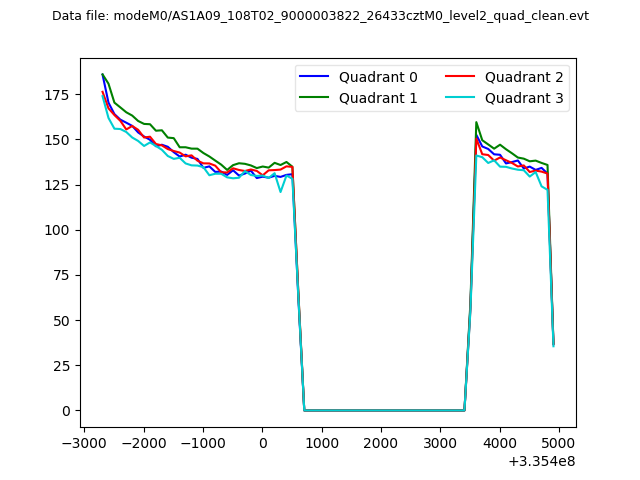
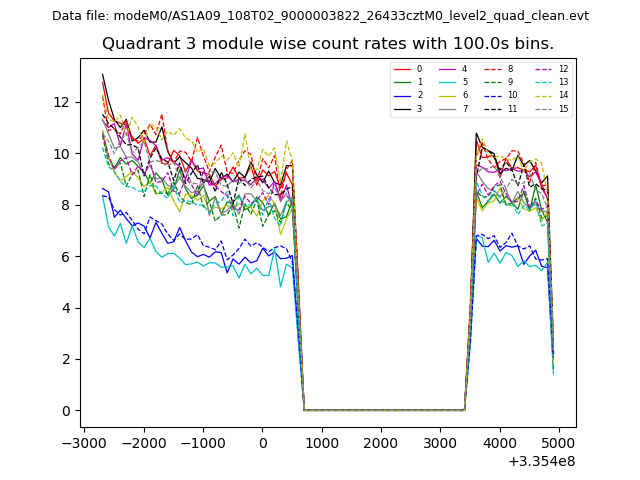
| Quadrant-wise count rates Data is divided into 100 sec bins |
 |
|
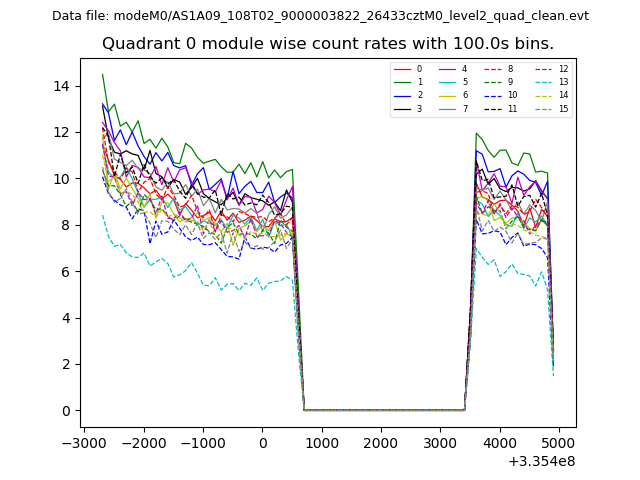
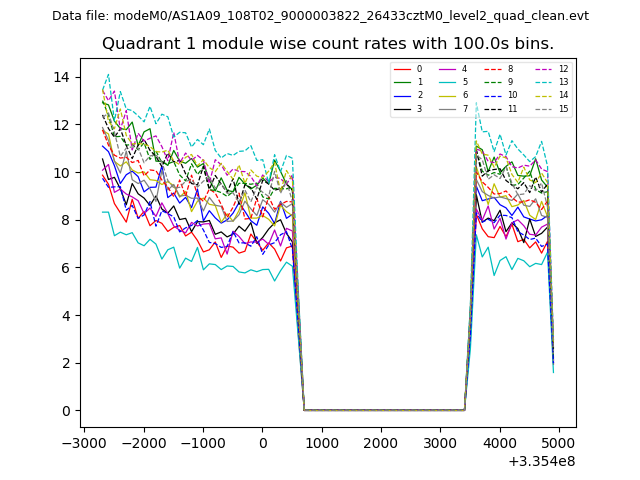
| Module-wise count rates for Quadrant A Data is divided into 100 sec bins |
 |
 |
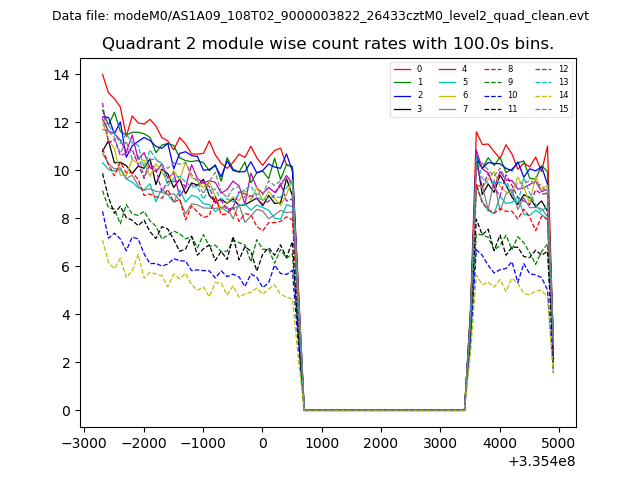
| Module-wise count rates for Quadrant B Data is divided into 100 sec bins |
 |
 |
| Module-wise count rates for Quadrant C Data is divided into 100 sec bins |
 |
 |
| Module-wise count rates for Quadrant D Data is divided into 100 sec bins |
 |
 |
| Parameter | Plot |
|---|---|
| CZT HV Monitor | 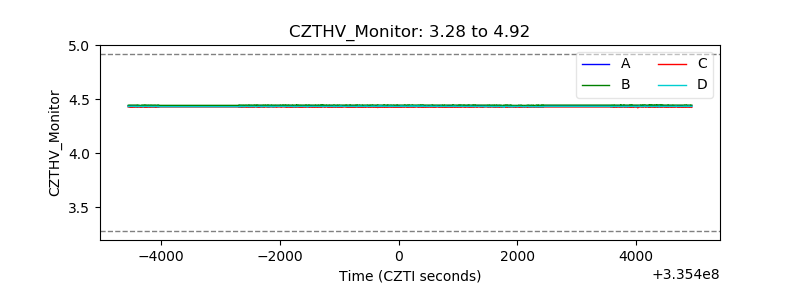 |
| D_VDD | 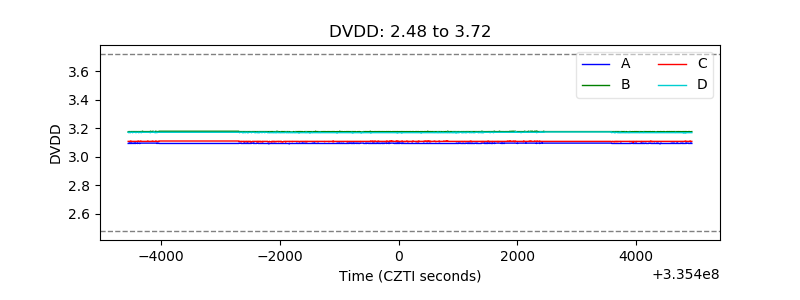 |
| Temperature 1 | 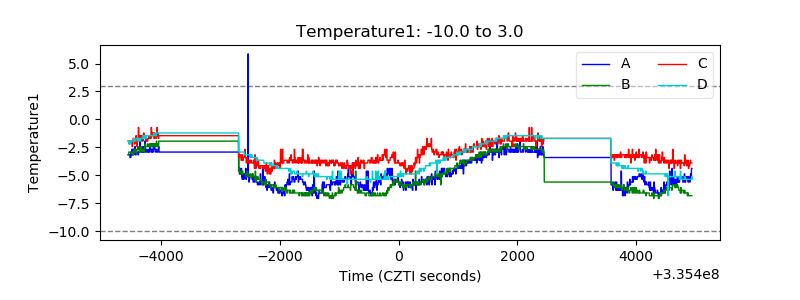 |
| Veto HV Monitor | 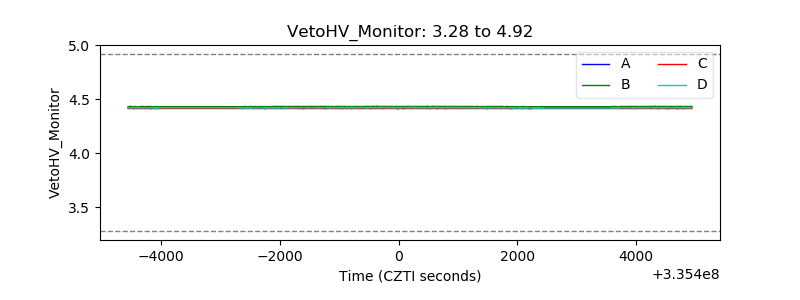 |
| Veto LLD | 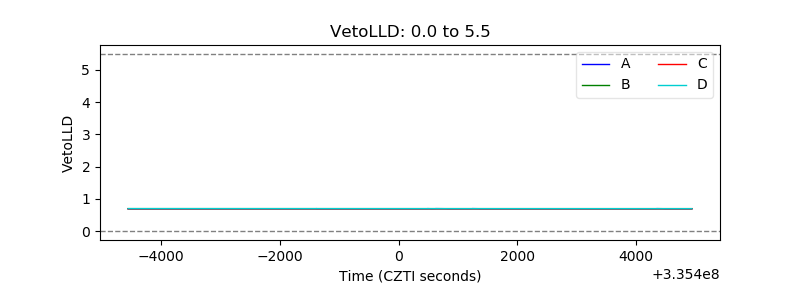 |
| Alpha Counter | 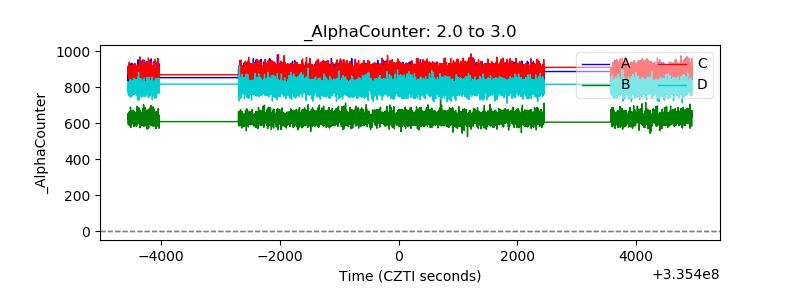 |
| _CPM_Rate | 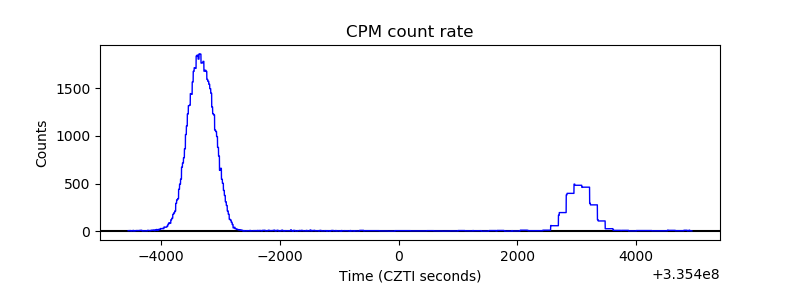 |
| CZT Counter | 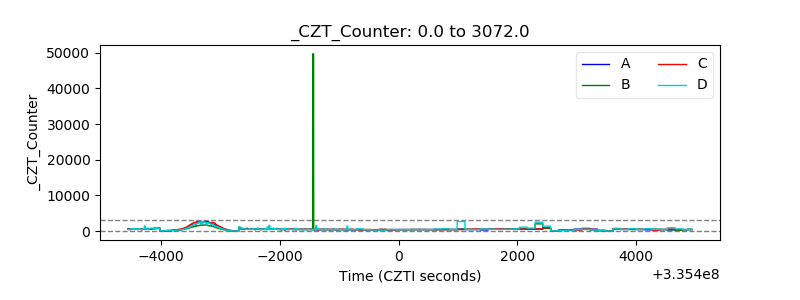 |
| +2.5 Volts monitor |  |
| +5 Volts monitor |  |
| _ROLL_ROT | 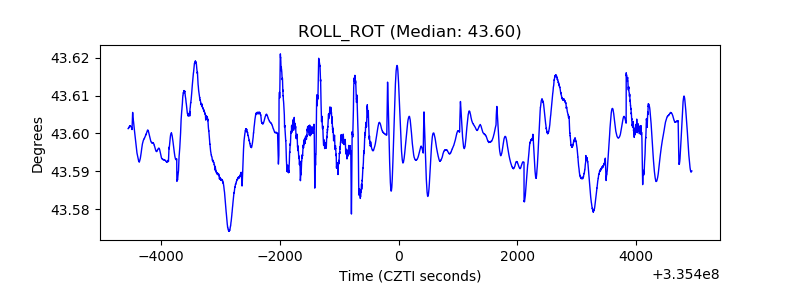 |
| _Roll_DEC | 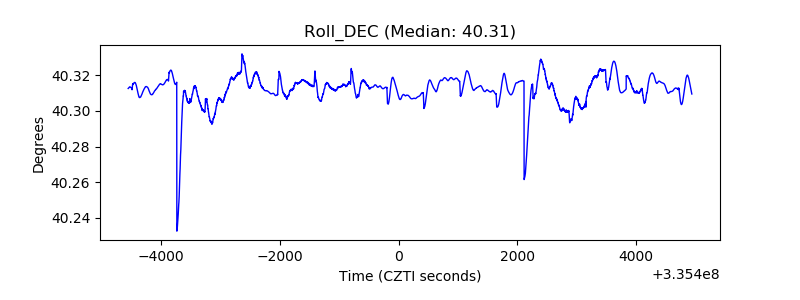 |
| _Roll_RA | 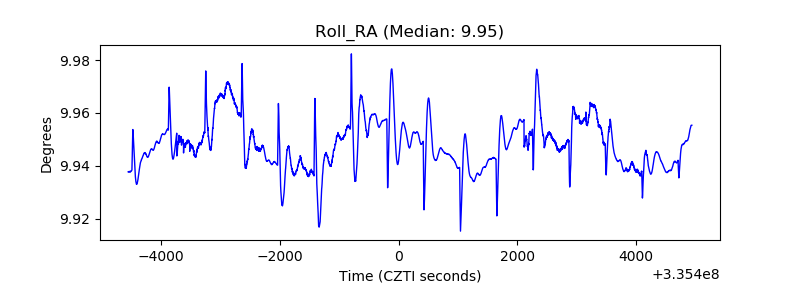 |
| Veto Counter | 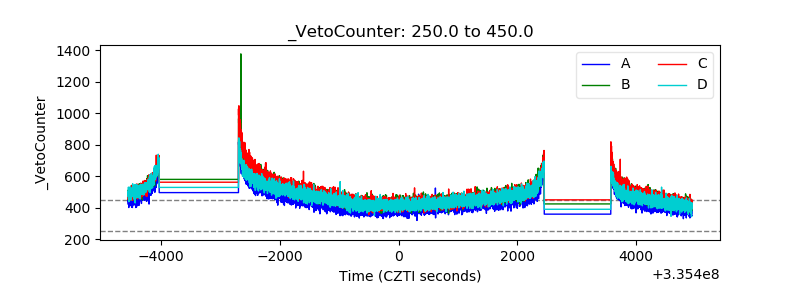 |