| Param | Original file | Final file |
|---|---|---|
| Filename | modeM0/AS1A09_108T02_9000003822_26434cztM0_level2.evt | modeM0/AS1A09_108T02_9000003822_26434cztM0_level2_quad_clean.evt |
| Size (bytes) | 517,083,840 | 100,687,680 |
| Size | 493.1 MB | 96.0 MB |
| Events in quadrant A | 3,475,085 | 637,650 |
| Events in quadrant B | 3,508,847 | 657,758 |
| Events in quadrant C | 3,661,394 | 635,482 |
| Events in quadrant D | 4,525,603 | 616,938 |
| Mode M9 | |||
|---|---|---|---|
| Quadrant | BADHDUFLAG | Total packets | Discarded packets |
| A | 0 | 18 | 0 |
| B | 0 | 18 | 0 |
| C | 0 | 18 | 0 |
| D | 0 | 18 | 0 |
| Mode M0 | |||
|---|---|---|---|
| Quadrant | BADHDUFLAG | Total packets | Discarded packets |
| A | 0 | 15157 | 0 |
| B | 0 | 15093 | 0 |
| C | 0 | 15400 | 0 |
| D | 0 | 18421 | 0 |
| Quadrant | Total seconds | Saturated seconds | Saturation percentage |
|---|---|---|---|
| A | 7201 | 33 | 0.458270% |
| B | 7202 | 82 | 1.138573% |
| C | 7202 | 113 | 1.569009% |
| D | 7202 | 291 | 4.040544% |
Noise dominated data is calculated using 1-second bins in cleaned event files. If a bin has >2000 counts, and if more than 50% of those come from <1% of pixels, then it is considered to be noise-dominated and hence unusable.
| Quadrant | # 1 sec bins | Bins with >0 counts | Bins with >2000 counts | High rate bins dominated by noise | Noise dominated (total time) | Noise dominated (detector-on time) | Marked lightcurve |
|---|---|---|---|---|---|---|---|
| A | 9011 | 7203 | 2 | 2 | 0.02% | 0.03% | 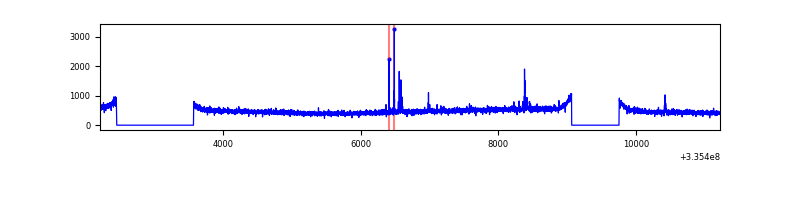 |
| B | 9012 | 7204 | 1 | 1 | 0.01% | 0.01% | 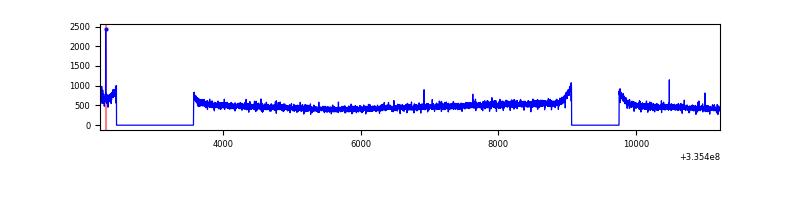 |
| C | 9012 | 7204 | 1 | 1 | 0.01% | 0.01% | 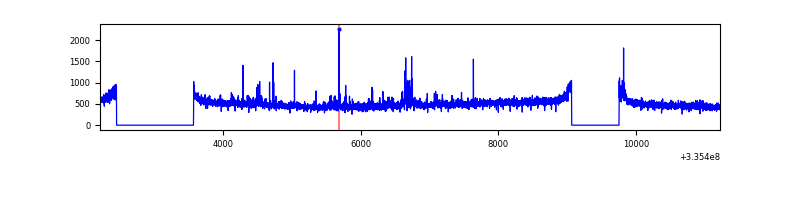 |
| D | 9012 | 7203 | 199 | 199 | 2.21% | 2.76% | 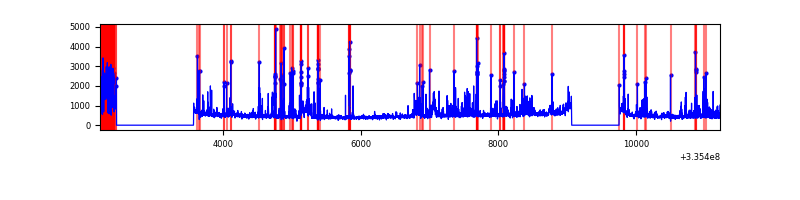 |
Top three noisy pixels from each quadrant. If the there are fewer than three noisy pixels in the level2.evt file, extra rows are filled as -1
| Pixel properties | Quadrant properties | ||||||
|---|---|---|---|---|---|---|---|
| Quadrant | DetID | PixID | Counts | Sigma | Mean | Median | Sigma |
| A | 0 | 13 | 41429 | 226.68 | 889 | 872 | 178.9 |
| A | 13 | 254 | 11194 | 57.69 | 889 | 872 | 178.9 |
| A | 3 | 137 | 8359 | 41.85 | 889 | 872 | 178.9 |
| B | 12 | 111 | 20779 | 117.05 | 893 | 870 | 170.1 |
| B | 11 | 111 | 18433 | 103.26 | 893 | 870 | 170.1 |
| B | 14 | 111 | 16822 | 93.78 | 893 | 870 | 170.1 |
| C | 14 | 238 | 136601 | 662.52 | 867 | 872 | 204.9 |
| C | 3 | 233 | 127873 | 619.91 | 867 | 872 | 204.9 |
| C | 14 | 176 | 14408 | 66.07 | 867 | 872 | 204.9 |
| D | 11 | 176 | 624412 | 3084.64 | 847 | 827 | 202.2 |
| D | 1 | 52 | 322562 | 1591.5 | 847 | 827 | 202.2 |
| D | 12 | 233 | 316235 | 1560.2 | 847 | 827 | 202.2 |
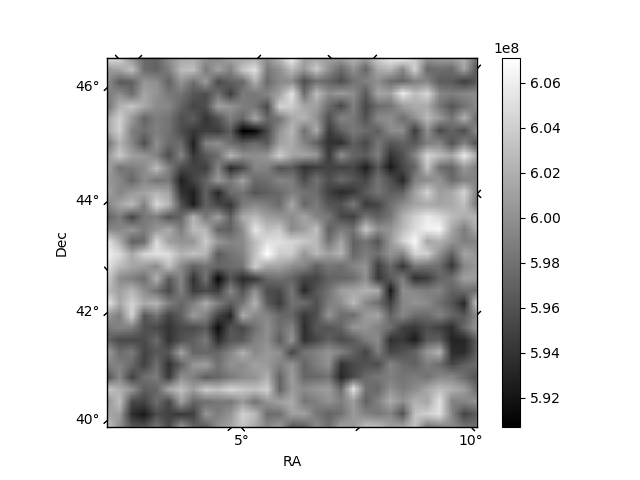
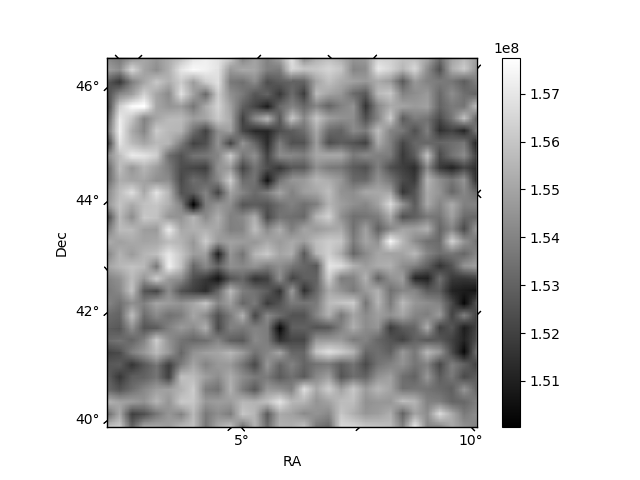
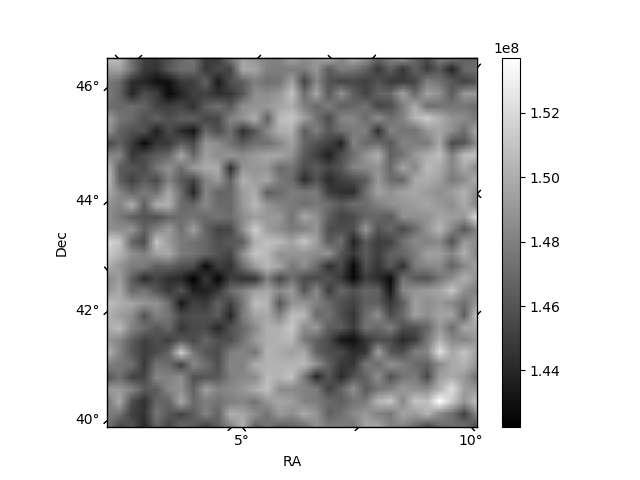
Histogram calculated using DETX and DETY for each event in the final _common_clean file
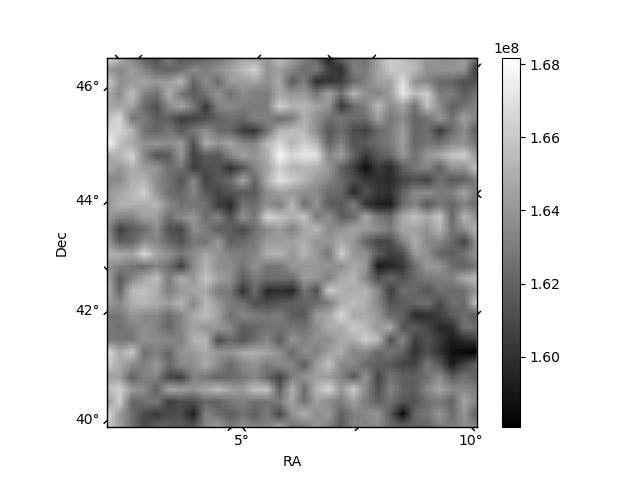
| Quadrant A | 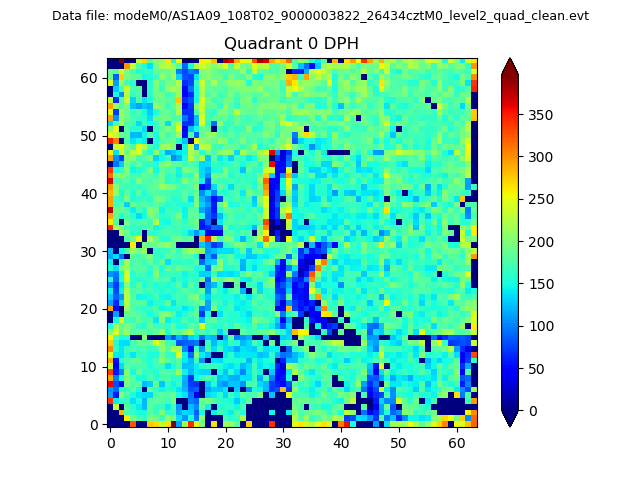 |
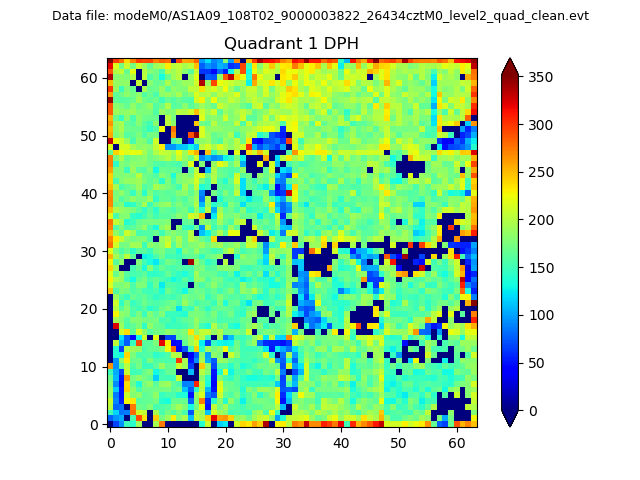 |
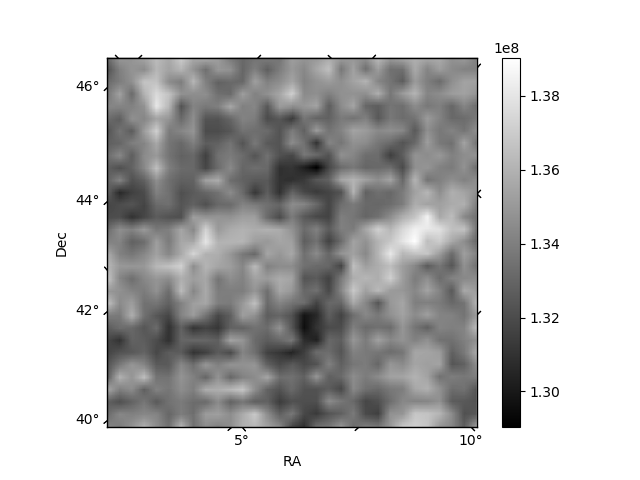
Quadrant B |
|---|---|---|---|
| Quadrant D | 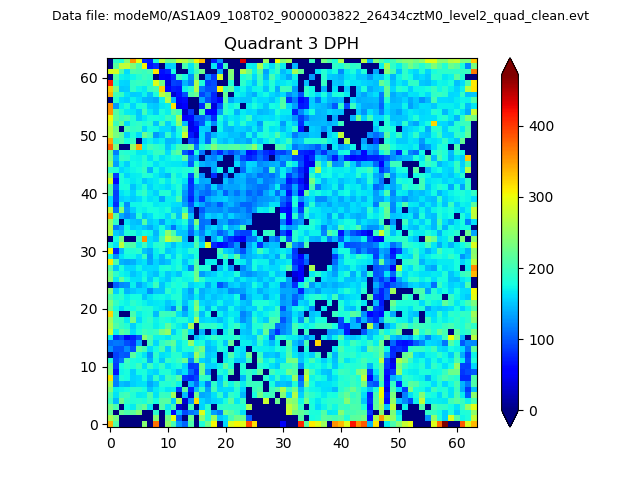 |
 |
Quadrant C |
| Plot type | Count rate plots | Images |
|---|---|---|
| Comparison with Poisson distribution Blue bars denote a histogram of data divided into 1 sec bins. Red curve is a Poisson curve with rate = median count rate of data. |
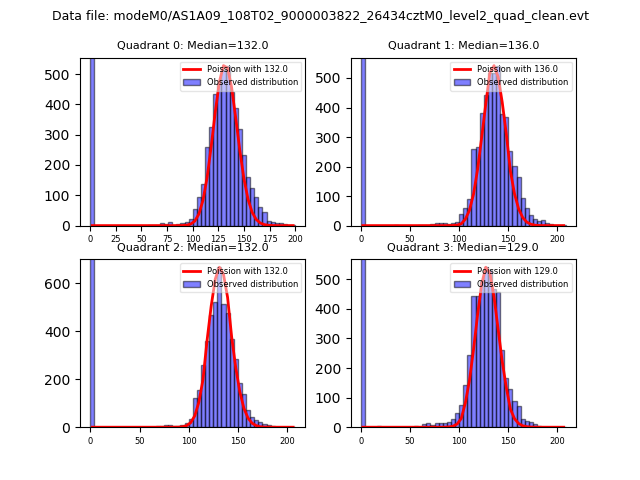 |
 |
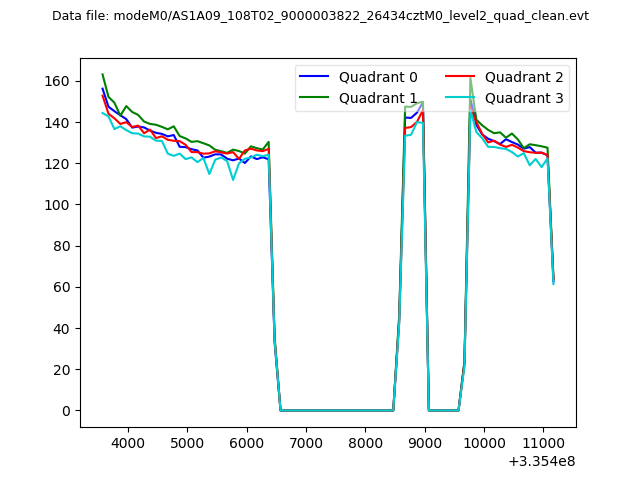
| Quadrant-wise count rates Data is divided into 100 sec bins |
 |
|
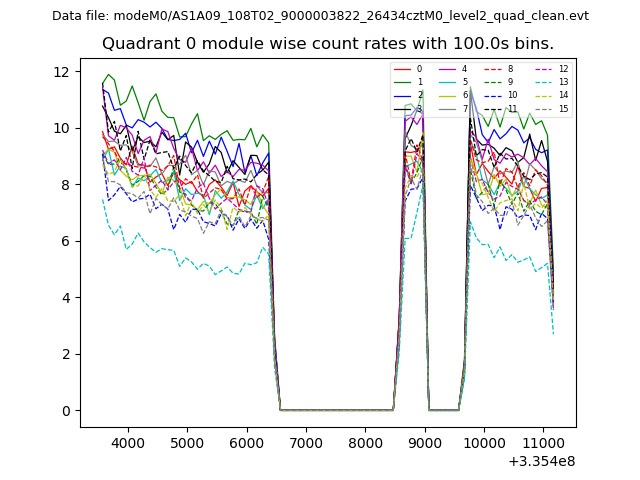
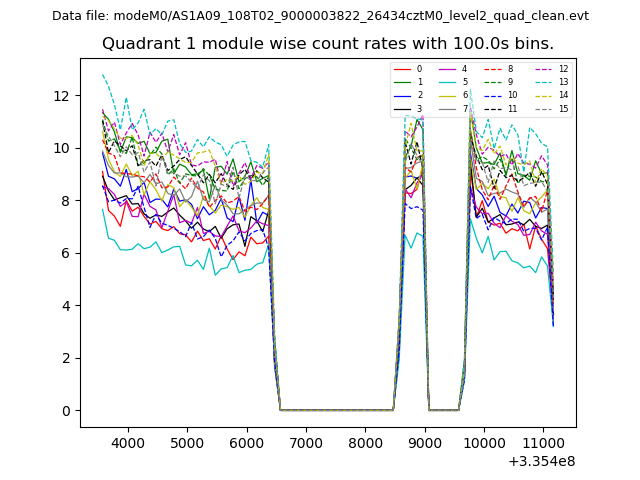
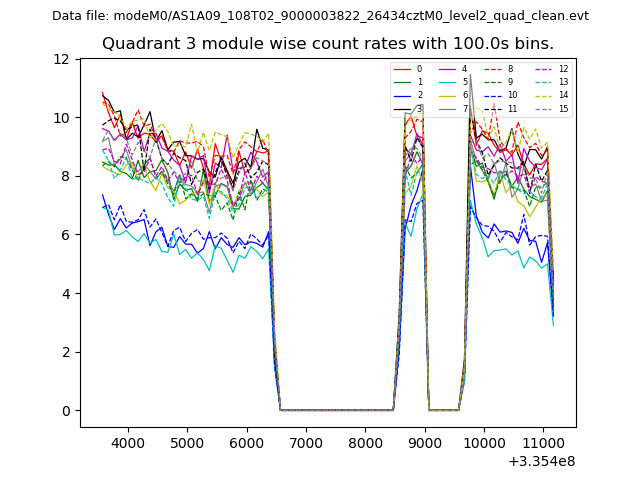
| Module-wise count rates for Quadrant A Data is divided into 100 sec bins |
 |
 |
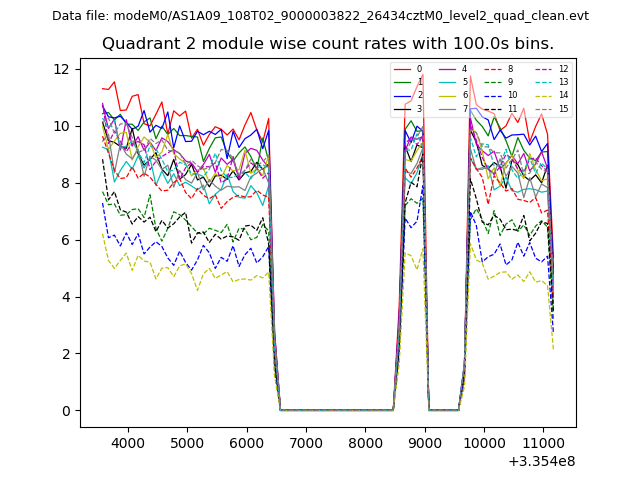
| Module-wise count rates for Quadrant B Data is divided into 100 sec bins |
 |
 |
| Module-wise count rates for Quadrant C Data is divided into 100 sec bins |
 |
 |
| Module-wise count rates for Quadrant D Data is divided into 100 sec bins |
 |
 |
| Parameter | Plot |
|---|---|
| CZT HV Monitor | 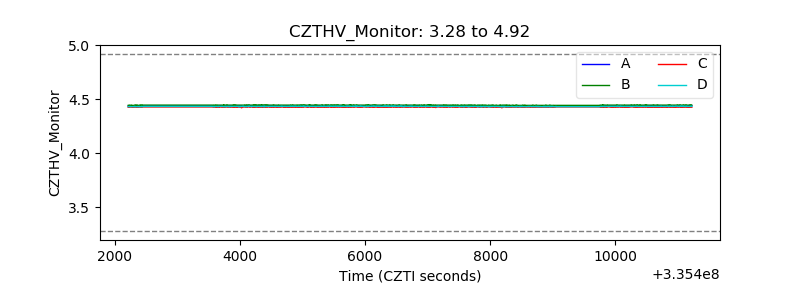 |
| D_VDD | 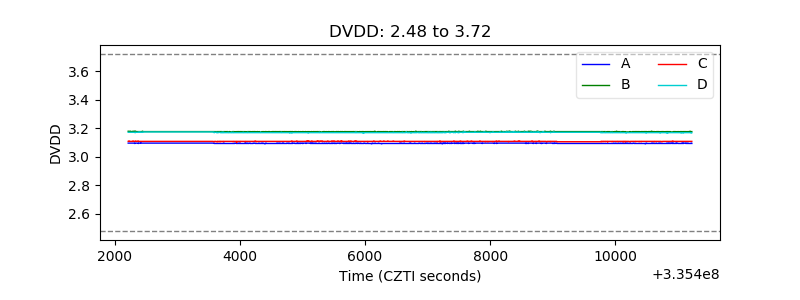 |
| Temperature 1 | 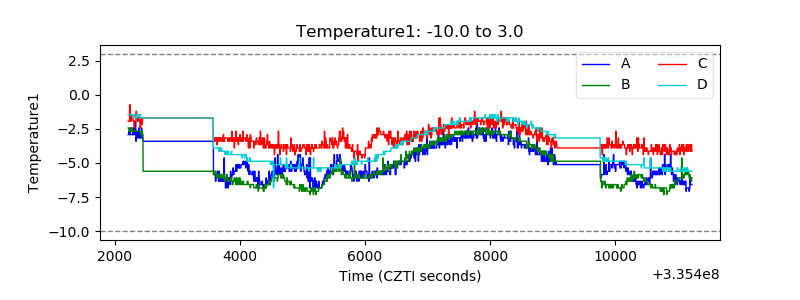 |
| Veto HV Monitor | 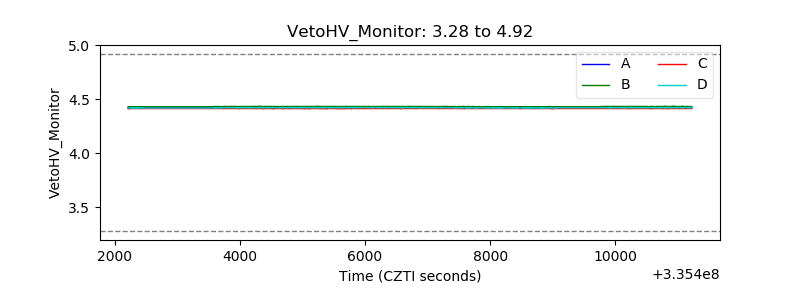 |
| Veto LLD | 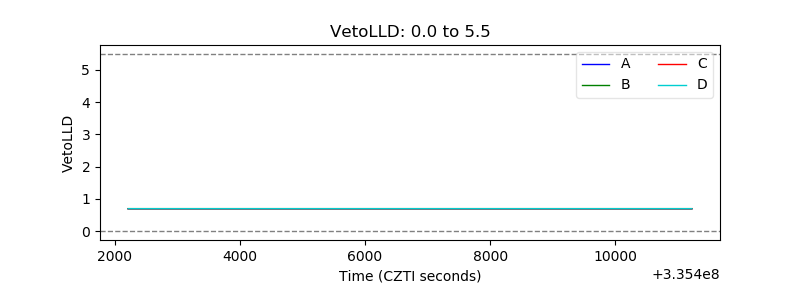 |
| Alpha Counter | 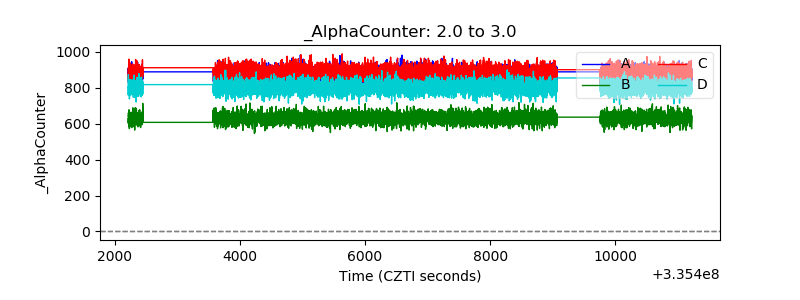 |
| _CPM_Rate | 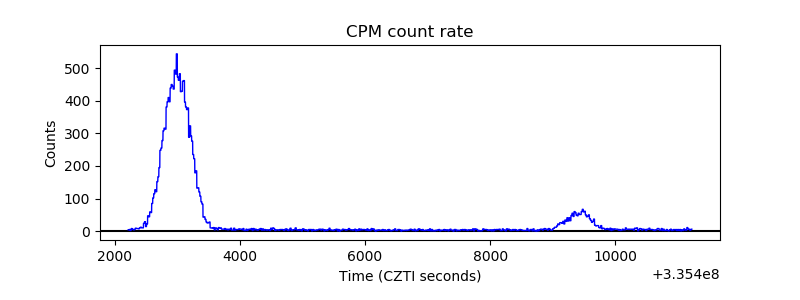 |
| CZT Counter | 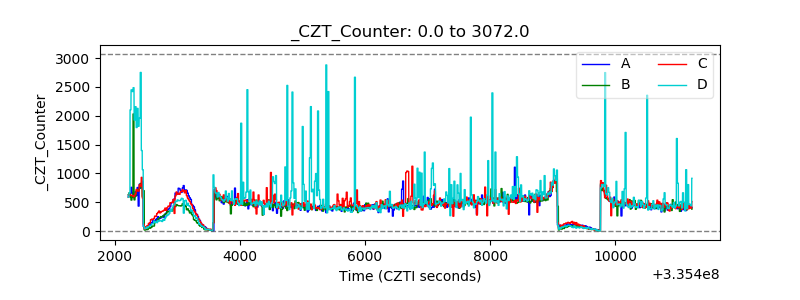 |
| +2.5 Volts monitor |  |
| +5 Volts monitor |  |
| _ROLL_ROT | 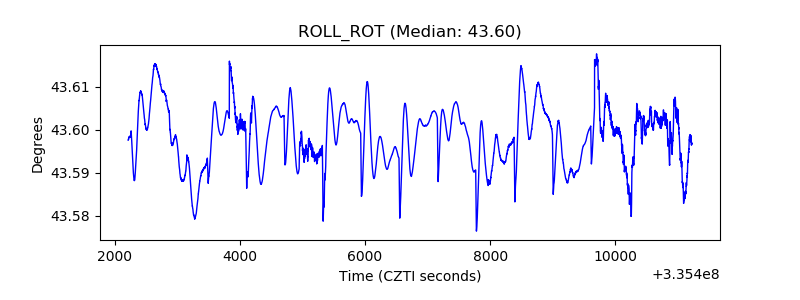 |
| _Roll_DEC | 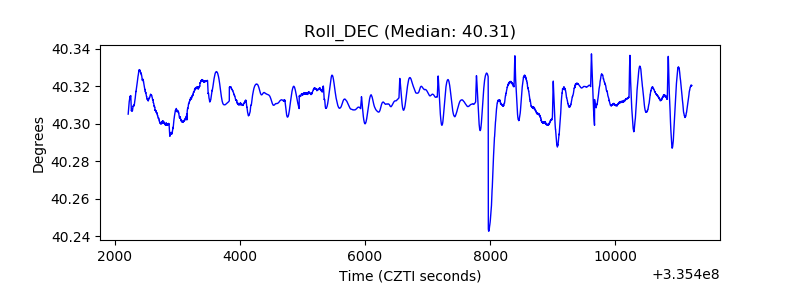 |
| _Roll_RA | 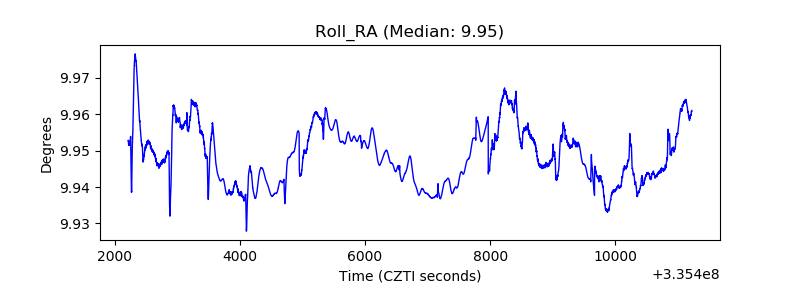 |
| Veto Counter | 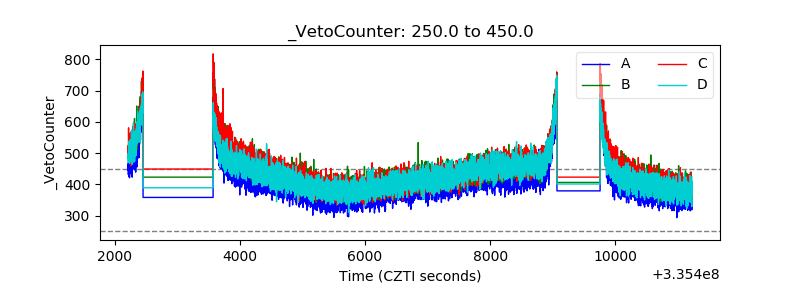 |