| Param | Original file | Final file |
|---|---|---|
| Filename | modeM0/AS1A09_108T02_9000003822_26435cztM0_level2.evt | modeM0/AS1A09_108T02_9000003822_26435cztM0_level2_quad_clean.evt |
| Size (bytes) | 620,015,040 | 119,122,560 |
| Size | 591.3 MB | 113.6 MB |
| Events in quadrant A | 4,030,689 | 767,213 |
| Events in quadrant B | 4,015,347 | 788,039 |
| Events in quadrant C | 4,103,547 | 759,895 |
| Events in quadrant D | 6,072,314 | 723,271 |
| Mode M9 | |||
|---|---|---|---|
| Quadrant | BADHDUFLAG | Total packets | Discarded packets |
| A | 0 | 9 | 0 |
| B | 0 | 9 | 0 |
| C | 0 | 9 | 0 |
| D | 0 | 9 | 0 |
| Mode M0 | |||
|---|---|---|---|
| Quadrant | BADHDUFLAG | Total packets | Discarded packets |
| A | 0 | 17431 | 0 |
| B | 0 | 17244 | 0 |
| C | 0 | 17446 | 0 |
| D | 0 | 23689 | 0 |
| Quadrant | Total seconds | Saturated seconds | Saturation percentage |
|---|---|---|---|
| A | 8195 | 118 | 1.439902% |
| B | 8196 | 161 | 1.964373% |
| C | 8196 | 176 | 2.147389% |
| D | 8196 | 547 | 6.673987% |
Noise dominated data is calculated using 1-second bins in cleaned event files. If a bin has >2000 counts, and if more than 50% of those come from <1% of pixels, then it is considered to be noise-dominated and hence unusable.
| Quadrant | # 1 sec bins | Bins with >0 counts | Bins with >2000 counts | High rate bins dominated by noise | Noise dominated (total time) | Noise dominated (detector-on time) | Marked lightcurve |
|---|---|---|---|---|---|---|---|
| A | 9090 | 8198 | 5 | 5 | 0.06% | 0.06% | 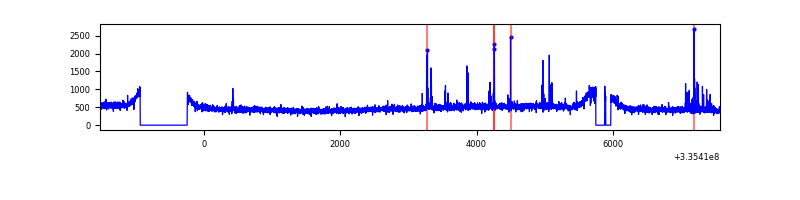 |
| B | 9091 | 8199 | 0 | 0 | 0.00% | 0.00% | 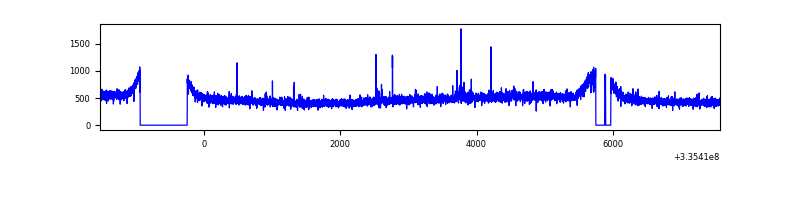 |
| C | 9091 | 8198 | 1 | 1 | 0.01% | 0.01% | 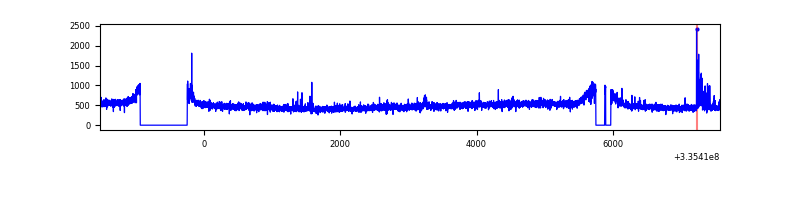 |
| D | 9091 | 8199 | 367 | 367 | 4.04% | 4.48% | 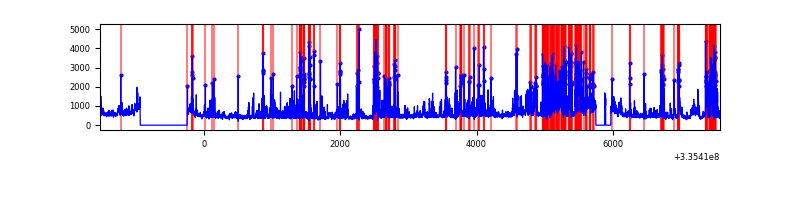 |
Top three noisy pixels from each quadrant. If the there are fewer than three noisy pixels in the level2.evt file, extra rows are filled as -1
| Pixel properties | Quadrant properties | ||||||
|---|---|---|---|---|---|---|---|
| Quadrant | DetID | PixID | Counts | Sigma | Mean | Median | Sigma |
| A | 0 | 13 | 98978 | 475.85 | 1017 | 995 | 205.9 |
| A | 13 | 254 | 11644 | 51.72 | 1017 | 995 | 205.9 |
| A | 12 | 189 | 11136 | 49.25 | 1017 | 995 | 205.9 |
| B | 12 | 111 | 24798 | 120.84 | 1018 | 990 | 197.0 |
| B | 11 | 111 | 21774 | 105.49 | 1018 | 990 | 197.0 |
| B | 14 | 111 | 19535 | 94.13 | 1018 | 990 | 197.0 |
| C | 14 | 238 | 153602 | 657.26 | 987 | 992 | 232.2 |
| C | 14 | 176 | 55467 | 234.61 | 987 | 992 | 232.2 |
| C | 3 | 233 | 37286 | 156.31 | 987 | 992 | 232.2 |
| D | 1 | 52 | 1226030 | 5321.83 | 967 | 943 | 230.2 |
| D | 11 | 176 | 808251 | 3506.98 | 967 | 943 | 230.2 |
| D | 7 | 80 | 288453 | 1248.96 | 967 | 943 | 230.2 |
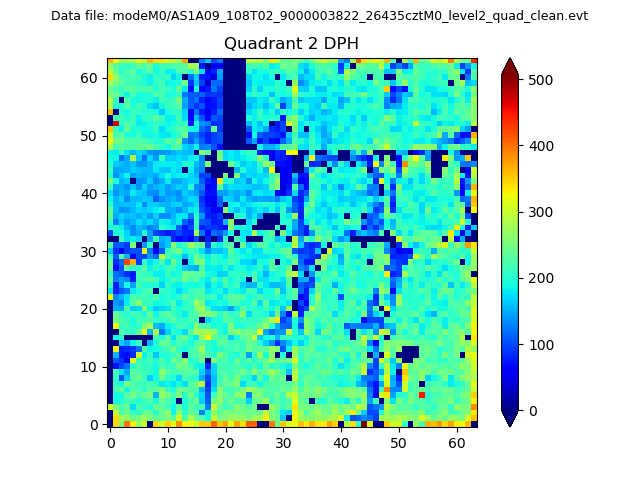
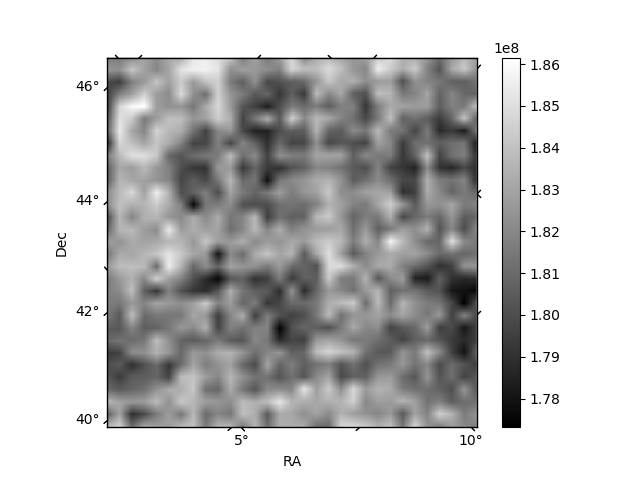
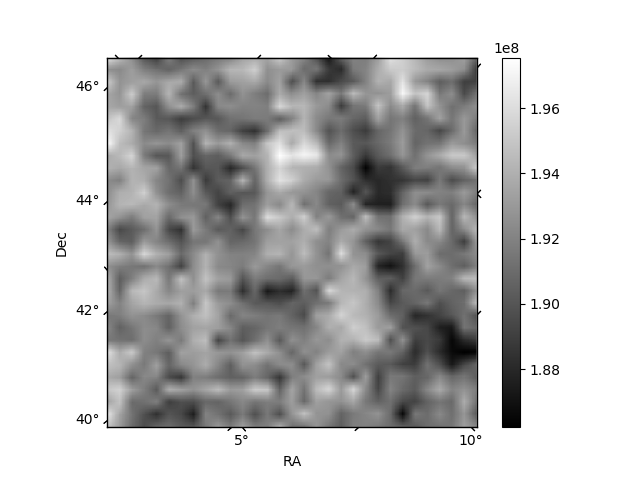
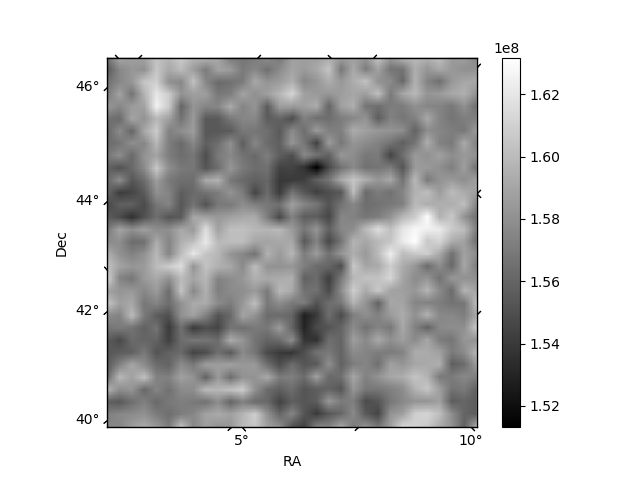
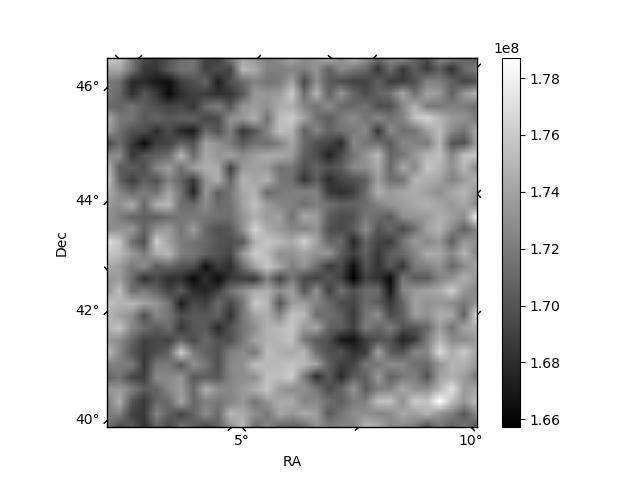
Histogram calculated using DETX and DETY for each event in the final _common_clean file
| Quadrant A | 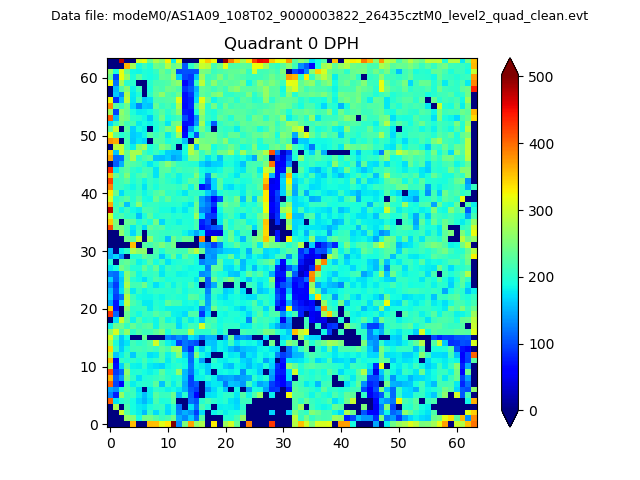 |
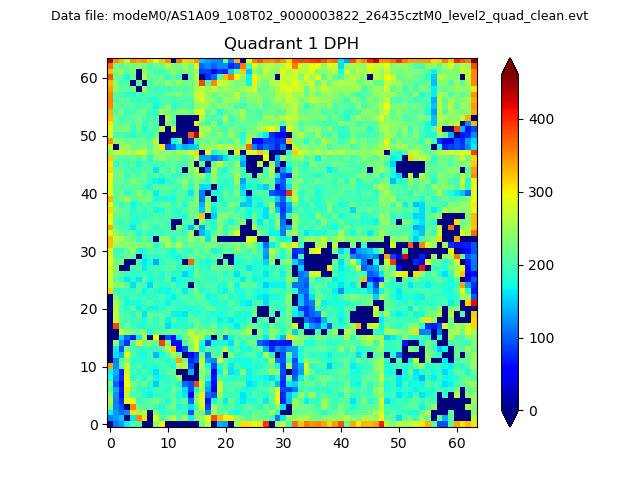 |
Quadrant B |
|---|---|---|---|
| Quadrant D | 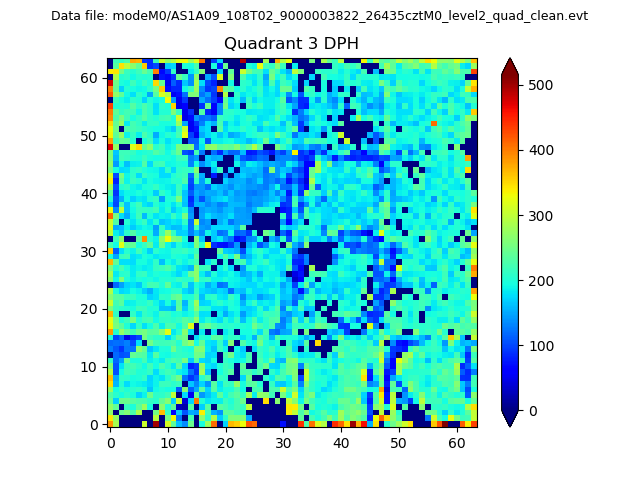 |
 |
Quadrant C |
| Plot type | Count rate plots | Images |
|---|---|---|
| Comparison with Poisson distribution Blue bars denote a histogram of data divided into 1 sec bins. Red curve is a Poisson curve with rate = median count rate of data. |
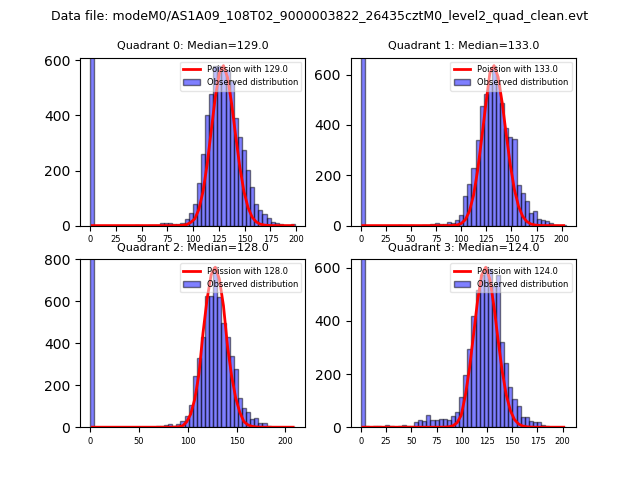 |
 |
| Quadrant-wise count rates Data is divided into 100 sec bins |
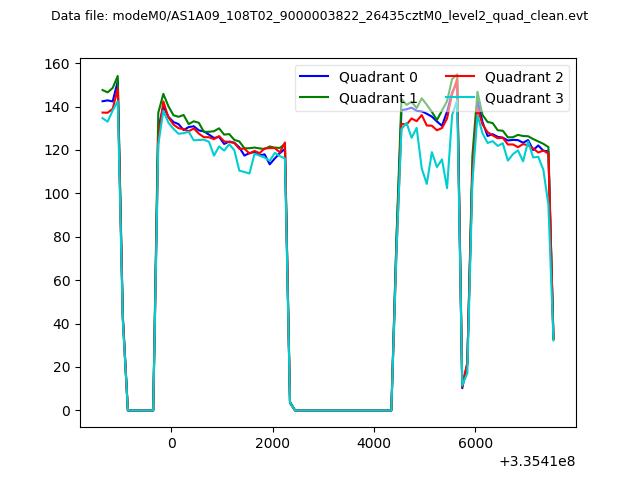 |
|
| Module-wise count rates for Quadrant A Data is divided into 100 sec bins |
 |
 |
| Module-wise count rates for Quadrant B Data is divided into 100 sec bins |
 |
 |
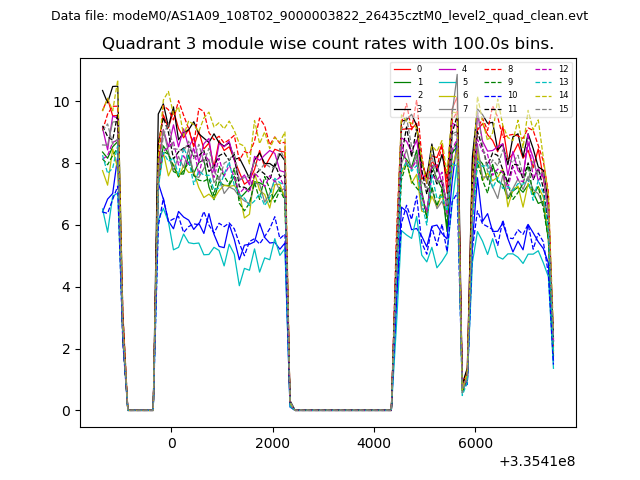
| Module-wise count rates for Quadrant C Data is divided into 100 sec bins |
 |
 |
| Module-wise count rates for Quadrant D Data is divided into 100 sec bins |
 |
 |
| Parameter | Plot |
|---|---|
| CZT HV Monitor | 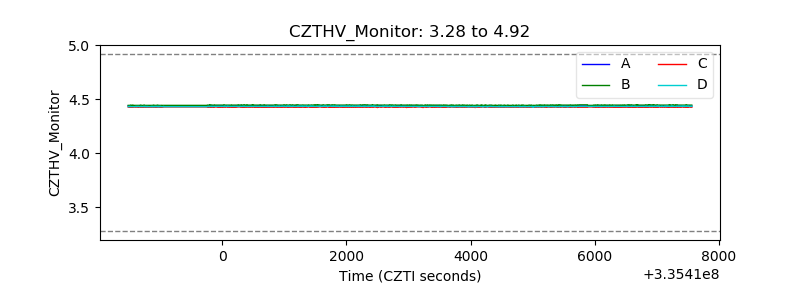 |
| D_VDD | 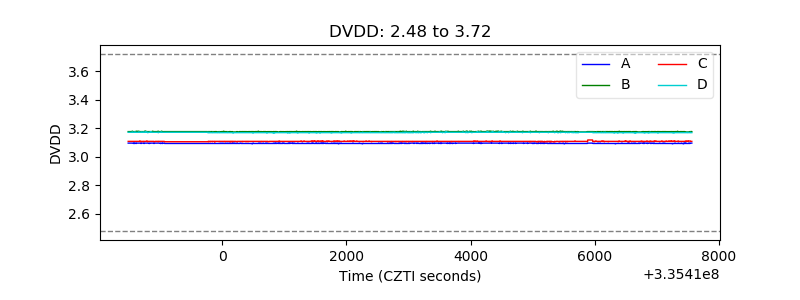 |
| Temperature 1 | 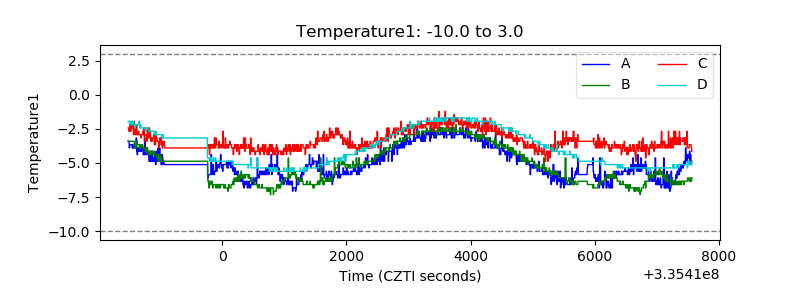 |
| Veto HV Monitor | 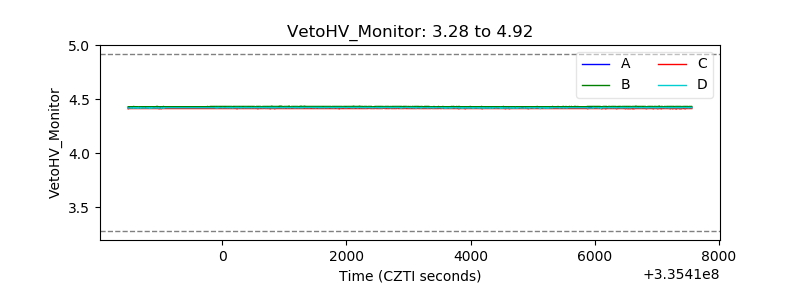 |
| Veto LLD | 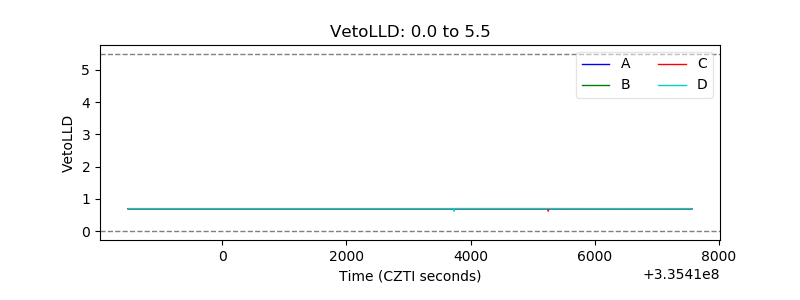 |
| Alpha Counter | 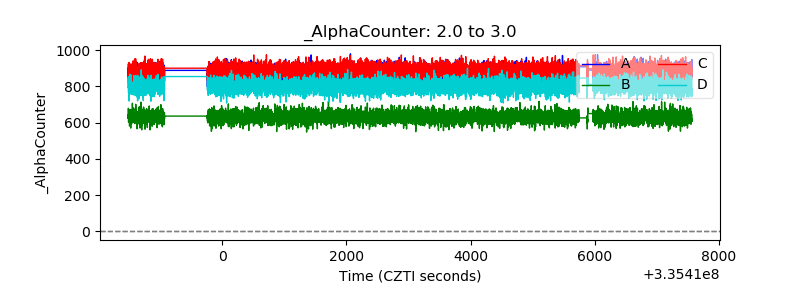 |
| _CPM_Rate | 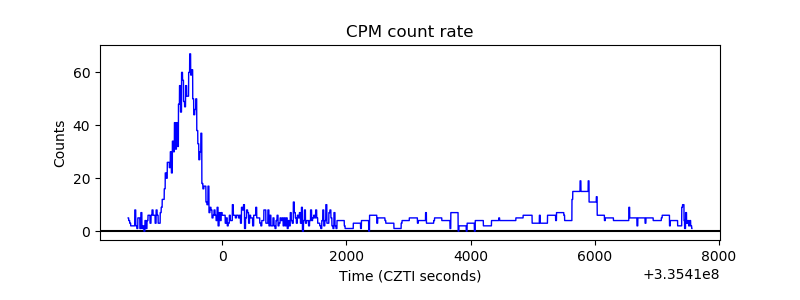 |
| CZT Counter |  |
| +2.5 Volts monitor |  |
| +5 Volts monitor |  |
| _ROLL_ROT | 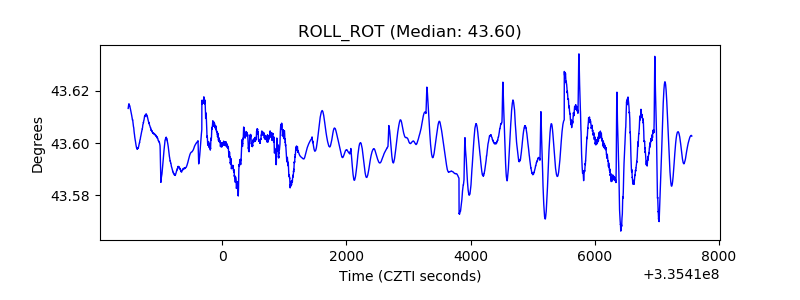 |
| _Roll_DEC | 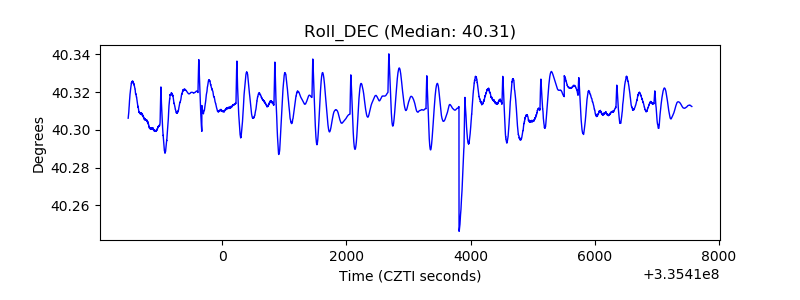 |
| _Roll_RA |  |
| Veto Counter |  |