| Param | Original file | Final file |
|---|---|---|
| Filename | modeM0/AS1A09_108T02_9000003822_26436cztM0_level2.evt | modeM0/AS1A09_108T02_9000003822_26436cztM0_level2_quad_clean.evt |
| Size (bytes) | 571,276,800 | 109,774,080 |
| Size | 544.8 MB | 104.7 MB |
| Events in quadrant A | 3,663,518 | 704,416 |
| Events in quadrant B | 3,615,854 | 723,419 |
| Events in quadrant C | 3,810,853 | 697,674 |
| Events in quadrant D | 5,689,757 | 664,727 |
| Mode M9 | |||
|---|---|---|---|
| Quadrant | BADHDUFLAG | Total packets | Discarded packets |
| A | 0 | 2 | 0 |
| B | 0 | 2 | 0 |
| C | 0 | 2 | 0 |
| D | 0 | 2 | 0 |
| Mode M0 | |||
|---|---|---|---|
| Quadrant | BADHDUFLAG | Total packets | Discarded packets |
| A | 0 | 16024 | 0 |
| B | 0 | 15800 | 0 |
| C | 0 | 16265 | 0 |
| D | 0 | 22167 | 0 |
| Quadrant | Total seconds | Saturated seconds | Saturation percentage |
|---|---|---|---|
| A | 7684 | 77 | 1.002082% |
| B | 7685 | 106 | 1.379310% |
| C | 7685 | 122 | 1.587508% |
| D | 7685 | 512 | 6.662329% |
Noise dominated data is calculated using 1-second bins in cleaned event files. If a bin has >2000 counts, and if more than 50% of those come from <1% of pixels, then it is considered to be noise-dominated and hence unusable.
| Quadrant | # 1 sec bins | Bins with >0 counts | Bins with >2000 counts | High rate bins dominated by noise | Noise dominated (total time) | Noise dominated (detector-on time) | Marked lightcurve |
|---|---|---|---|---|---|---|---|
| A | 7864 | 7685 | 4 | 4 | 0.05% | 0.05% |  |
| B | 7865 | 7686 | 1 | 1 | 0.01% | 0.01% |  |
| C | 7865 | 7686 | 6 | 6 | 0.08% | 0.08% |  |
| D | 7865 | 7686 | 407 | 407 | 5.17% | 5.30% |  |
Top three noisy pixels from each quadrant. If the there are fewer than three noisy pixels in the level2.evt file, extra rows are filled as -1
| Pixel properties | Quadrant properties | ||||||
|---|---|---|---|---|---|---|---|
| Quadrant | DetID | PixID | Counts | Sigma | Mean | Median | Sigma |
| A | 0 | 13 | 118405 | 632.03 | 917 | 896 | 185.9 |
| A | 13 | 254 | 10326 | 50.72 | 917 | 896 | 185.9 |
| A | 3 | 137 | 9142 | 44.35 | 917 | 896 | 185.9 |
| B | 12 | 111 | 22018 | 118.98 | 920 | 898 | 177.5 |
| B | 11 | 111 | 19768 | 106.31 | 920 | 898 | 177.5 |
| B | 14 | 111 | 17735 | 94.85 | 920 | 898 | 177.5 |
| C | 14 | 238 | 139138 | 662.59 | 888 | 893 | 208.6 |
| C | 14 | 176 | 101453 | 481.97 | 888 | 893 | 208.6 |
| C | 3 | 233 | 96293 | 457.24 | 888 | 893 | 208.6 |
| D | 1 | 52 | 1091655 | 5282.56 | 869 | 850 | 206.5 |
| D | 11 | 176 | 935192 | 4524.84 | 869 | 850 | 206.5 |
| D | 7 | 80 | 333196 | 1609.49 | 869 | 850 | 206.5 |
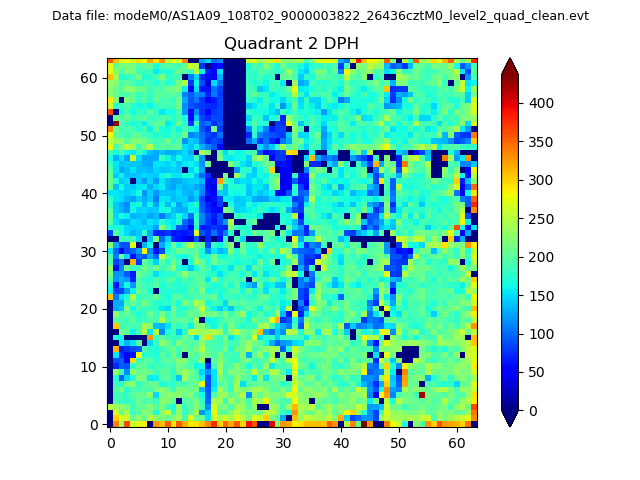
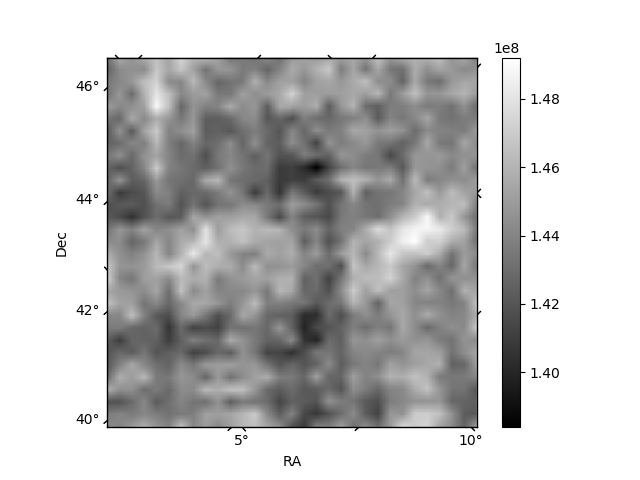
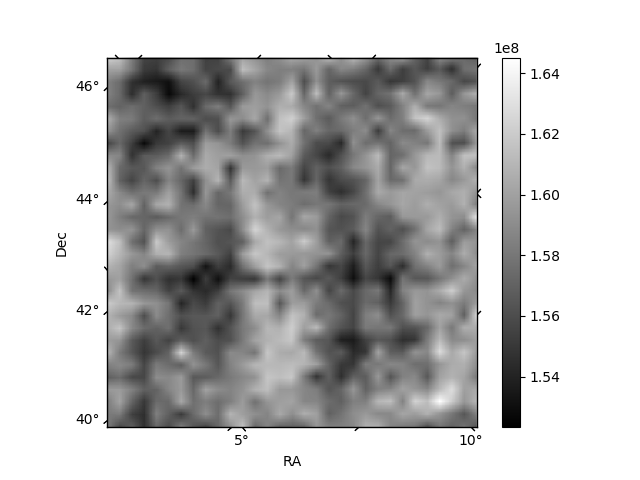
Histogram calculated using DETX and DETY for each event in the final _common_clean file
| Quadrant A | 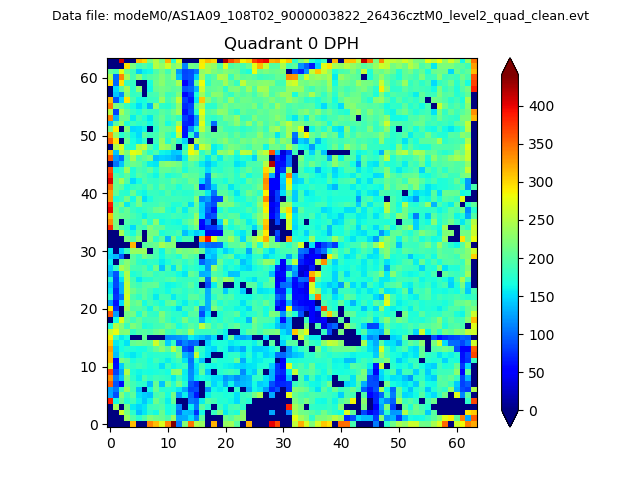 |
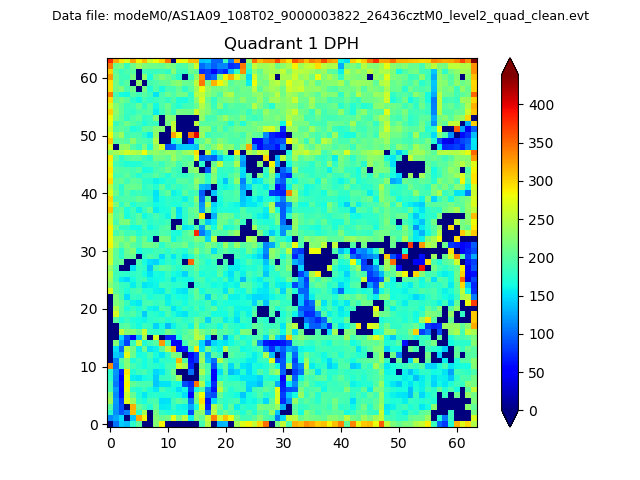 |
Quadrant B |
|---|---|---|---|
| Quadrant D | 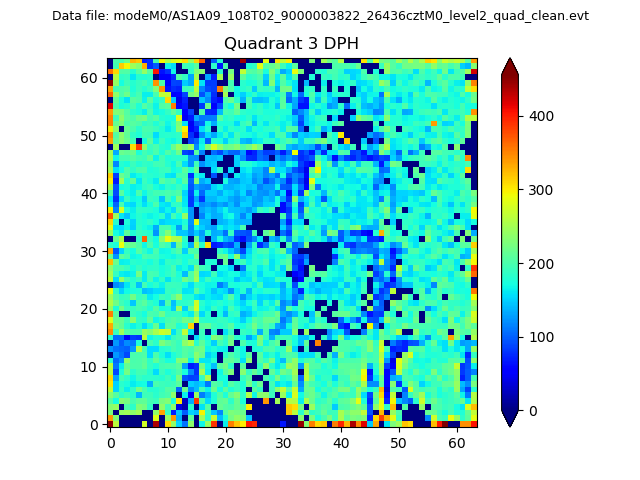 |
 |
Quadrant C |
| Plot type | Count rate plots | Images |
|---|---|---|
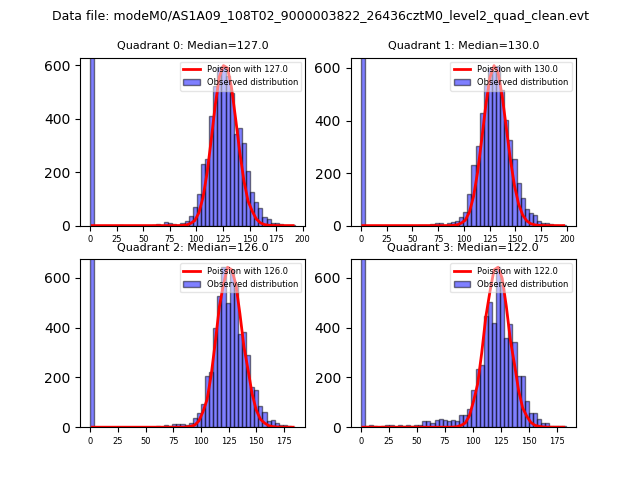
| Comparison with Poisson distribution Blue bars denote a histogram of data divided into 1 sec bins. Red curve is a Poisson curve with rate = median count rate of data. |
 |
 |
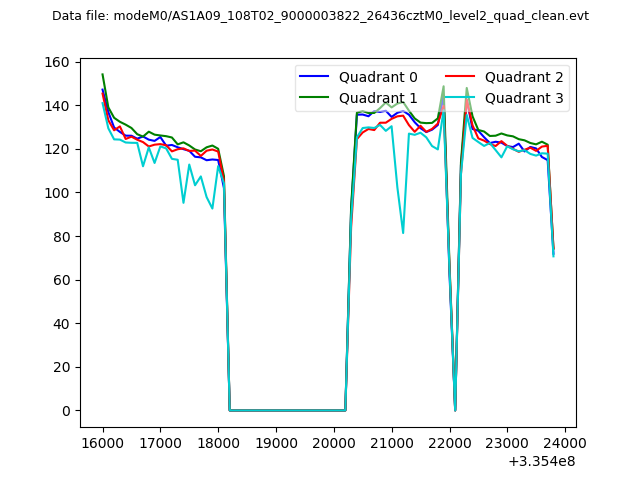
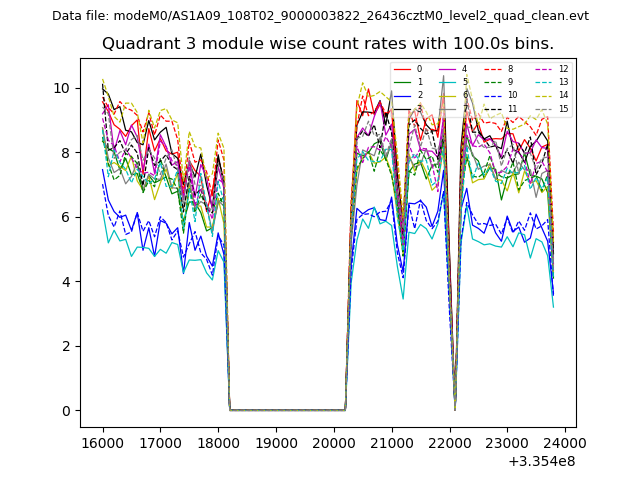
| Quadrant-wise count rates Data is divided into 100 sec bins |
 |
|
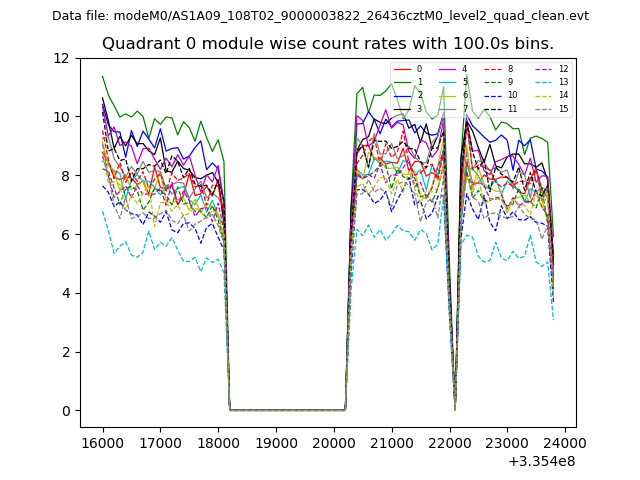
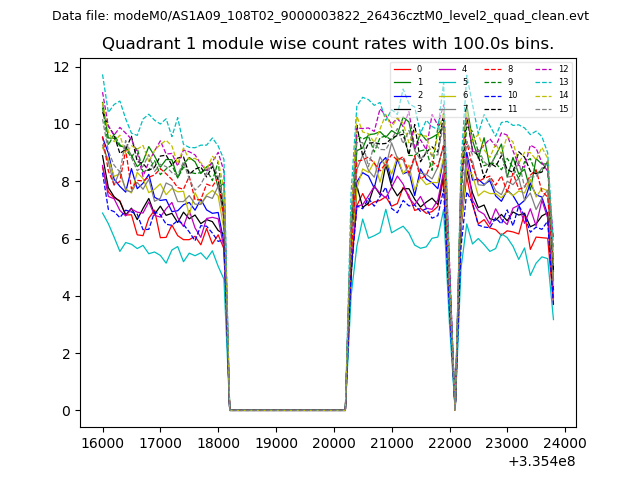
| Module-wise count rates for Quadrant A Data is divided into 100 sec bins |
 |
 |
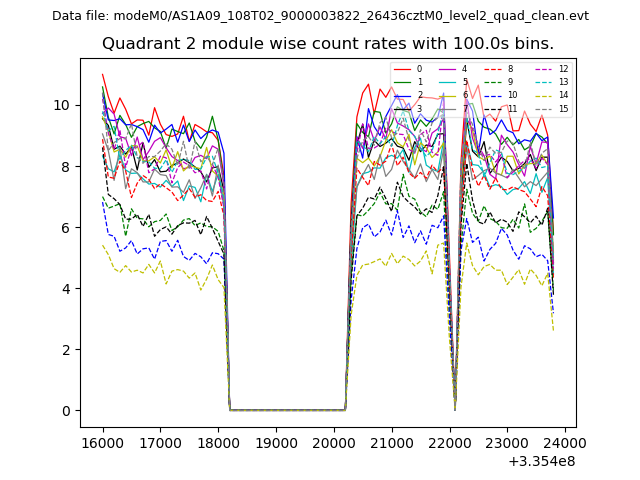
| Module-wise count rates for Quadrant B Data is divided into 100 sec bins |
 |
 |
| Module-wise count rates for Quadrant C Data is divided into 100 sec bins |
 |
 |
| Module-wise count rates for Quadrant D Data is divided into 100 sec bins |
 |
 |
| Parameter | Plot |
|---|---|
| CZT HV Monitor | 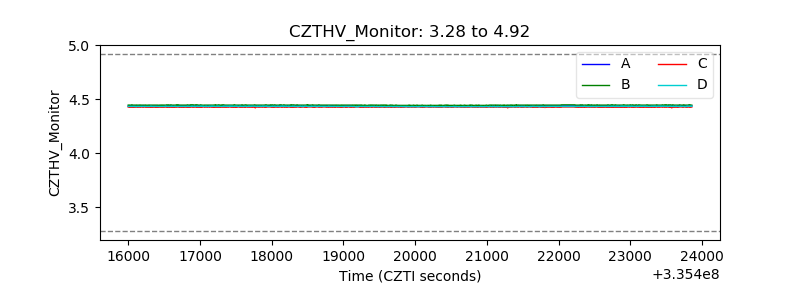 |
| D_VDD | 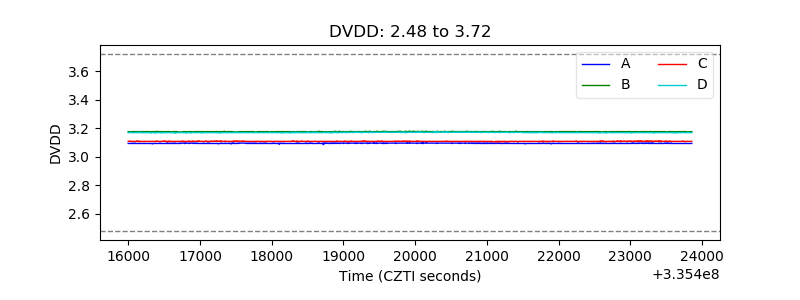 |
| Temperature 1 | 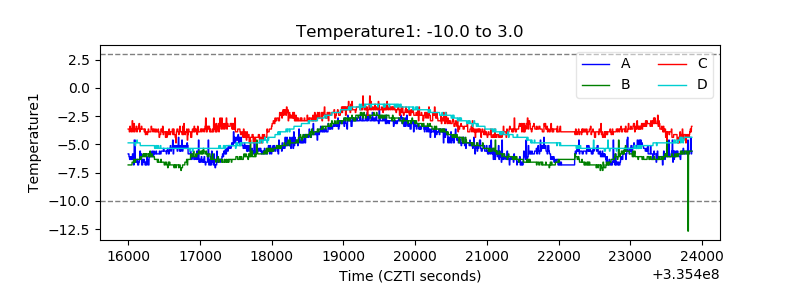 |
| Veto HV Monitor | 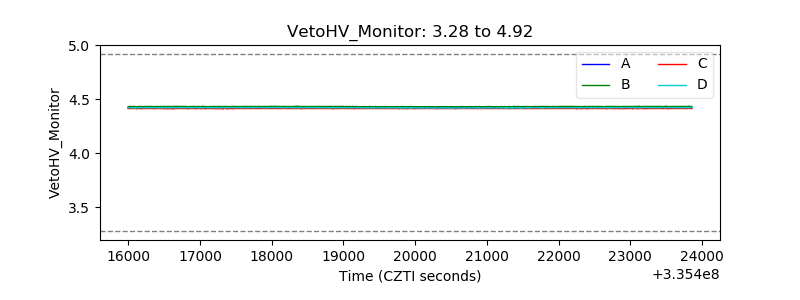 |
| Veto LLD | 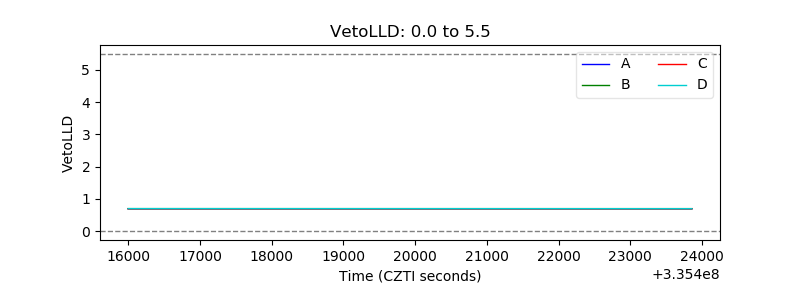 |
| Alpha Counter | 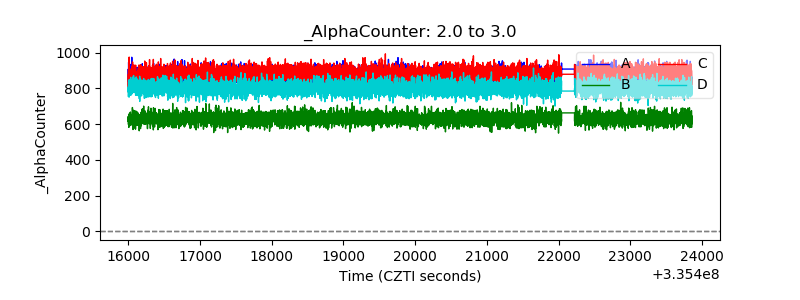 |
| _CPM_Rate | 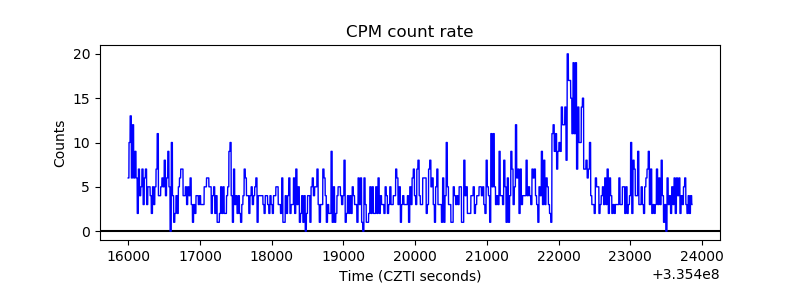 |
| CZT Counter | 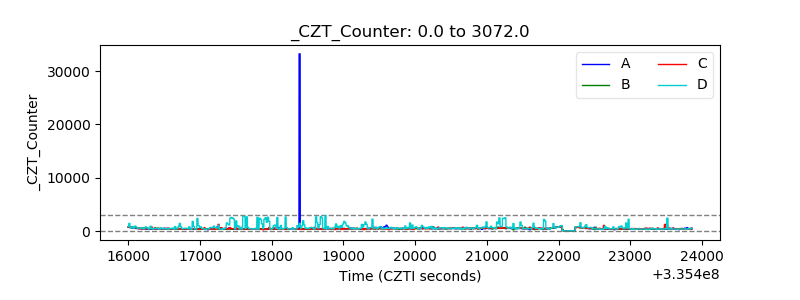 |
| +2.5 Volts monitor | 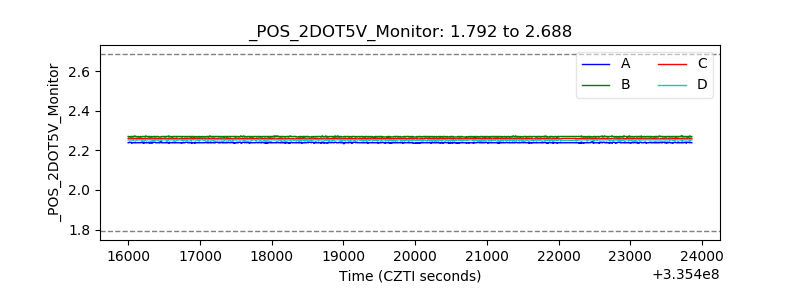 |
| +5 Volts monitor | 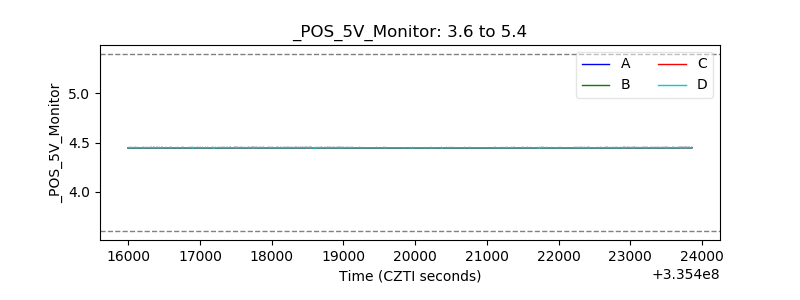 |
| _ROLL_ROT | 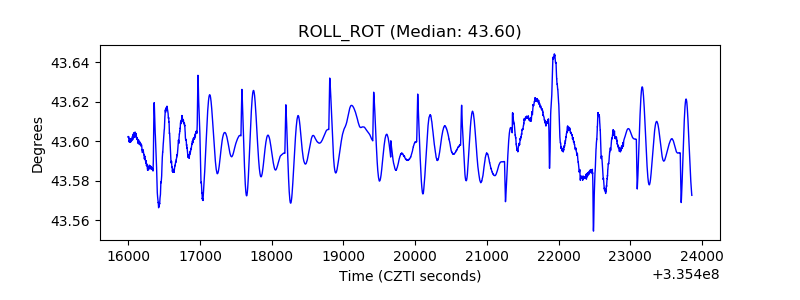 |
| _Roll_DEC | 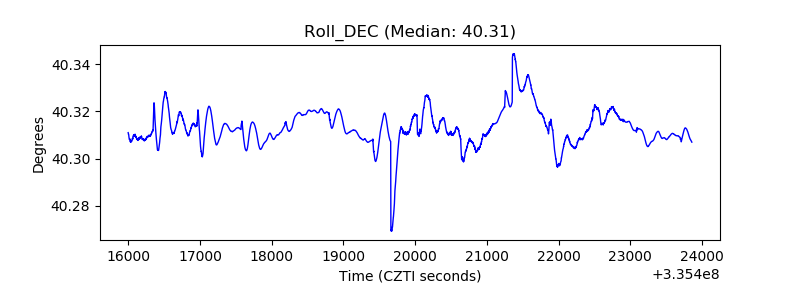 |
| _Roll_RA | 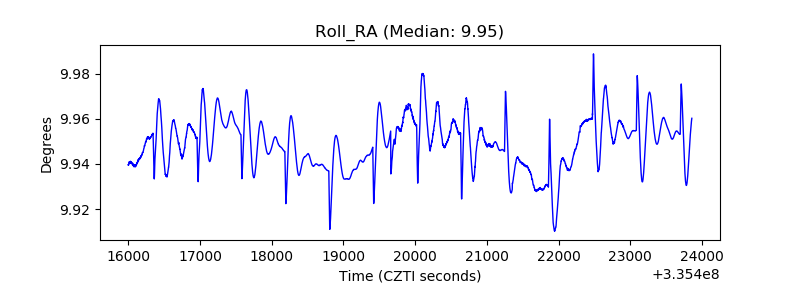 |
| Veto Counter | 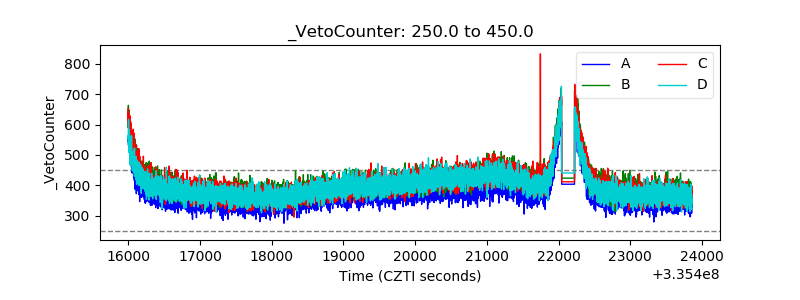 |