| Param | Original file | Final file |
|---|---|---|
| Filename | modeM0/AS1A09_108T02_9000003822_26437cztM0_level2.evt | modeM0/AS1A09_108T02_9000003822_26437cztM0_level2_quad_clean.evt |
| Size (bytes) | 562,092,480 | 85,777,920 |
| Size | 536.1 MB | 81.8 MB |
| Events in quadrant A | 3,261,278 | 544,177 |
| Events in quadrant B | 3,173,748 | 559,638 |
| Events in quadrant C | 3,326,127 | 541,871 |
| Events in quadrant D | 6,800,233 | 477,397 |
| Mode M9 | |||
|---|---|---|---|
| Quadrant | BADHDUFLAG | Total packets | Discarded packets |
| A | 0 | 4 | 0 |
| B | 0 | 4 | 0 |
| C | 0 | 4 | 0 |
| D | 0 | 4 | 0 |
| Mode M0 | |||
|---|---|---|---|
| Quadrant | BADHDUFLAG | Total packets | Discarded packets |
| A | 0 | 14158 | 0 |
| B | 0 | 13848 | 0 |
| C | 0 | 14210 | 0 |
| D | 0 | 24943 | 0 |
| Quadrant | Total seconds | Saturated seconds | Saturation percentage |
|---|---|---|---|
| A | 6803 | 89 | 1.308246% |
| B | 6803 | 68 | 0.999559% |
| C | 6804 | 97 | 1.425632% |
| D | 6803 | 1324 | 19.462002% |
Noise dominated data is calculated using 1-second bins in cleaned event files. If a bin has >2000 counts, and if more than 50% of those come from <1% of pixels, then it is considered to be noise-dominated and hence unusable.
| Quadrant | # 1 sec bins | Bins with >0 counts | Bins with >2000 counts | High rate bins dominated by noise | Noise dominated (total time) | Noise dominated (detector-on time) | Marked lightcurve |
|---|---|---|---|---|---|---|---|
| A | 7203 | 6803 | 12 | 12 | 0.17% | 0.18% | 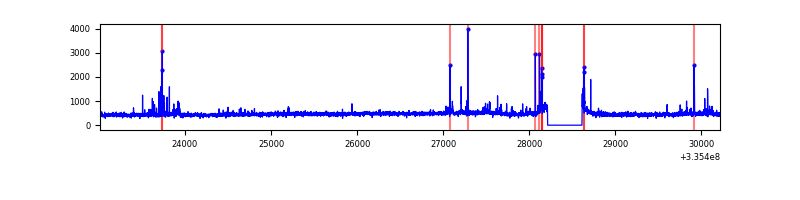 |
| B | 7203 | 6803 | 1 | 1 | 0.01% | 0.01% | 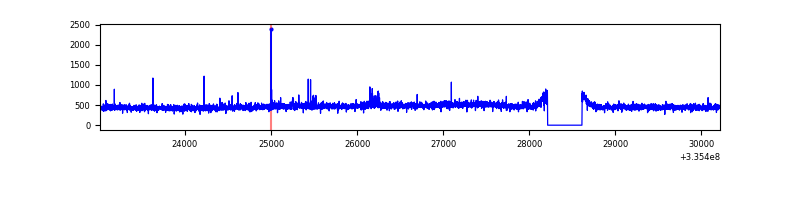 |
| C | 7204 | 6805 | 8 | 8 | 0.11% | 0.12% | 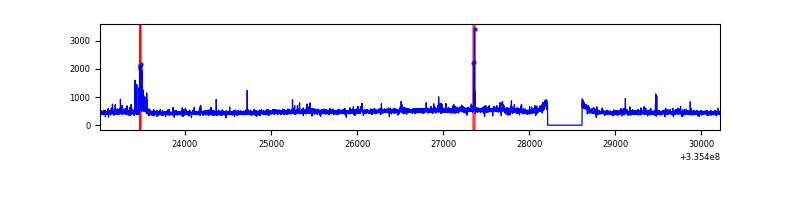 |
| D | 7203 | 6804 | 1149 | 1149 | 15.95% | 16.89% | 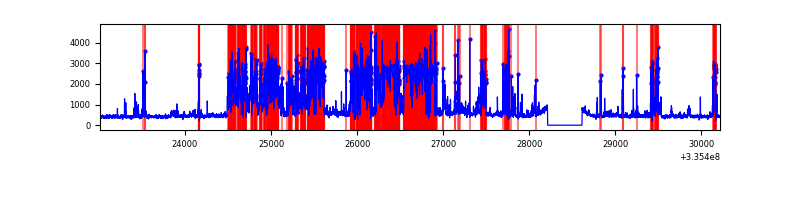 |
Top three noisy pixels from each quadrant. If the there are fewer than three noisy pixels in the level2.evt file, extra rows are filled as -1
| Pixel properties | Quadrant properties | ||||||
|---|---|---|---|---|---|---|---|
| Quadrant | DetID | PixID | Counts | Sigma | Mean | Median | Sigma |
| A | 0 | 13 | 157535 | 966.36 | 803 | 786 | 162.2 |
| A | 13 | 254 | 9099 | 51.25 | 803 | 786 | 162.2 |
| A | 3 | 137 | 7843 | 43.51 | 803 | 786 | 162.2 |
| B | 12 | 111 | 19342 | 119.31 | 802 | 782 | 155.6 |
| B | 11 | 111 | 17467 | 107.25 | 802 | 782 | 155.6 |
| B | 14 | 111 | 15515 | 94.71 | 802 | 782 | 155.6 |
| C | 14 | 238 | 123458 | 673.94 | 774 | 778 | 182.0 |
| C | 3 | 233 | 90997 | 495.61 | 774 | 778 | 182.0 |
| C | 14 | 176 | 54415 | 294.65 | 774 | 778 | 182.0 |
| D | 1 | 52 | 3377046 | 19946.06 | 707 | 689 | 169.3 |
| D | 11 | 176 | 442140 | 2607.9 | 707 | 689 | 169.3 |
| D | 7 | 80 | 284298 | 1675.44 | 707 | 689 | 169.3 |
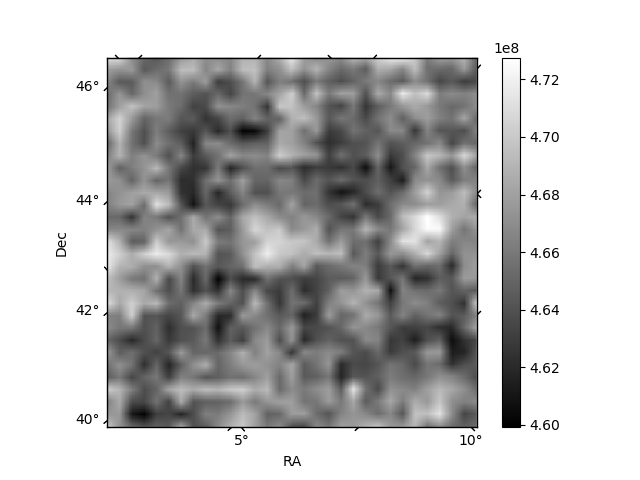
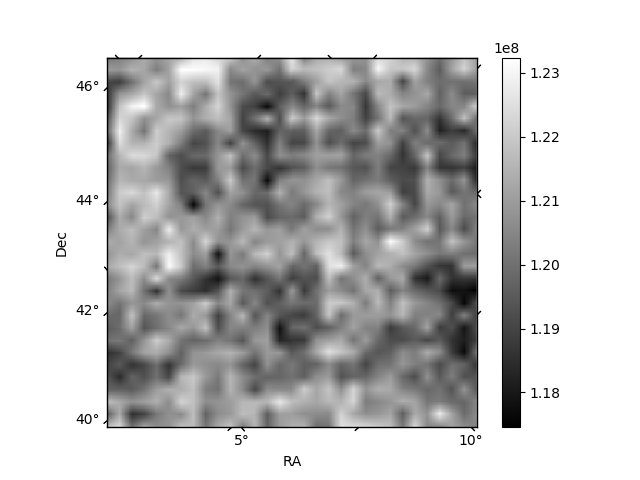
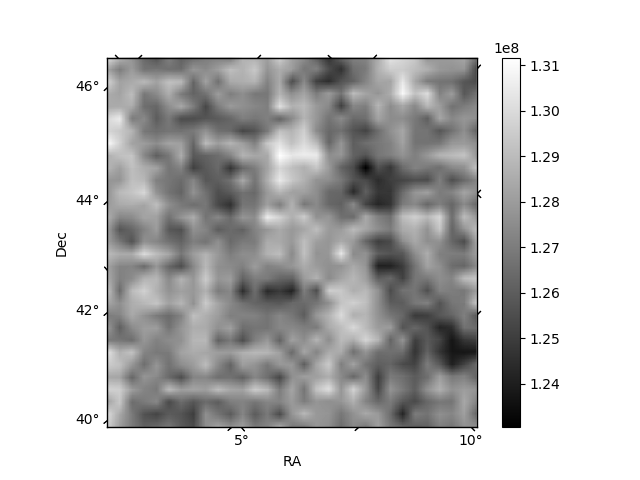
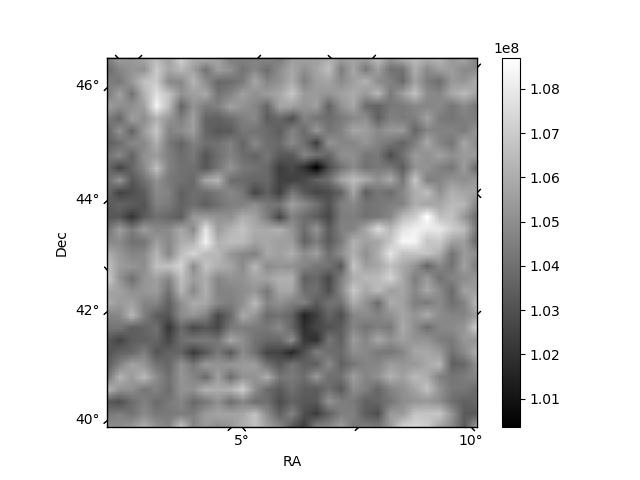
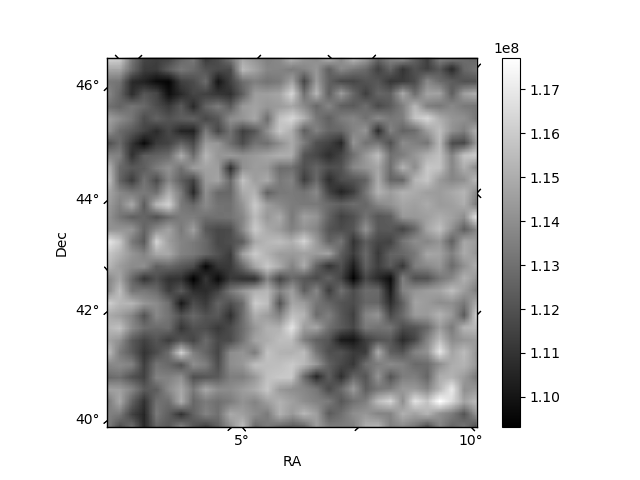
Histogram calculated using DETX and DETY for each event in the final _common_clean file
| Quadrant A | 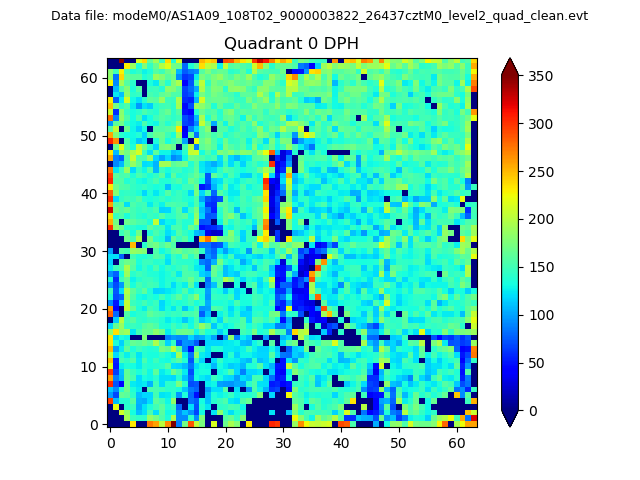 |
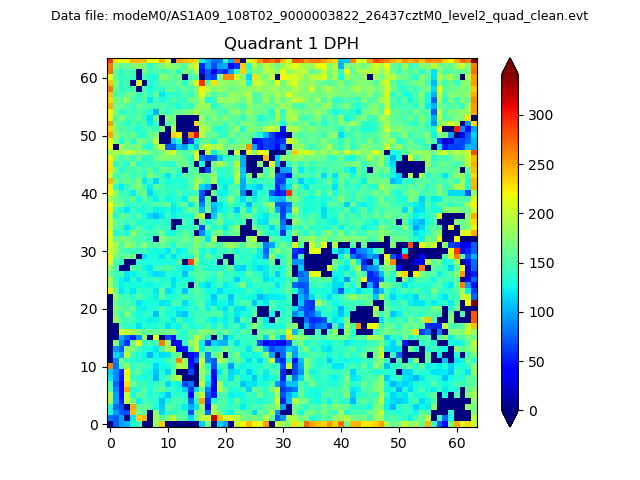 |
Quadrant B |
|---|---|---|---|
| Quadrant D | 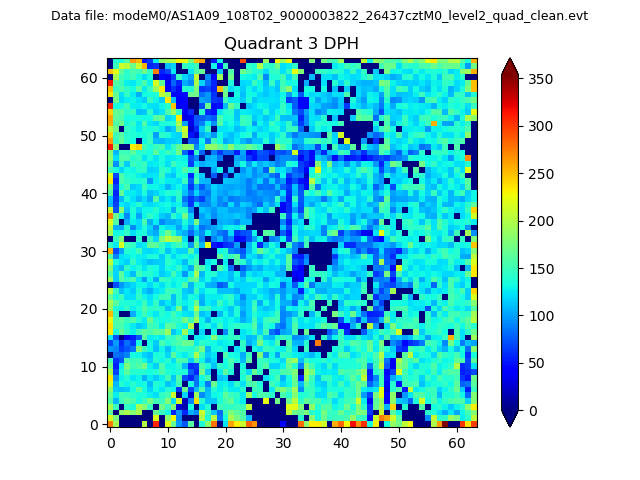 |
 |
Quadrant C |
| Plot type | Count rate plots | Images |
|---|---|---|
| Comparison with Poisson distribution Blue bars denote a histogram of data divided into 1 sec bins. Red curve is a Poisson curve with rate = median count rate of data. |
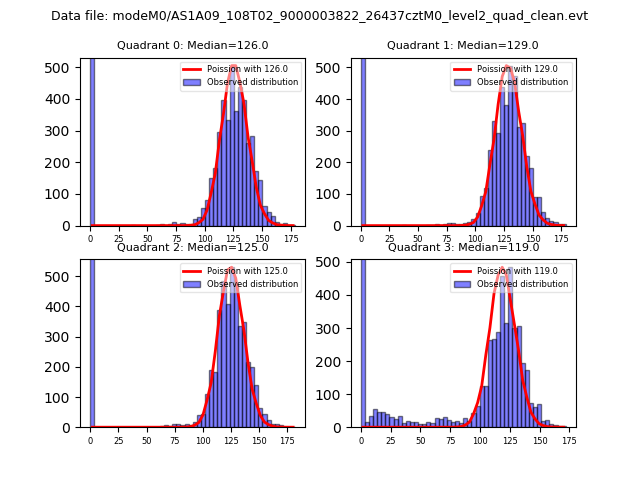 |
 |
| Quadrant-wise count rates Data is divided into 100 sec bins |
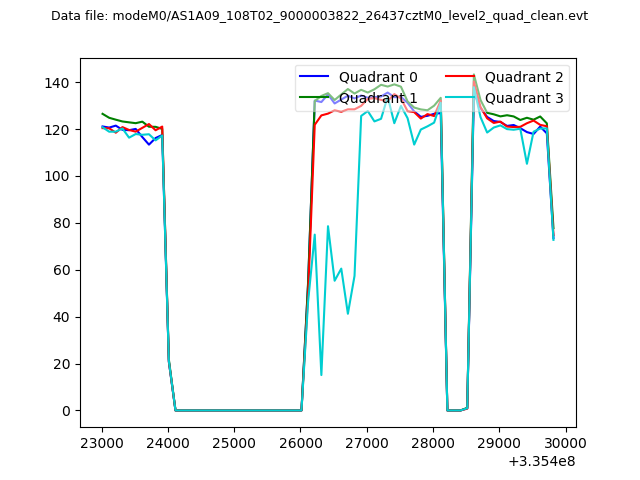 |
|
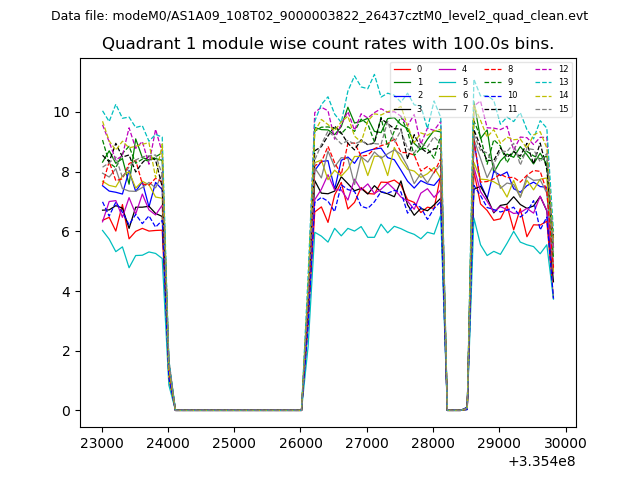
| Module-wise count rates for Quadrant A Data is divided into 100 sec bins |
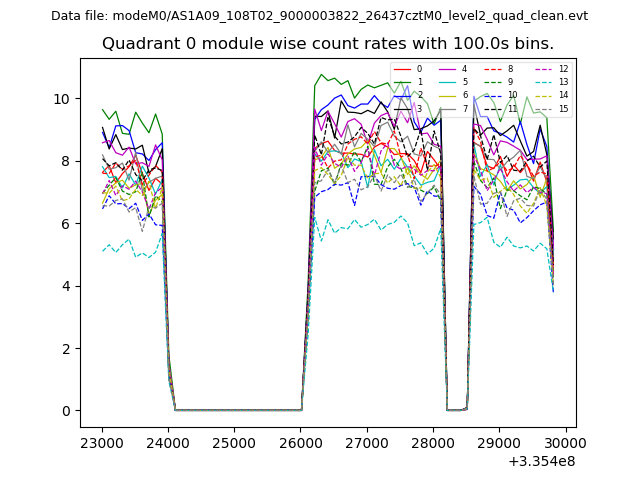 |
 |
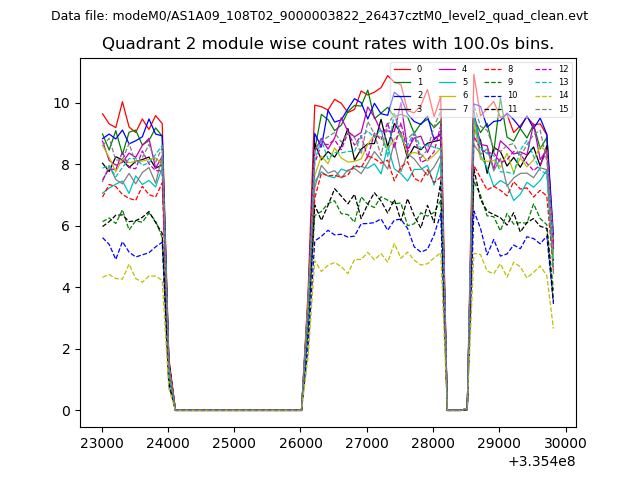
| Module-wise count rates for Quadrant B Data is divided into 100 sec bins |
 |
 |
| Module-wise count rates for Quadrant C Data is divided into 100 sec bins |
 |
 |
| Module-wise count rates for Quadrant D Data is divided into 100 sec bins |
 |
 |
| Parameter | Plot |
|---|---|
| CZT HV Monitor |  |
| D_VDD | 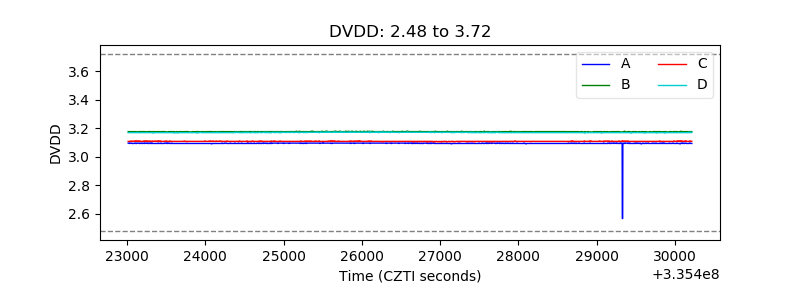 |
| Temperature 1 | 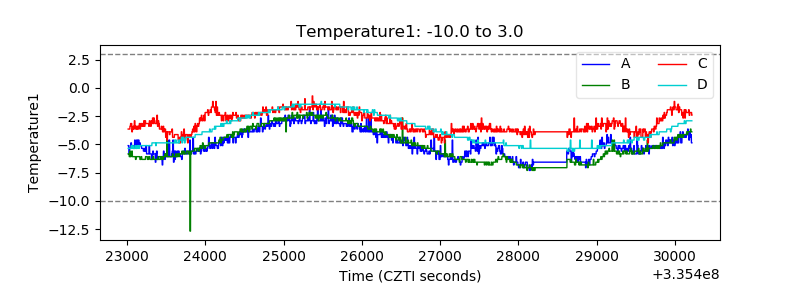 |
| Veto HV Monitor | 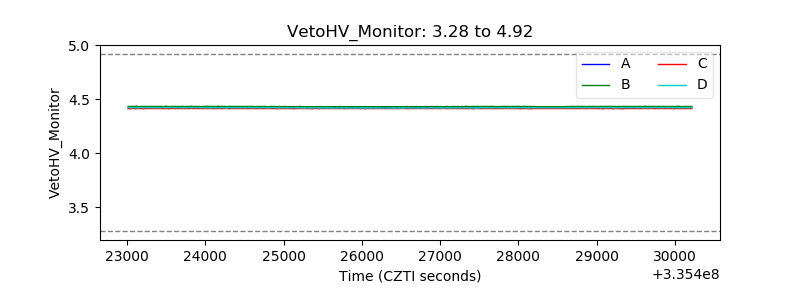 |
| Veto LLD | 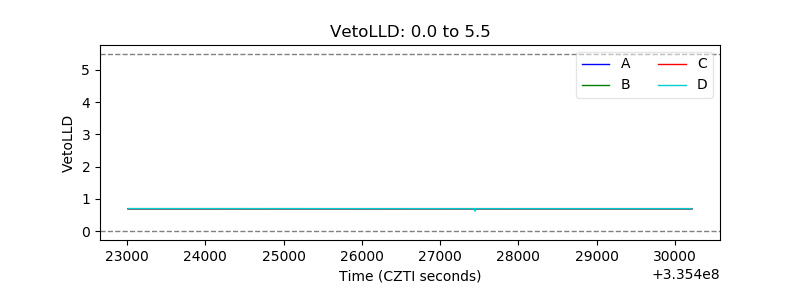 |
| Alpha Counter | 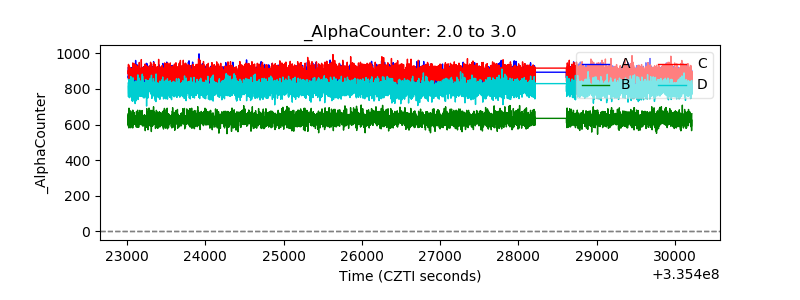 |
| _CPM_Rate | 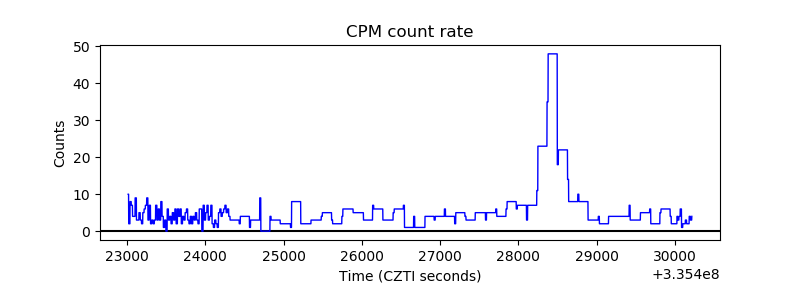 |
| CZT Counter | 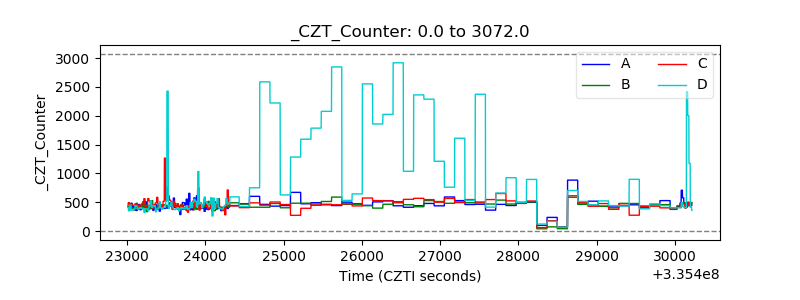 |
| +2.5 Volts monitor | 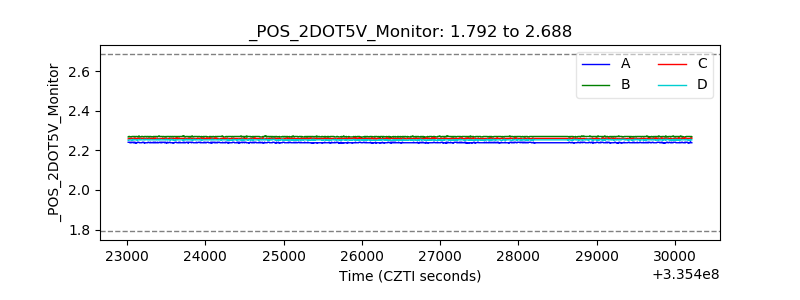 |
| +5 Volts monitor | 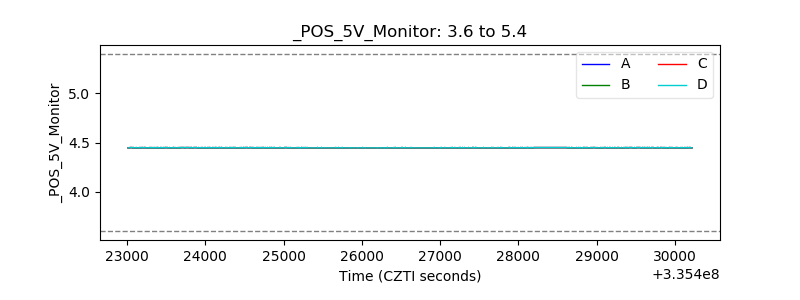 |
| _ROLL_ROT | 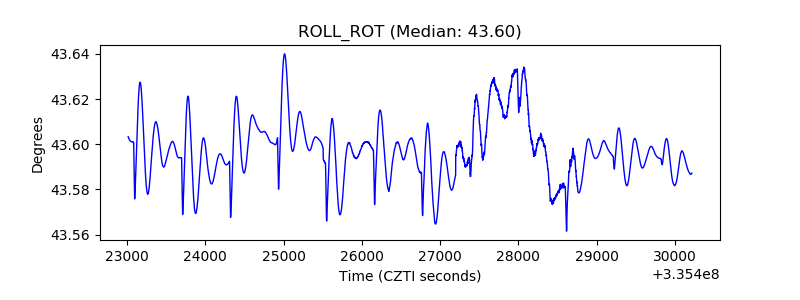 |
| _Roll_DEC | 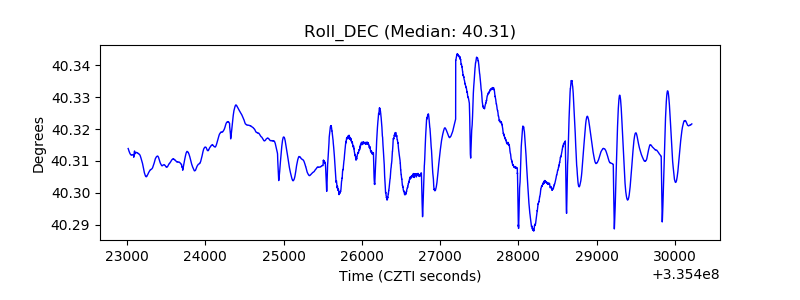 |
| _Roll_RA | 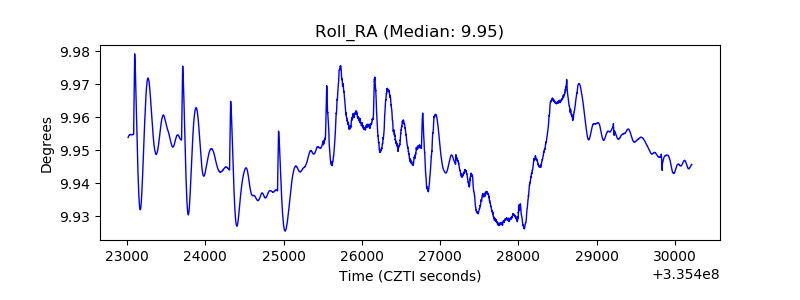 |
| Veto Counter | 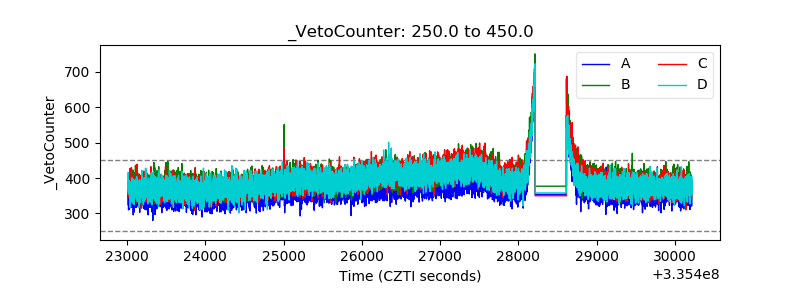 |