| Param | Original file | Final file |
|---|---|---|
| Filename | modeM0/AS1A09_108T02_9000003822_26439cztM0_level2.evt | modeM0/AS1A09_108T02_9000003822_26439cztM0_level2_quad_clean.evt |
| Size (bytes) | 912,490,560 | 135,017,280 |
| Size | 870.2 MB | 128.8 MB |
| Events in quadrant A | 5,805,897 | 828,056 |
| Events in quadrant B | 5,673,690 | 847,690 |
| Events in quadrant C | 6,826,416 | 804,766 |
| Events in quadrant D | 8,522,224 | 783,287 |
| Mode M9 | |||
|---|---|---|---|
| Quadrant | BADHDUFLAG | Total packets | Discarded packets |
| A | 0 | 13 | 0 |
| B | 0 | 13 | 0 |
| C | 0 | 13 | 0 |
| D | 0 | 13 | 0 |
| Mode M0 | |||
|---|---|---|---|
| Quadrant | BADHDUFLAG | Total packets | Discarded packets |
| A | 0 | 24797 | 0 |
| B | 0 | 24208 | 0 |
| C | 0 | 27683 | 0 |
| D | 0 | 33137 | 0 |
| Quadrant | Total seconds | Saturated seconds | Saturation percentage |
|---|---|---|---|
| A | 11919 | 131 | 1.099085% |
| B | 11920 | 98 | 0.822148% |
| C | 11920 | 392 | 3.288591% |
| D | 11920 | 689 | 5.780201% |
Noise dominated data is calculated using 1-second bins in cleaned event files. If a bin has >2000 counts, and if more than 50% of those come from <1% of pixels, then it is considered to be noise-dominated and hence unusable.
| Quadrant | # 1 sec bins | Bins with >0 counts | Bins with >2000 counts | High rate bins dominated by noise | Noise dominated (total time) | Noise dominated (detector-on time) | Marked lightcurve |
|---|---|---|---|---|---|---|---|
| A | 13314 | 11919 | 34 | 34 | 0.26% | 0.29% | 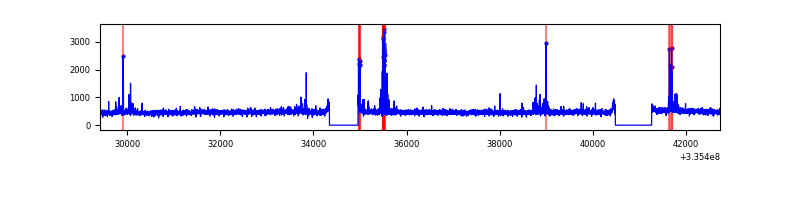 |
| B | 13315 | 11920 | 1 | 1 | 0.01% | 0.01% | 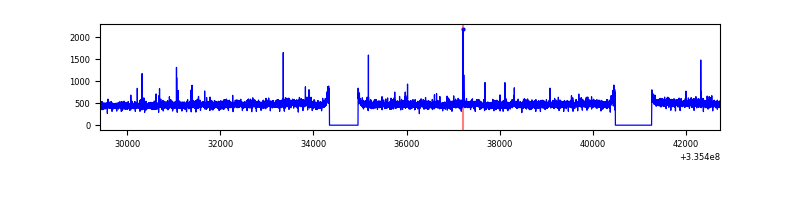 |
| C | 13315 | 11921 | 158 | 158 | 1.19% | 1.33% | 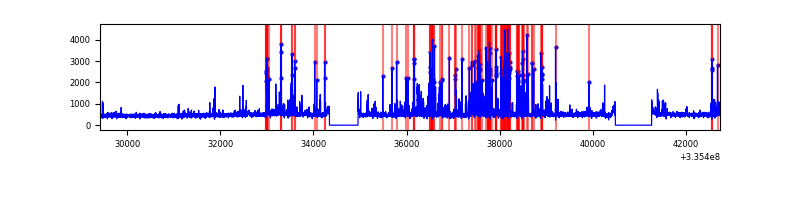 |
| D | 13315 | 11921 | 530 | 530 | 3.98% | 4.45% | 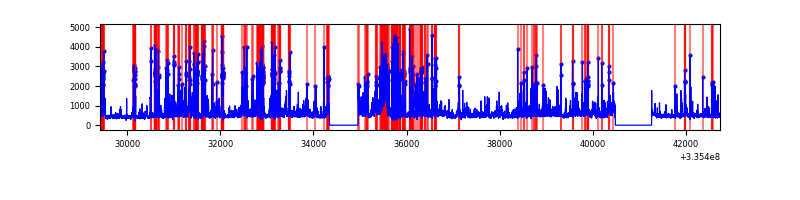 |
Top three noisy pixels from each quadrant. If the there are fewer than three noisy pixels in the level2.evt file, extra rows are filled as -1
| Pixel properties | Quadrant properties | ||||||
|---|---|---|---|---|---|---|---|
| Quadrant | DetID | PixID | Counts | Sigma | Mean | Median | Sigma |
| A | 0 | 13 | 252428 | 872.38 | 1435 | 1407 | 287.7 |
| A | 13 | 254 | 17198 | 54.88 | 1435 | 1407 | 287.7 |
| A | 3 | 137 | 13822 | 43.14 | 1435 | 1407 | 287.7 |
| B | 12 | 111 | 34538 | 119.59 | 1430 | 1390 | 277.2 |
| B | 11 | 111 | 31154 | 107.38 | 1430 | 1390 | 277.2 |
| B | 14 | 111 | 27715 | 94.98 | 1430 | 1390 | 277.2 |
| C | 4 | 254 | 1055128 | 3329.99 | 1364 | 1371 | 316.4 |
| C | 14 | 238 | 216850 | 680.94 | 1364 | 1371 | 316.4 |
| C | 3 | 233 | 165696 | 519.28 | 1364 | 1371 | 316.4 |
| D | 1 | 52 | 1230220 | 3778.47 | 1361 | 1325 | 325.2 |
| D | 11 | 176 | 1034002 | 3175.16 | 1361 | 1325 | 325.2 |
| D | 7 | 80 | 882988 | 2710.84 | 1361 | 1325 | 325.2 |
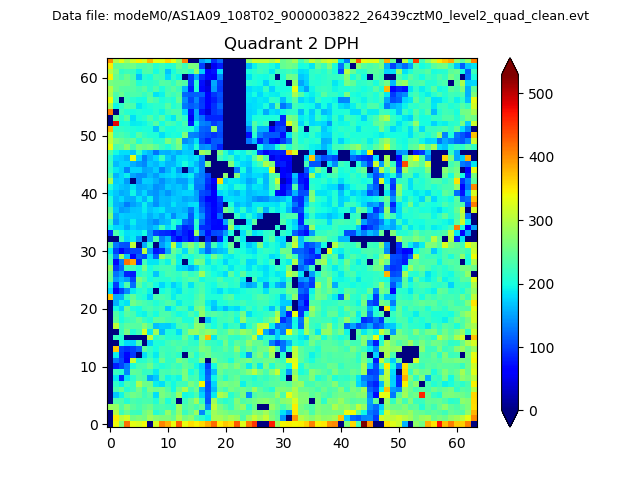
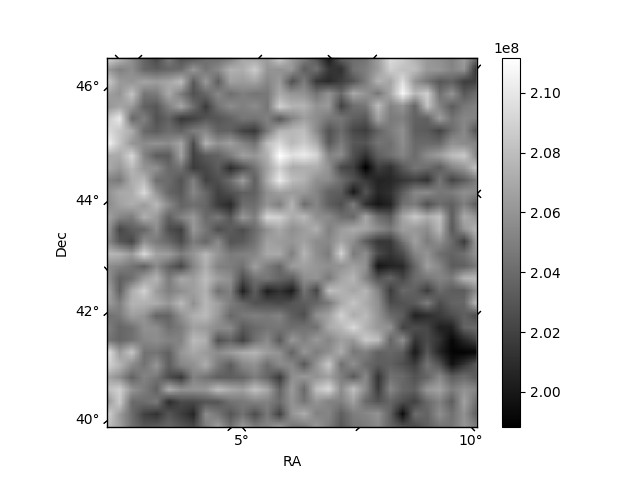
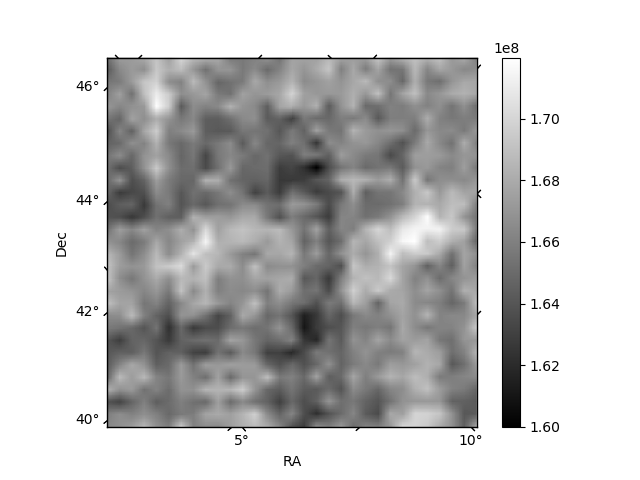
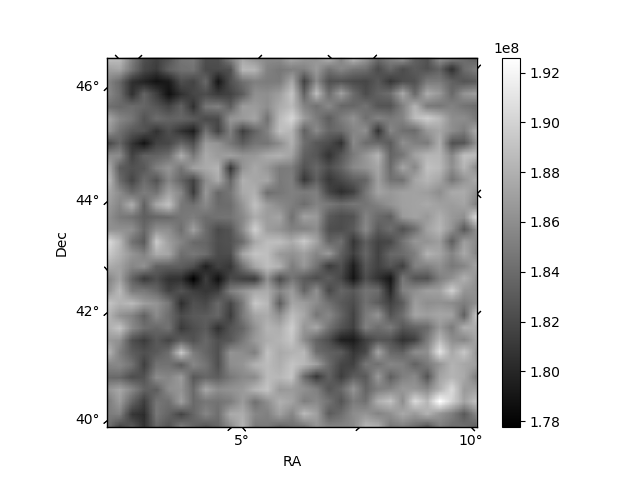
Histogram calculated using DETX and DETY for each event in the final _common_clean file
| Quadrant A | 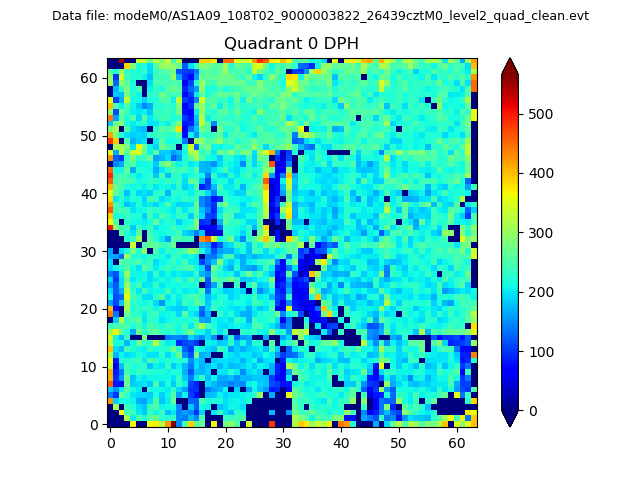 |
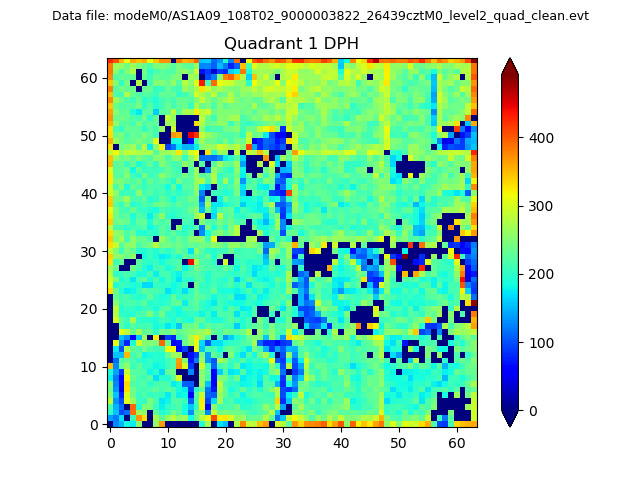 |
Quadrant B |
|---|---|---|---|
| Quadrant D | 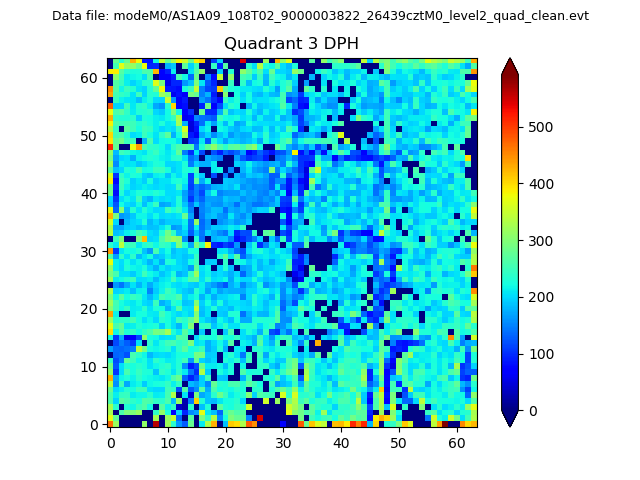 |
 |
Quadrant C |
| Plot type | Count rate plots | Images |
|---|---|---|
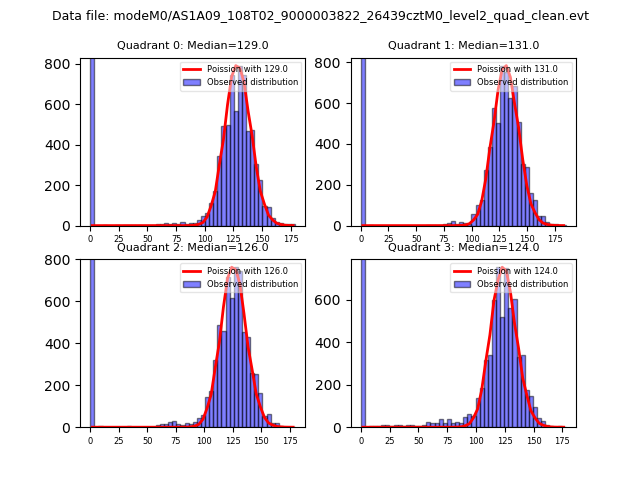
| Comparison with Poisson distribution Blue bars denote a histogram of data divided into 1 sec bins. Red curve is a Poisson curve with rate = median count rate of data. |
 |
 |
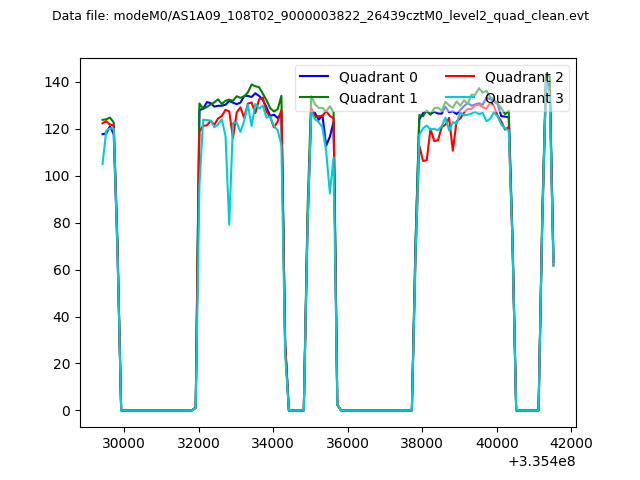
| Quadrant-wise count rates Data is divided into 100 sec bins |
 |
|
| Module-wise count rates for Quadrant A Data is divided into 100 sec bins |
 |
 |
| Module-wise count rates for Quadrant B Data is divided into 100 sec bins |
 |
 |
| Module-wise count rates for Quadrant C Data is divided into 100 sec bins |
 |
 |
| Module-wise count rates for Quadrant D Data is divided into 100 sec bins |
 |
 |
| Parameter | Plot |
|---|---|
| CZT HV Monitor | 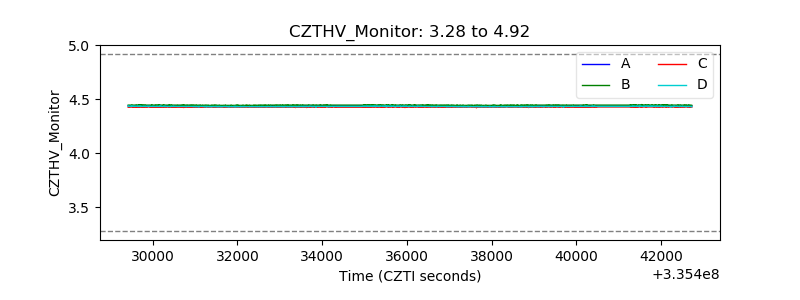 |
| D_VDD | 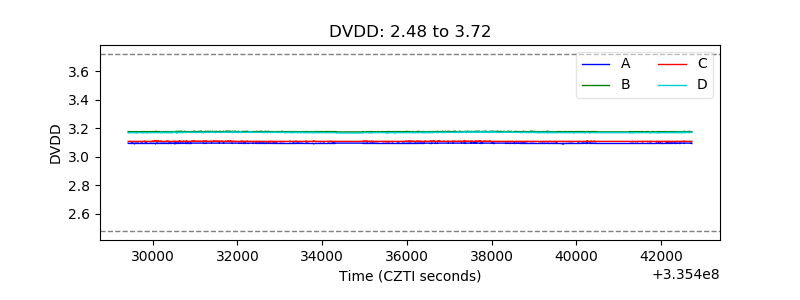 |
| Temperature 1 | 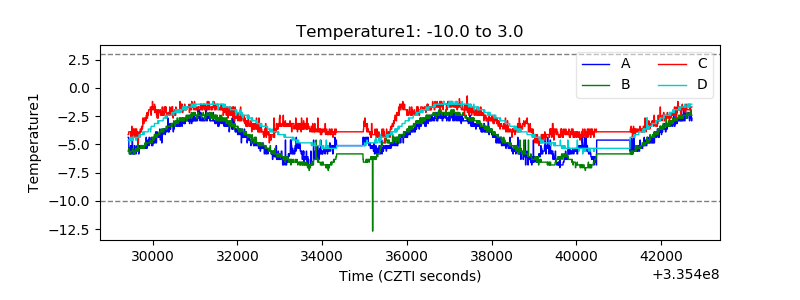 |
| Veto HV Monitor | 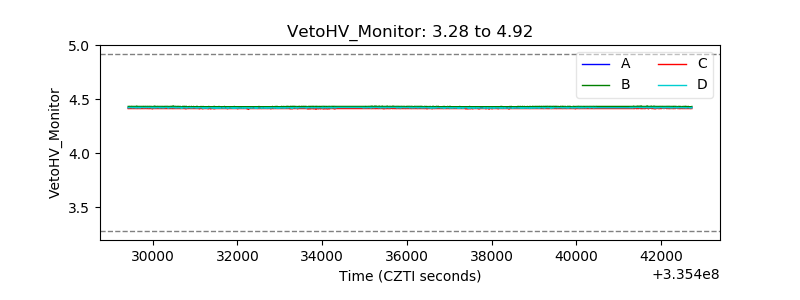 |
| Veto LLD | 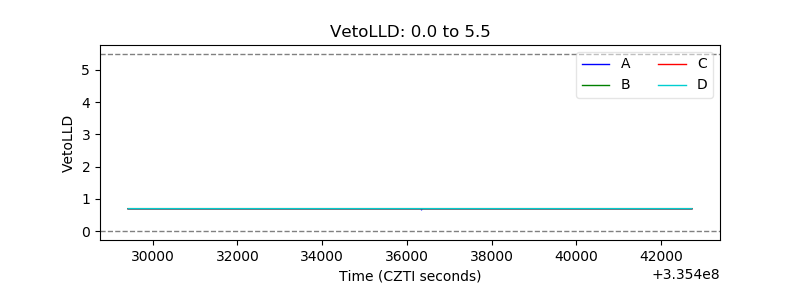 |
| Alpha Counter | 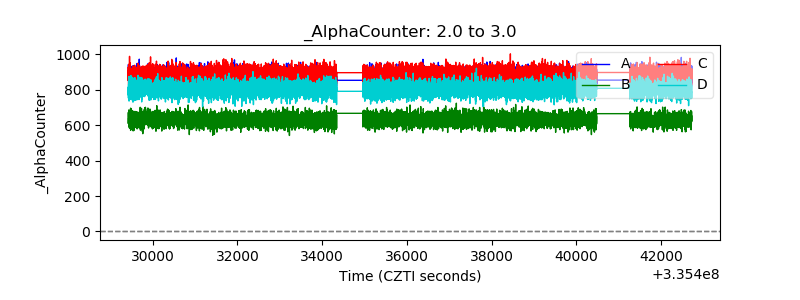 |
| _CPM_Rate | 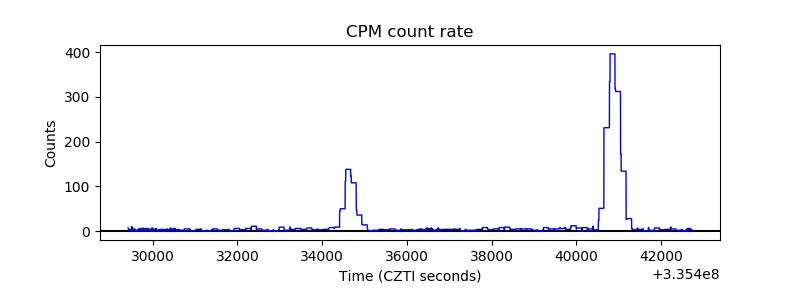 |
| CZT Counter | 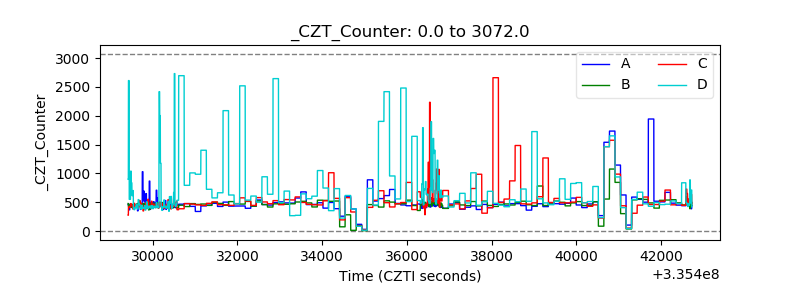 |
| +2.5 Volts monitor | 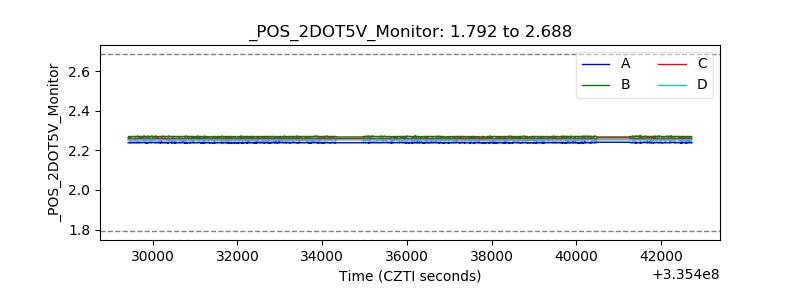 |
| +5 Volts monitor |  |
| _ROLL_ROT |  |
| _Roll_DEC | 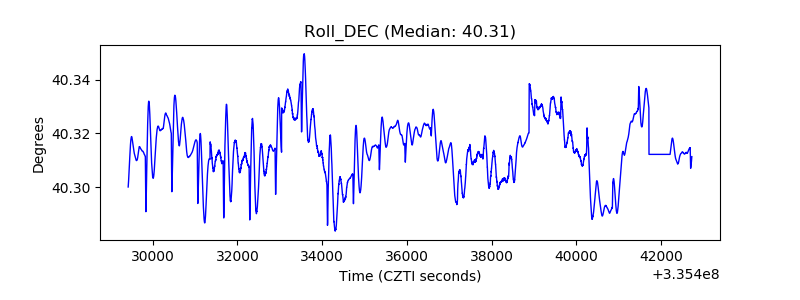 |
| _Roll_RA | 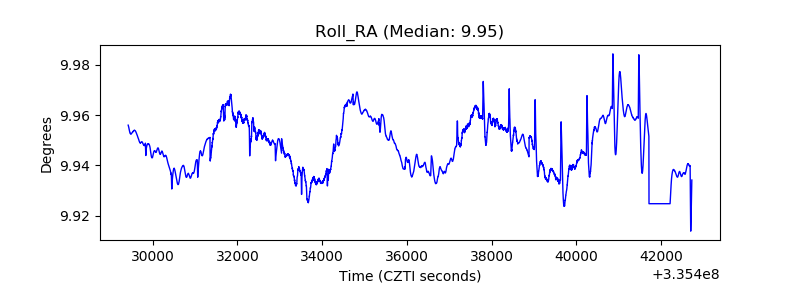 |
| Veto Counter |  |