| Param | Original file | Final file |
|---|---|---|
| Filename | modeM0/AS1A09_108T02_9000003822_26440cztM0_level2.evt | modeM0/AS1A09_108T02_9000003822_26440cztM0_level2_quad_clean.evt |
| Size (bytes) | 238,852,800 | 29,479,680 |
| Size | 227.8 MB | 28.1 MB |
| Events in quadrant A | 1,672,399 | 165,870 |
| Events in quadrant B | 1,672,699 | 168,121 |
| Events in quadrant C | 1,841,931 | 157,325 |
| Events in quadrant D | 1,812,395 | 158,117 |
| Mode M9 | |||
|---|---|---|---|
| Quadrant | BADHDUFLAG | Total packets | Discarded packets |
| A | 0 | 5 | 0 |
| B | 0 | 6 | 0 |
| C | 0 | 6 | 0 |
| D | 0 | 6 | 0 |
| Mode M0 | |||
|---|---|---|---|
| Quadrant | BADHDUFLAG | Total packets | Discarded packets |
| A | 0 | 7075 | 0 |
| B | 0 | 7018 | 0 |
| C | 0 | 7547 | 0 |
| D | 0 | 7577 | 0 |
| Quadrant | Total seconds | Saturated seconds | Saturation percentage |
|---|---|---|---|
| A | 3416 | 12 | 0.351288% |
| B | 3416 | 4 | 0.117096% |
| C | 3416 | 45 | 1.317330% |
| D | 3416 | 25 | 0.731850% |
Noise dominated data is calculated using 1-second bins in cleaned event files. If a bin has >2000 counts, and if more than 50% of those come from <1% of pixels, then it is considered to be noise-dominated and hence unusable.
| Quadrant | # 1 sec bins | Bins with >0 counts | Bins with >2000 counts | High rate bins dominated by noise | Noise dominated (total time) | Noise dominated (detector-on time) | Marked lightcurve |
|---|---|---|---|---|---|---|---|
| A | 3416 | 3416 | 4 | 4 | 0.12% | 0.12% | 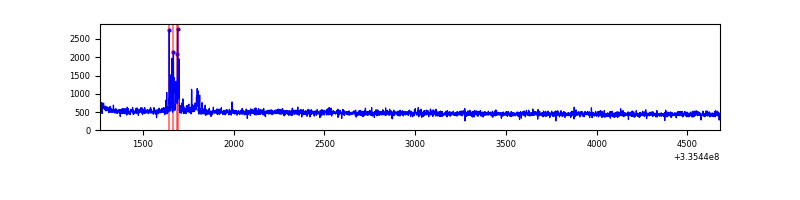 |
| B | 3416 | 3416 | 0 | 0 | 0.00% | 0.00% | 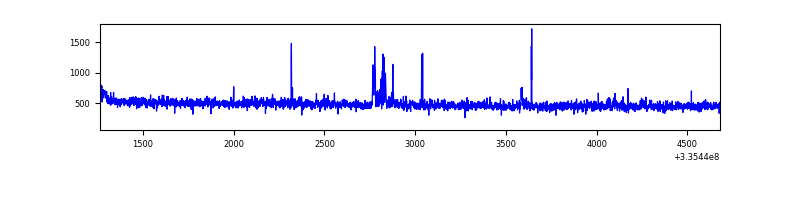 |
| C | 3416 | 3416 | 17 | 17 | 0.50% | 0.50% |  |
| D | 3416 | 3416 | 20 | 20 | 0.59% | 0.59% | 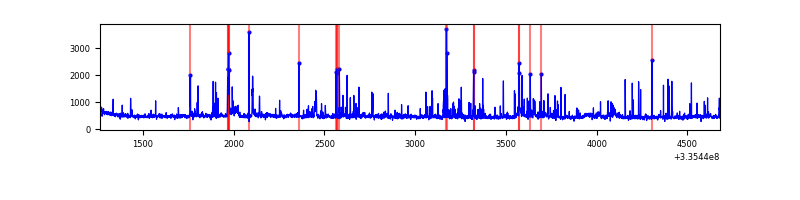 |
Top three noisy pixels from each quadrant. If the there are fewer than three noisy pixels in the level2.evt file, extra rows are filled as -1
| Pixel properties | Quadrant properties | ||||||
|---|---|---|---|---|---|---|---|
| Quadrant | DetID | PixID | Counts | Sigma | Mean | Median | Sigma |
| A | 0 | 13 | 52524 | 613.8 | 419 | 410 | 84.9 |
| A | 13 | 254 | 5144 | 55.76 | 419 | 410 | 84.9 |
| A | 12 | 189 | 4271 | 45.48 | 419 | 410 | 84.9 |
| B | 0 | 190 | 25102 | 304.44 | 413 | 402 | 81.1 |
| B | 0 | 229 | 18121 | 218.4 | 413 | 402 | 81.1 |
| B | 12 | 111 | 9897 | 117.03 | 413 | 402 | 81.1 |
| C | 4 | 254 | 124118 | 1329.61 | 394 | 396 | 93.1 |
| C | 14 | 176 | 85409 | 913.62 | 394 | 396 | 93.1 |
| C | 14 | 238 | 64431 | 688.17 | 394 | 396 | 93.1 |
| D | 11 | 176 | 104645 | 1062.36 | 404 | 395 | 98.1 |
| D | 1 | 52 | 88770 | 900.58 | 404 | 395 | 98.1 |
| D | 14 | 35 | 32374 | 325.88 | 404 | 395 | 98.1 |
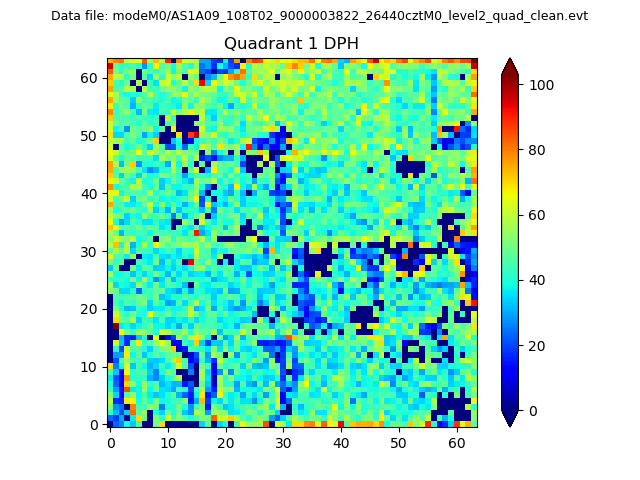
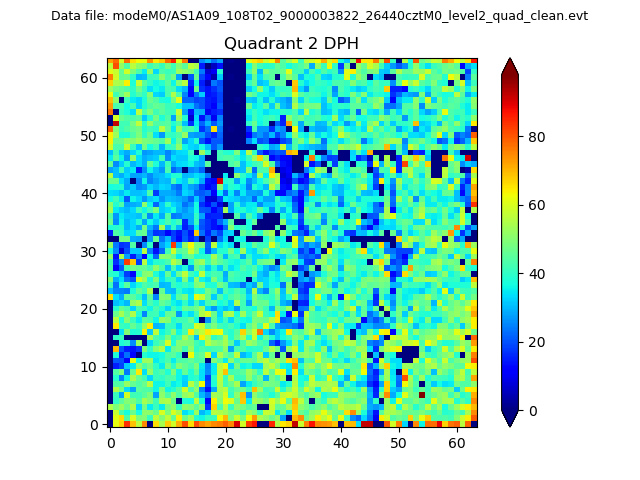
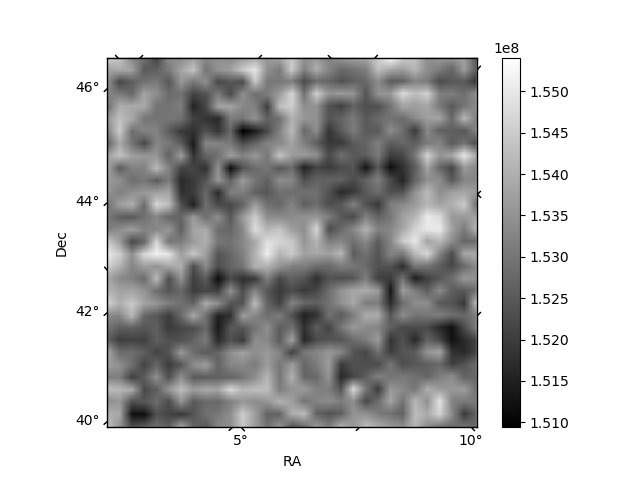
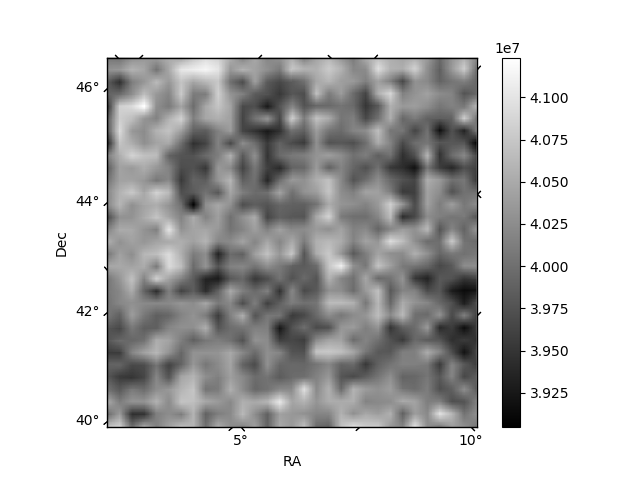
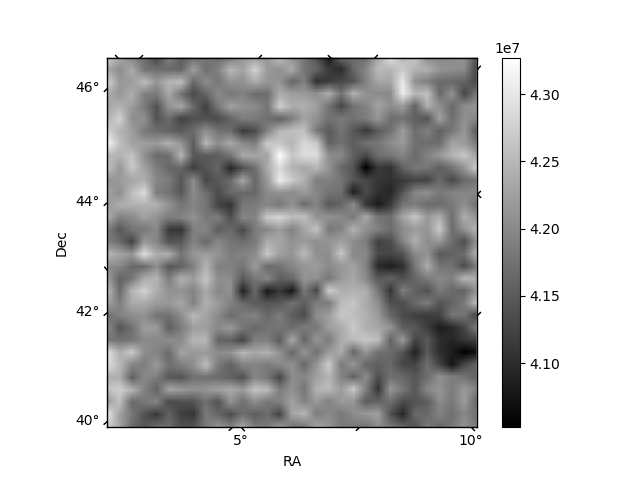
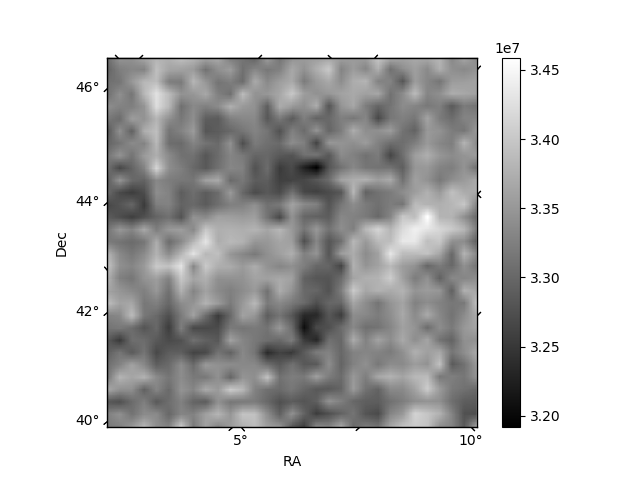
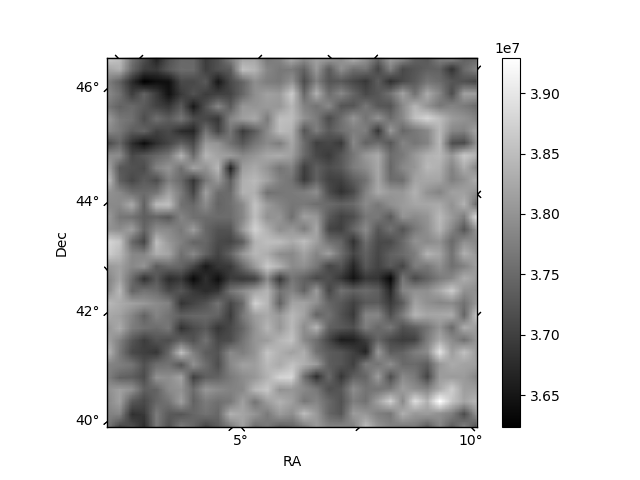
Histogram calculated using DETX and DETY for each event in the final _common_clean file
| Quadrant A | 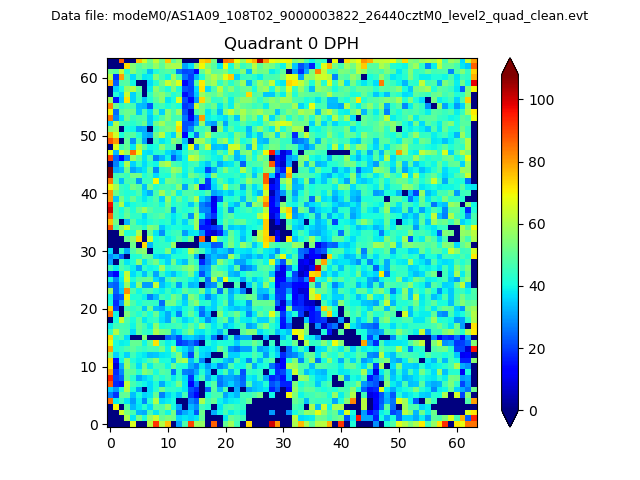 |
 |
Quadrant B |
|---|---|---|---|
| Quadrant D | 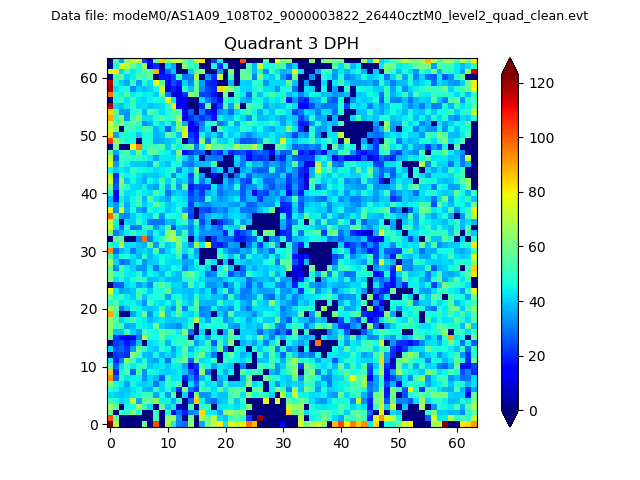 |
 |
Quadrant C |
| Plot type | Count rate plots | Images |
|---|---|---|
| Comparison with Poisson distribution Blue bars denote a histogram of data divided into 1 sec bins. Red curve is a Poisson curve with rate = median count rate of data. |
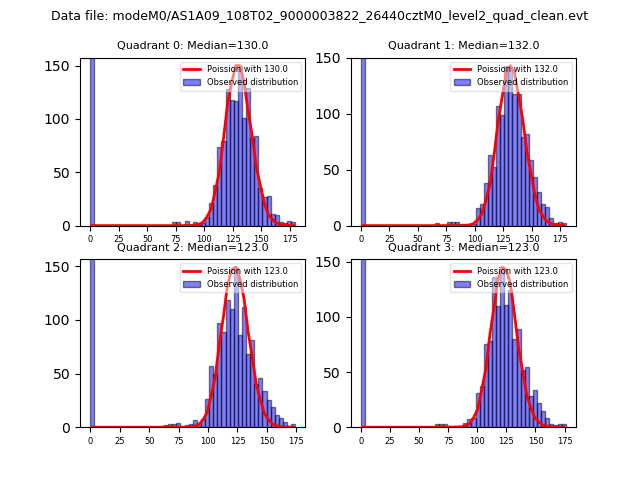 |
 |
| Quadrant-wise count rates Data is divided into 100 sec bins |
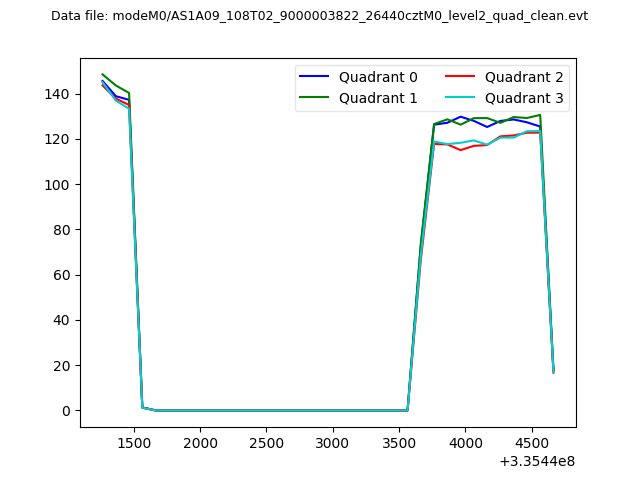 |
|
| Module-wise count rates for Quadrant A Data is divided into 100 sec bins |
 |
 |
| Module-wise count rates for Quadrant B Data is divided into 100 sec bins |
 |
 |
| Module-wise count rates for Quadrant C Data is divided into 100 sec bins |
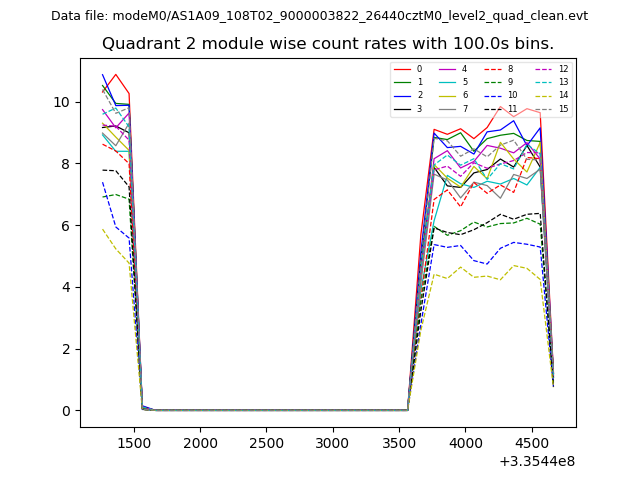 |
 |
| Module-wise count rates for Quadrant D Data is divided into 100 sec bins |
 |
 |
| Parameter | Plot |
|---|---|
| CZT HV Monitor | 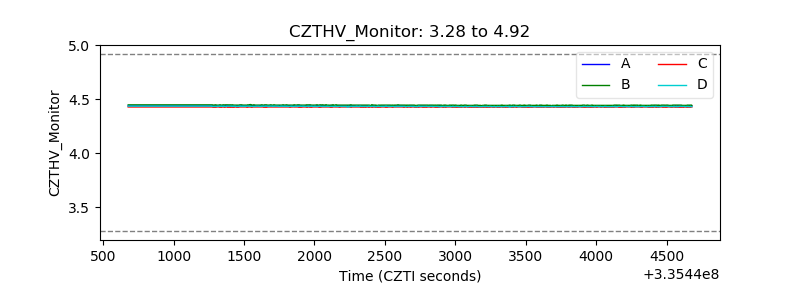 |
| D_VDD | 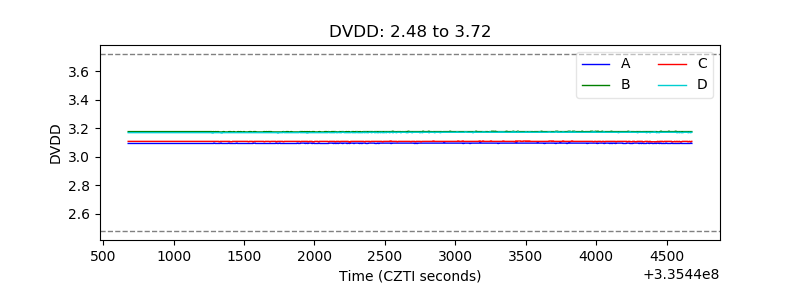 |
| Temperature 1 | 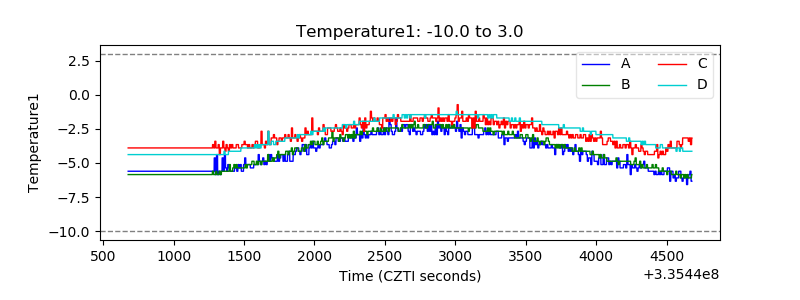 |
| Veto HV Monitor | 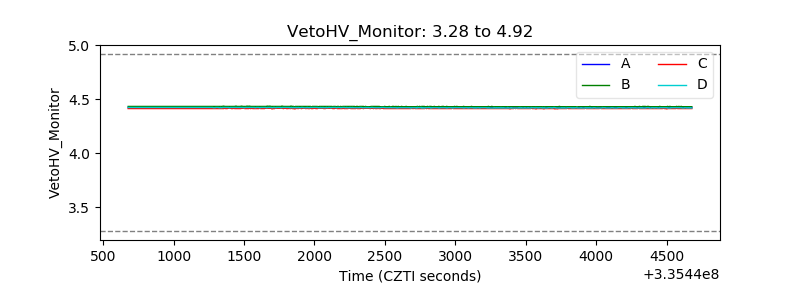 |
| Veto LLD |  |
| Alpha Counter | 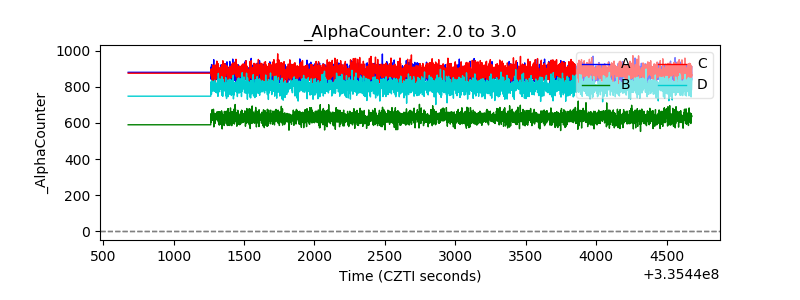 |
| _CPM_Rate | 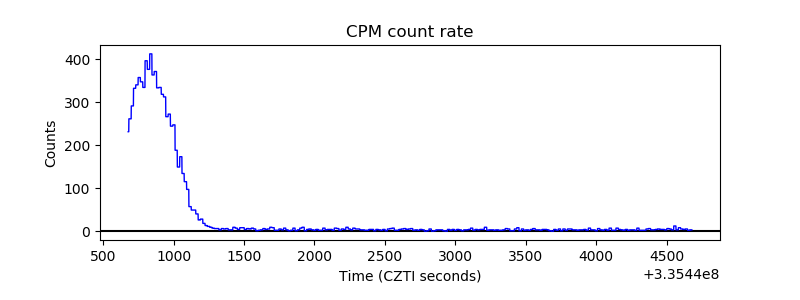 |
| CZT Counter | 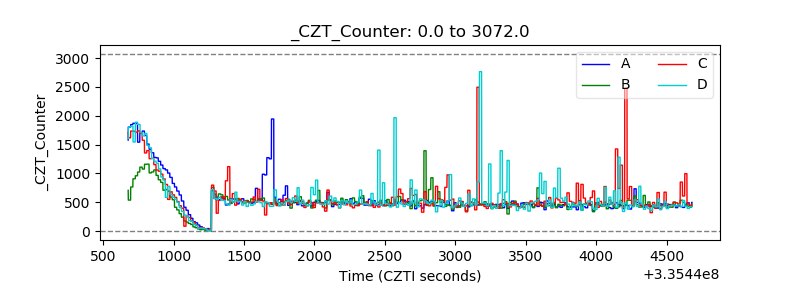 |
| +2.5 Volts monitor |  |
| +5 Volts monitor |  |
| _ROLL_ROT | 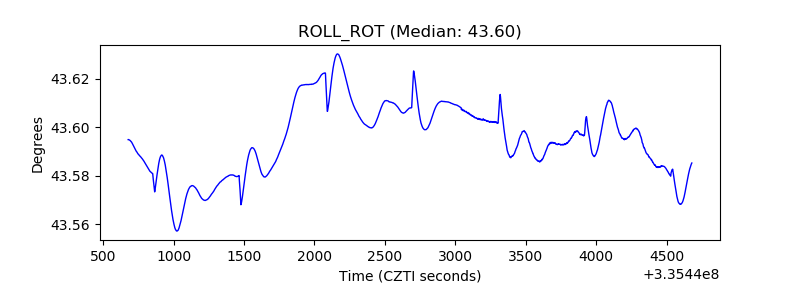 |
| _Roll_DEC | 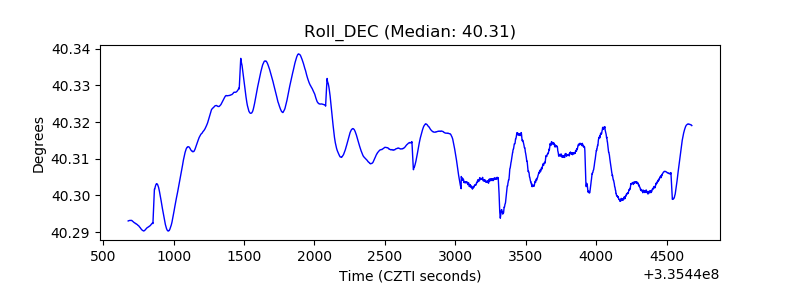 |
| _Roll_RA |  |
| Veto Counter |  |