| Param | Original file | Final file |
|---|---|---|
| Filename | modeM0/AS1A09_056T01_9000003824cztM0_level2.fits | modeM0/AS1A09_056T01_9000003824cztM0_level2_quad_clean.evt |
| Size (bytes) | 401,088,960 | 230,330,880 |
| Size | 382.5 MB | 219.7 MB |
| Events in quadrant A | 2,534,695 | 1,141,885 |
| Events in quadrant B | 2,421,184 | 1,138,452 |
| Events in quadrant C | 2,468,722 | 1,090,724 |
| Events in quadrant D | 2,096,422 | 977,446 |
| Mode SS | |||
|---|---|---|---|
| Quadrant | BADHDUFLAG | Total packets | Discarded packets |
| A | 0 | 772 | 0 |
| B | 0 | 786 | 0 |
| C | 0 | 784 | 0 |
| D | 0 | 788 | 0 |
| Mode M9 | |||
|---|---|---|---|
| Quadrant | BADHDUFLAG | Total packets | Discarded packets |
| A | 0 | 96 | 0 |
| B | 0 | 96 | 0 |
| C | 0 | 108 | 0 |
| D | 0 | 98 | 0 |
| Mode M0 | |||
|---|---|---|---|
| Quadrant | BADHDUFLAG | Total packets | Discarded packets |
| A | 0 | 82899 | 0 |
| B | 0 | 83793 | 0 |
| C | 0 | 88853 | 0 |
| D | 0 | 105061 | 0 |
| Quadrant | Total seconds | Saturated seconds | Saturation percentage |
|---|---|---|---|
| A | 38370 | 392 | 1.021631% |
| B | 38126 | 448 | 1.175051% |
| C | 38374 | 1020 | 2.658050% |
| D | 37951 | 2373 | 6.252800% |
Noise dominated data is calculated using 1-second bins in cleaned event files. If a bin has >2000 counts, and if more than 50% of those come from <1% of pixels, then it is considered to be noise-dominated and hence unusable.
| Quadrant | # 1 sec bins | Bins with >0 counts | Bins with >2000 counts | High rate bins dominated by noise | Noise dominated (total time) | Noise dominated (detector-on time) | Marked lightcurve |
|---|---|---|---|---|---|---|---|
| A | 52289 | 38278 | 0 | 0 | 0.00% | 0.00% |  |
| B | 52289 | 38072 | 0 | 0 | 0.00% | 0.00% |  |
| C | 52289 | 38286 | 0 | 0 | 0.00% | 0.00% |  |
| D | 52289 | 37896 | 0 | 0 | 0.00% | 0.00% |  |
Top three noisy pixels from each quadrant. If the there are fewer than three noisy pixels in the level2.evt file, extra rows are filled as -1
| Pixel properties | Quadrant properties | ||||||
|---|---|---|---|---|---|---|---|
| Quadrant | DetID | PixID | Counts | Sigma | Mean | Median | Sigma |
| A | 0 | 29 | 2135 | 9.31 | 662 | 625 | 162.2 |
| A | 7 | 110 | 1959 | 8.23 | 662 | 625 | 162.2 |
| A | 0 | 30 | 1889 | 7.79 | 662 | 625 | 162.2 |
| B | 2 | 9 | 1842 | 9.71 | 641 | 615 | 126.4 |
| B | 5 | 128 | 1602 | 7.81 | 641 | 615 | 126.4 |
| B | 2 | 8 | 1576 | 7.6 | 641 | 615 | 126.4 |
| C | 1 | 81 | 1932 | 7.95 | 653 | 617 | 165.3 |
| C | 1 | 80 | 1906 | 7.8 | 653 | 617 | 165.3 |
| C | 3 | 126 | 1703 | 6.57 | 653 | 617 | 165.3 |
| D | 10 | 189 | 1544 | 6.3 | 598 | 548 | 158.1 |
| D | 3 | 14 | 1532 | 6.22 | 598 | 548 | 158.1 |
| D | 15 | 46 | 1473 | 5.85 | 598 | 548 | 158.1 |
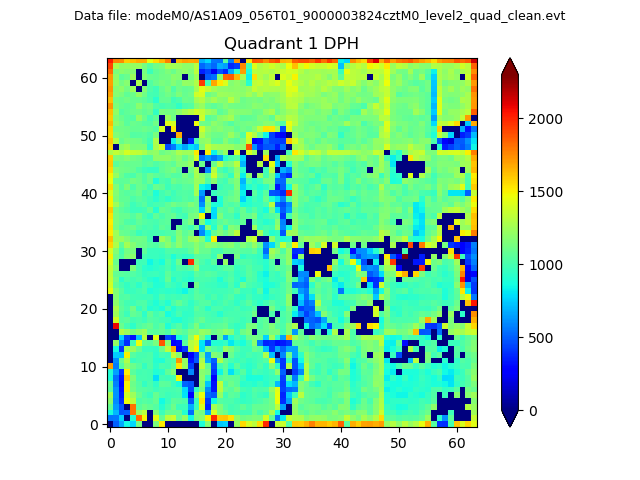
Histogram calculated using DETX and DETY for each event in the final _common_clean file
| Quadrant A |  |
 |
Quadrant B |
|---|---|---|---|
| Quadrant D | 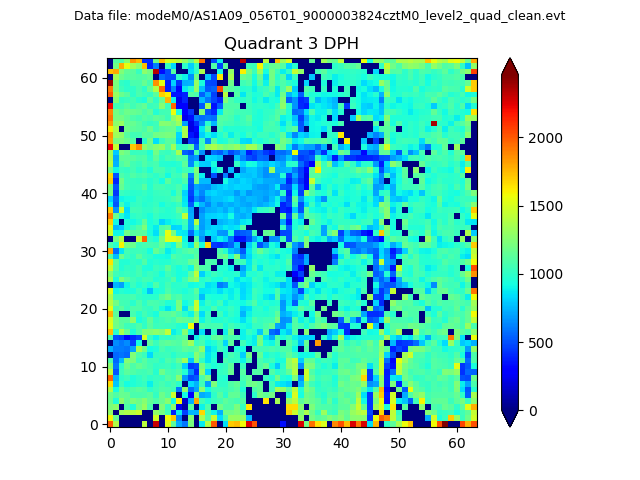 |
 |
Quadrant C |
| Plot type | Count rate plots | Images |
|---|---|---|
| Comparison with Poisson distribution Blue bars denote a histogram of data divided into 1 sec bins. Red curve is a Poisson curve with rate = median count rate of data. |
 |
 |
| Quadrant-wise count rates Data is divided into 100 sec bins |
 |
|
| Module-wise count rates for Quadrant A Data is divided into 100 sec bins |
 |
 |
| Module-wise count rates for Quadrant B Data is divided into 100 sec bins |
 |
 |
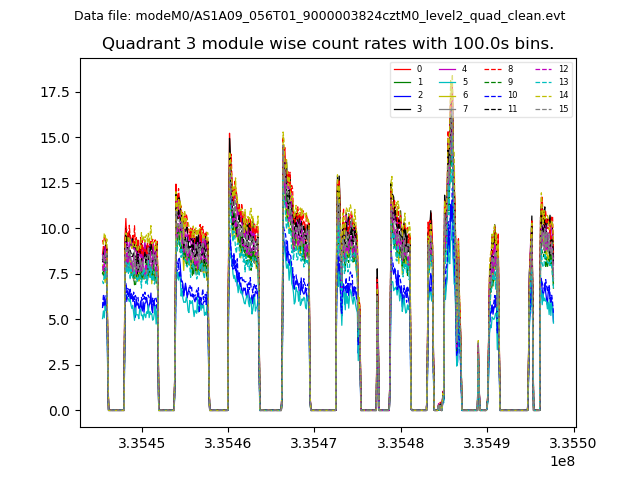
| Module-wise count rates for Quadrant C Data is divided into 100 sec bins |
 |
 |
| Module-wise count rates for Quadrant D Data is divided into 100 sec bins |
 |
 |
| Parameter | Plot |
|---|---|
| CZT HV Monitor |  |
| D_VDD |  |
| Temperature 1 |  |
| Veto HV Monitor |  |
| Veto LLD |  |
| Alpha Counter |  |
| _CPM_Rate |  |
| CZT Counter |  |
| +2.5 Volts monitor |  |
| +5 Volts monitor |  |
| _ROLL_ROT |  |
| _Roll_DEC | 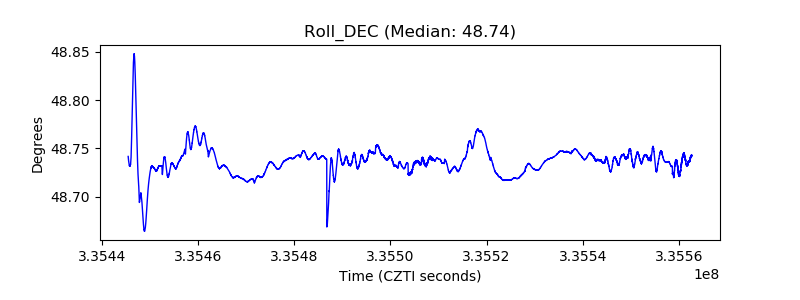 |
| _Roll_RA |  |
| Veto Counter |  |