| Param | Original file | Final file |
|---|---|---|
| Filename | modeM0/AS1A09_056T01_9000003824_26441cztM0_level2.evt | modeM0/AS1A09_056T01_9000003824_26441cztM0_level2_quad_clean.evt |
| Size (bytes) | 501,488,640 | 108,440,640 |
| Size | 478.3 MB | 103.4 MB |
| Events in quadrant A | 3,292,651 | 726,379 |
| Events in quadrant B | 3,326,747 | 735,679 |
| Events in quadrant C | 3,985,618 | 686,280 |
| Events in quadrant D | 4,138,843 | 679,844 |
| Mode M9 | |||
|---|---|---|---|
| Quadrant | BADHDUFLAG | Total packets | Discarded packets |
| A | 0 | 11 | 0 |
| B | 0 | 11 | 0 |
| C | 0 | 11 | 0 |
| D | 0 | 11 | 0 |
| Mode M0 | |||
|---|---|---|---|
| Quadrant | BADHDUFLAG | Total packets | Discarded packets |
| A | 0 | 14148 | 0 |
| B | 0 | 14169 | 0 |
| C | 0 | 16113 | 0 |
| D | 0 | 16666 | 0 |
| Quadrant | Total seconds | Saturated seconds | Saturation percentage |
|---|---|---|---|
| A | 6542 | 71 | 1.085295% |
| B | 6542 | 77 | 1.177010% |
| C | 6542 | 206 | 3.148884% |
| D | 6542 | 223 | 3.408744% |
Noise dominated data is calculated using 1-second bins in cleaned event files. If a bin has >2000 counts, and if more than 50% of those come from <1% of pixels, then it is considered to be noise-dominated and hence unusable.
| Quadrant | # 1 sec bins | Bins with >0 counts | Bins with >2000 counts | High rate bins dominated by noise | Noise dominated (total time) | Noise dominated (detector-on time) | Marked lightcurve |
|---|---|---|---|---|---|---|---|
| A | 7607 | 6542 | 0 | 0 | 0.00% | 0.00% | 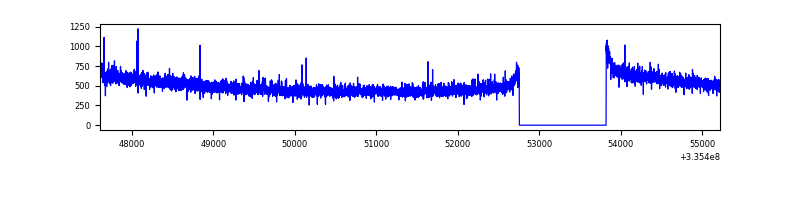 |
| B | 7607 | 6543 | 0 | 0 | 0.00% | 0.00% | 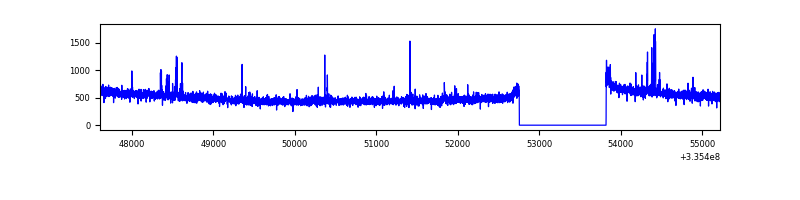 |
| C | 7607 | 6542 | 74 | 74 | 0.97% | 1.13% | 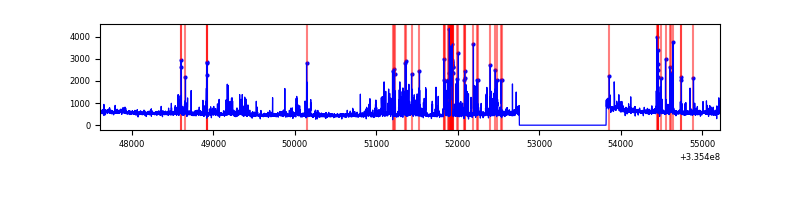 |
| D | 7607 | 6542 | 118 | 118 | 1.55% | 1.80% | 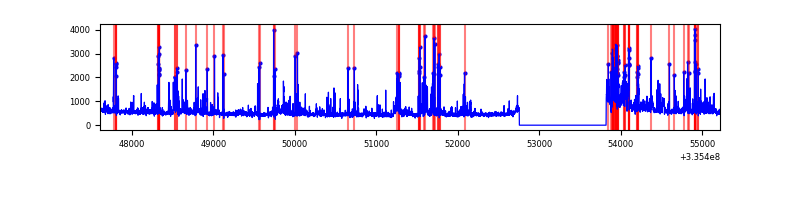 |
Top three noisy pixels from each quadrant. If the there are fewer than three noisy pixels in the level2.evt file, extra rows are filled as -1
| Pixel properties | Quadrant properties | ||||||
|---|---|---|---|---|---|---|---|
| Quadrant | DetID | PixID | Counts | Sigma | Mean | Median | Sigma |
| A | 12 | 16 | 25146 | 145.21 | 843 | 825 | 167.5 |
| A | 12 | 189 | 11515 | 63.82 | 843 | 825 | 167.5 |
| A | 12 | 194 | 9917 | 54.28 | 843 | 825 | 167.5 |
| B | 0 | 190 | 53010 | 333.69 | 830 | 808 | 156.4 |
| B | 12 | 111 | 18830 | 115.2 | 830 | 808 | 156.4 |
| B | 11 | 111 | 17003 | 103.52 | 830 | 808 | 156.4 |
| C | 4 | 254 | 650630 | 3498.85 | 799 | 803 | 185.7 |
| C | 14 | 238 | 128944 | 689.95 | 799 | 803 | 185.7 |
| C | 3 | 233 | 77657 | 413.8 | 799 | 803 | 185.7 |
| D | 11 | 176 | 393765 | 2042.19 | 806 | 785 | 192.4 |
| D | 12 | 227 | 312398 | 1619.35 | 806 | 785 | 192.4 |
| D | 1 | 52 | 263588 | 1365.7 | 806 | 785 | 192.4 |
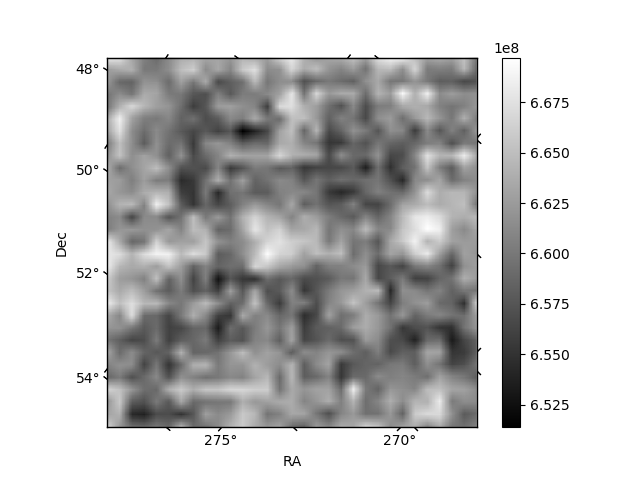
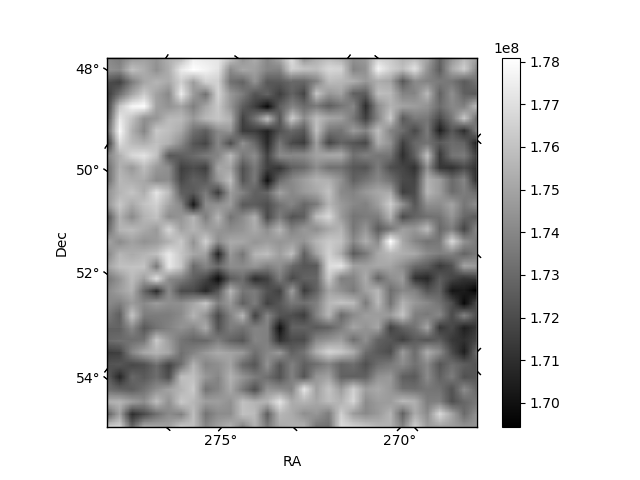
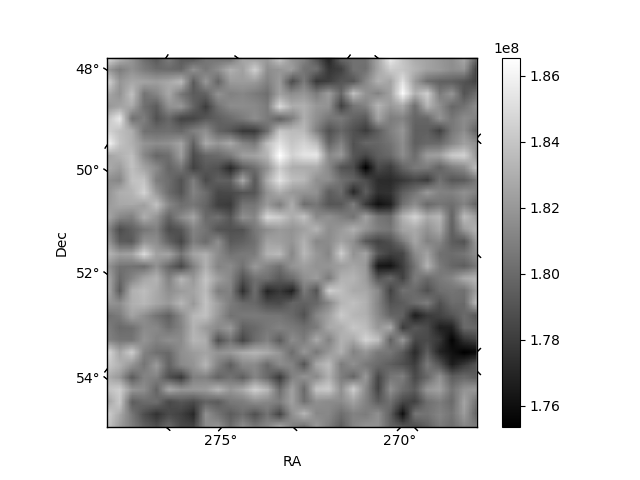
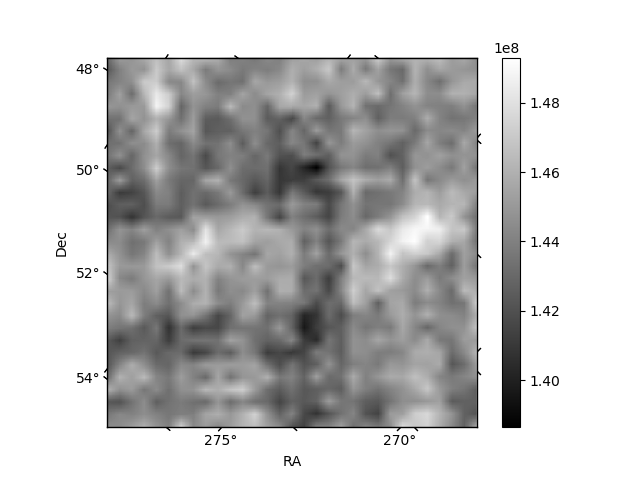
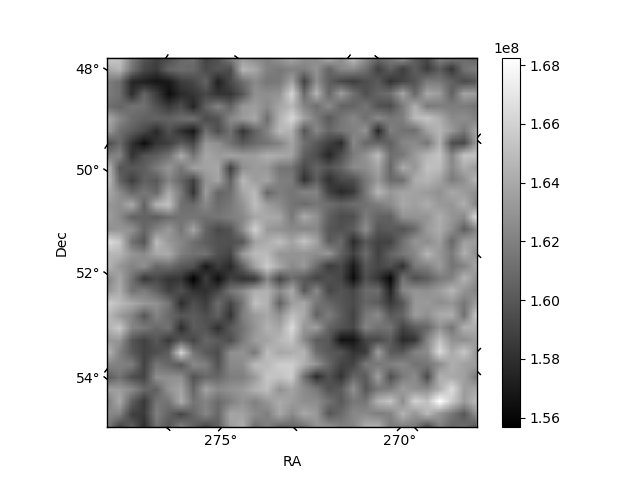
Histogram calculated using DETX and DETY for each event in the final _common_clean file
| Quadrant A | 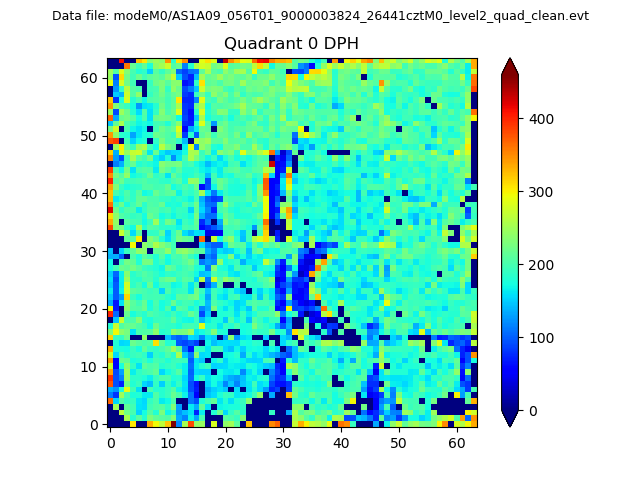 |
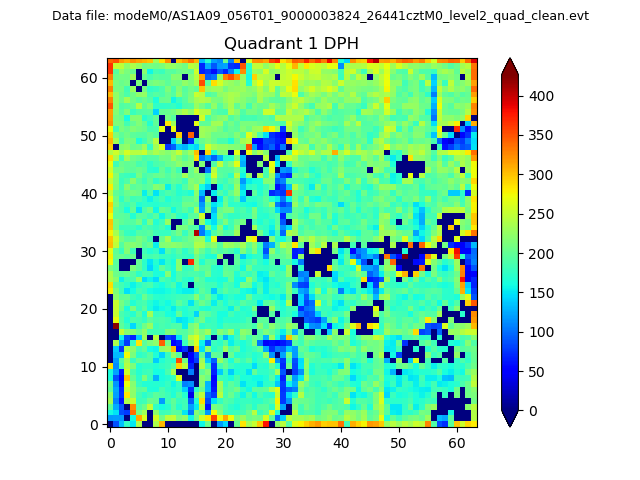 |
Quadrant B |
|---|---|---|---|
| Quadrant D |  |
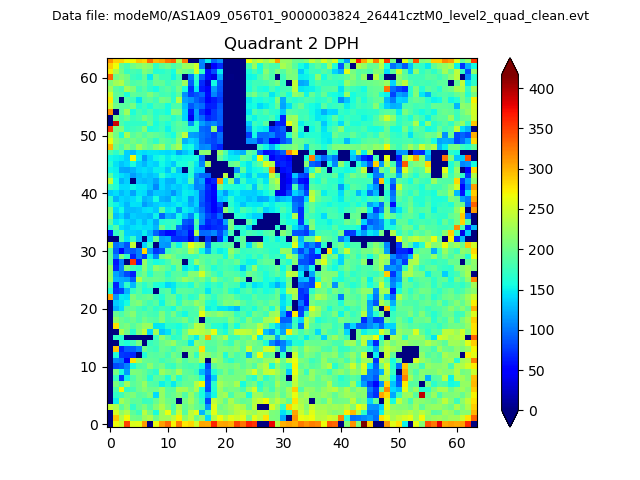 |
Quadrant C |
| Plot type | Count rate plots | Images |
|---|---|---|
| Comparison with Poisson distribution Blue bars denote a histogram of data divided into 1 sec bins. Red curve is a Poisson curve with rate = median count rate of data. |
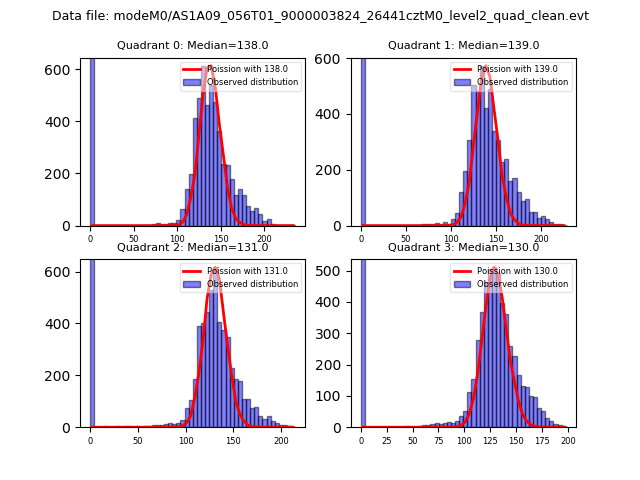 |
 |
| Quadrant-wise count rates Data is divided into 100 sec bins |
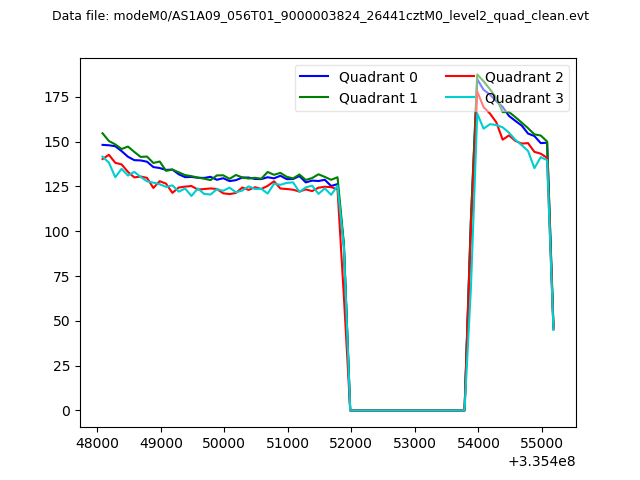 |
|
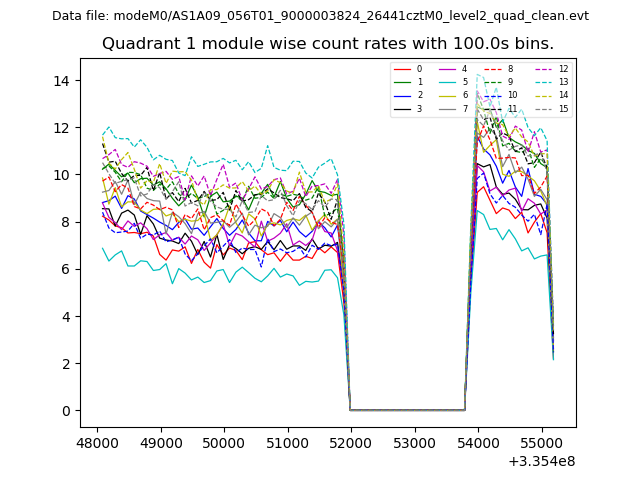
| Module-wise count rates for Quadrant A Data is divided into 100 sec bins |
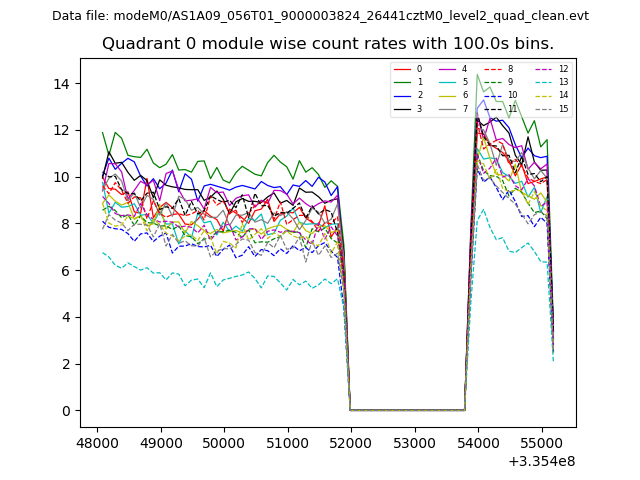 |
 |
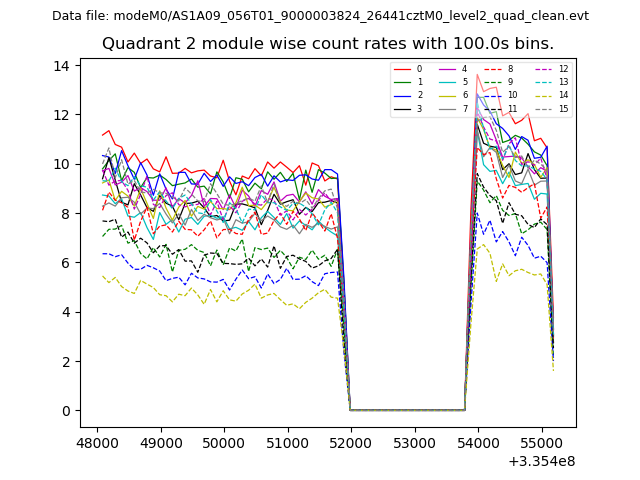
| Module-wise count rates for Quadrant B Data is divided into 100 sec bins |
 |
 |
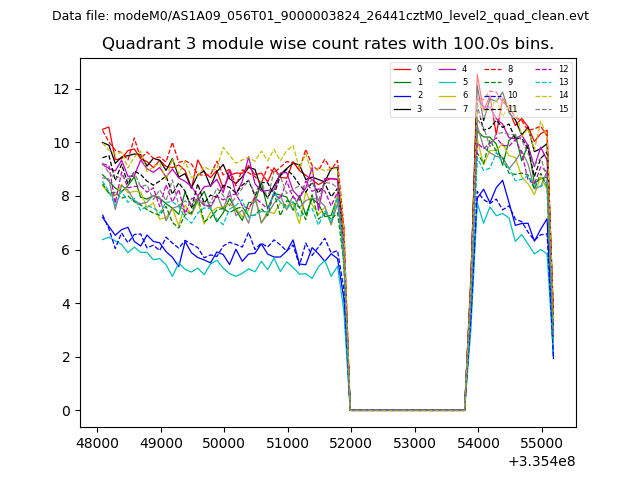
| Module-wise count rates for Quadrant C Data is divided into 100 sec bins |
 |
 |
| Module-wise count rates for Quadrant D Data is divided into 100 sec bins |
 |
 |
| Parameter | Plot |
|---|---|
| CZT HV Monitor | 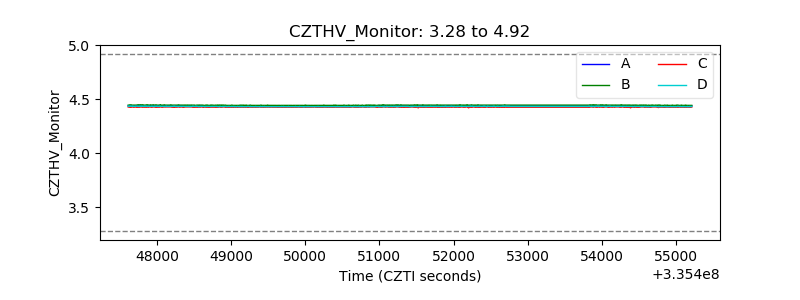 |
| D_VDD | 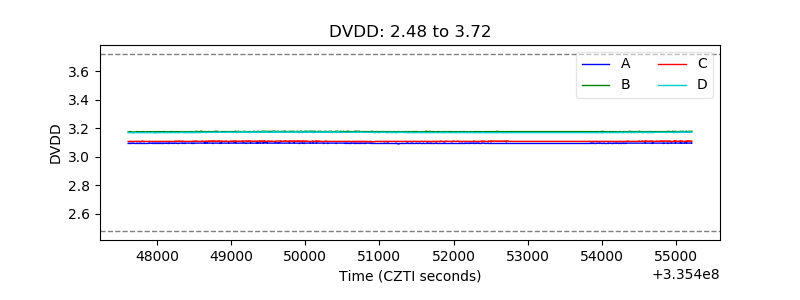 |
| Temperature 1 |  |
| Veto HV Monitor |  |
| Veto LLD | 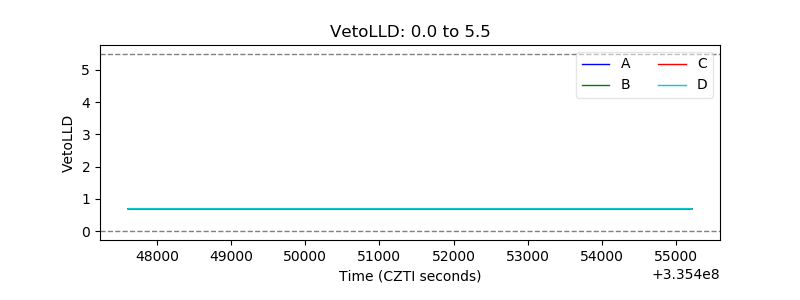 |
| Alpha Counter | 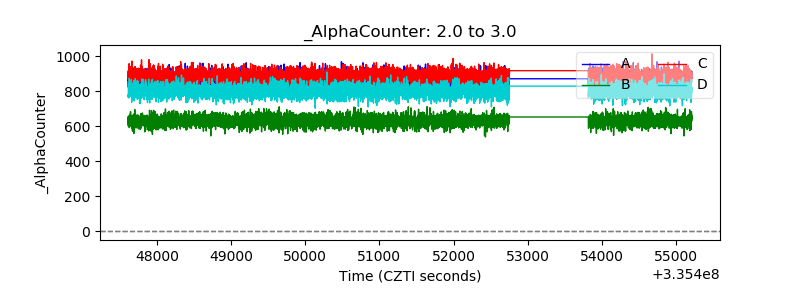 |
| _CPM_Rate | 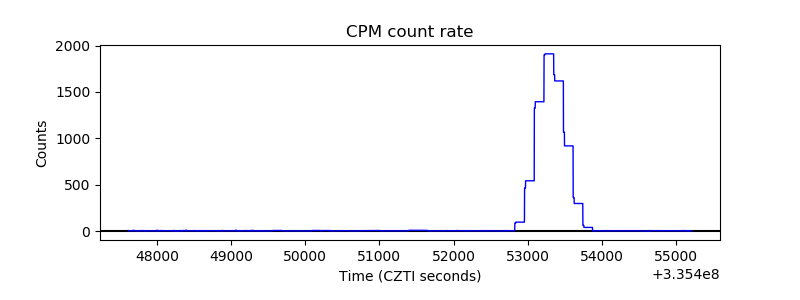 |
| CZT Counter | 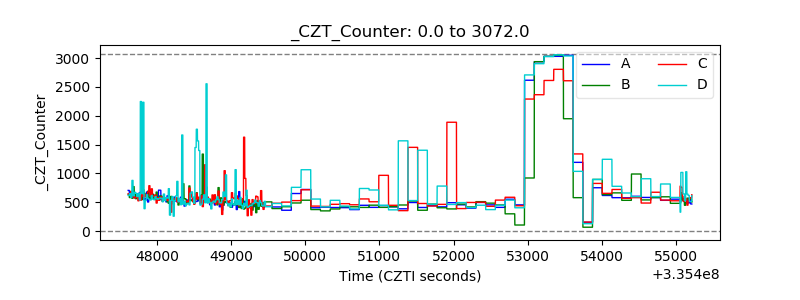 |
| +2.5 Volts monitor |  |
| +5 Volts monitor | 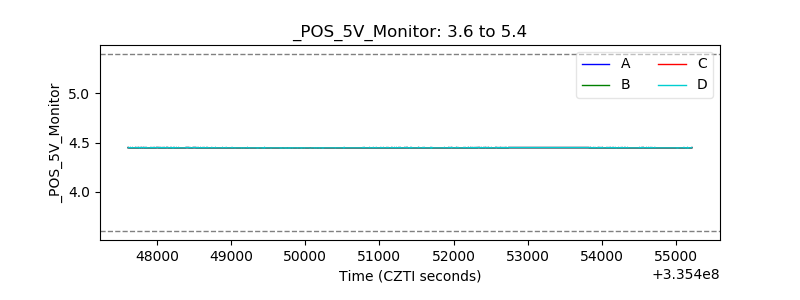 |
| _ROLL_ROT | 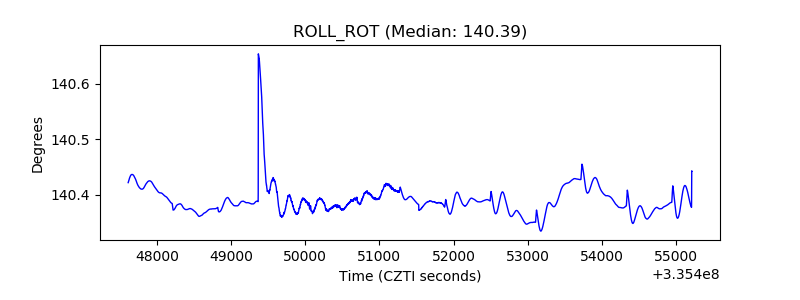 |
| _Roll_DEC | 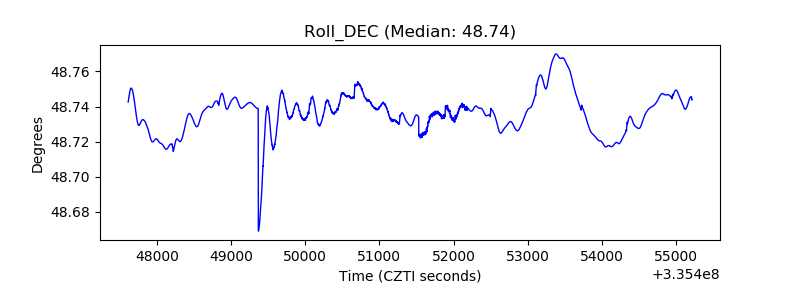 |
| _Roll_RA | 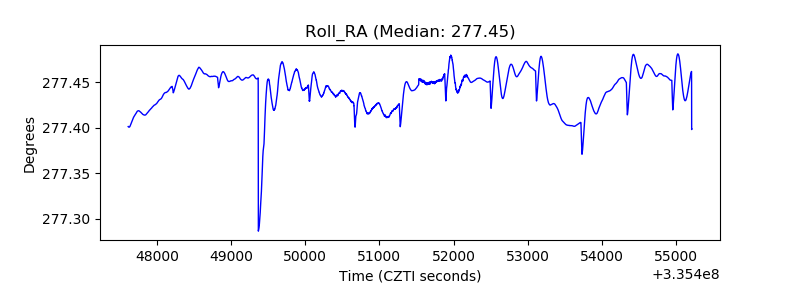 |
| Veto Counter | 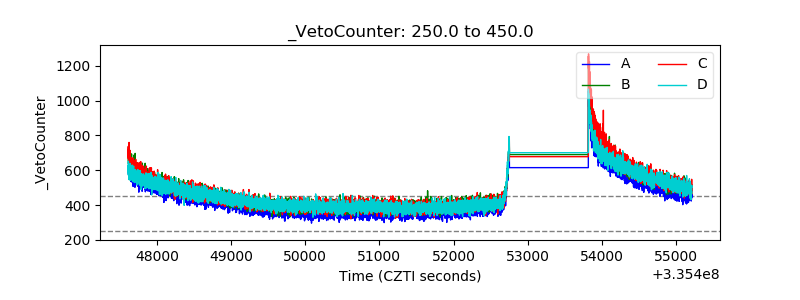 |