| Param | Original file | Final file |
|---|---|---|
| Filename | modeM0/AS1A09_056T01_9000003824_26443cztM0_level2.evt | modeM0/AS1A09_056T01_9000003824_26443cztM0_level2_quad_clean.evt |
| Size (bytes) | 488,977,920 | 117,236,160 |
| Size | 466.3 MB | 111.8 MB |
| Events in quadrant A | 3,190,124 | 797,985 |
| Events in quadrant B | 3,279,520 | 804,547 |
| Events in quadrant C | 3,954,731 | 760,213 |
| Events in quadrant D | 3,960,070 | 751,679 |
| Mode M9 | |||
|---|---|---|---|
| Quadrant | BADHDUFLAG | Total packets | Discarded packets |
| A | 0 | 12 | 0 |
| B | 0 | 12 | 0 |
| C | 0 | 12 | 0 |
| D | 0 | 12 | 0 |
| Mode M0 | |||
|---|---|---|---|
| Quadrant | BADHDUFLAG | Total packets | Discarded packets |
| A | 0 | 13712 | 0 |
| B | 0 | 13880 | 0 |
| C | 0 | 15872 | 0 |
| D | 0 | 16045 | 0 |
| Quadrant | Total seconds | Saturated seconds | Saturation percentage |
|---|---|---|---|
| A | 6249 | 34 | 0.544087% |
| B | 6250 | 64 | 1.024000% |
| C | 6250 | 249 | 3.984000% |
| D | 6249 | 148 | 2.368379% |
Noise dominated data is calculated using 1-second bins in cleaned event files. If a bin has >2000 counts, and if more than 50% of those come from <1% of pixels, then it is considered to be noise-dominated and hence unusable.
| Quadrant | # 1 sec bins | Bins with >0 counts | Bins with >2000 counts | High rate bins dominated by noise | Noise dominated (total time) | Noise dominated (detector-on time) | Marked lightcurve |
|---|---|---|---|---|---|---|---|
| A | 7469 | 6250 | 0 | 0 | 0.00% | 0.00% | 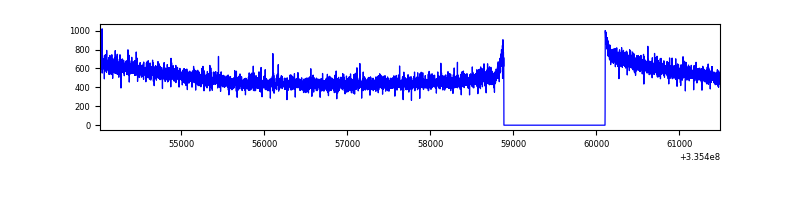 |
| B | 7470 | 6251 | 1 | 1 | 0.01% | 0.02% | 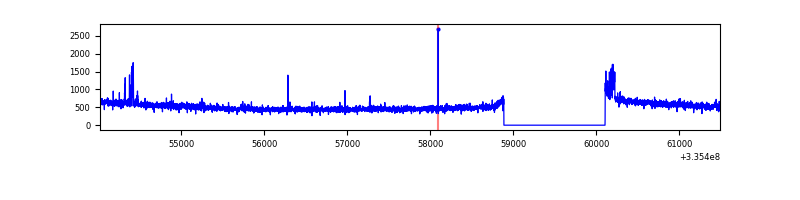 |
| C | 7470 | 6250 | 90 | 90 | 1.20% | 1.44% | 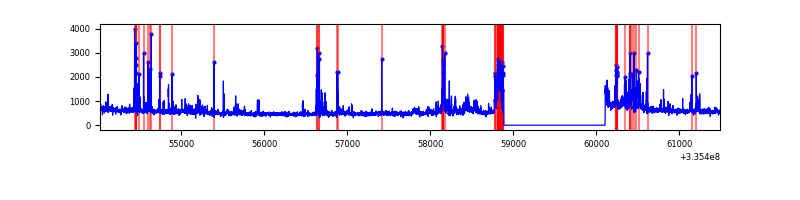 |
| D | 7469 | 6250 | 67 | 67 | 0.90% | 1.07% | 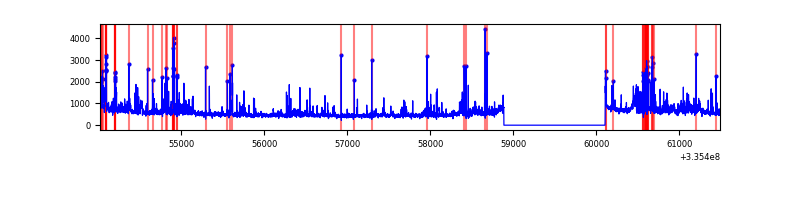 |
Top three noisy pixels from each quadrant. If the there are fewer than three noisy pixels in the level2.evt file, extra rows are filled as -1
| Pixel properties | Quadrant properties | ||||||
|---|---|---|---|---|---|---|---|
| Quadrant | DetID | PixID | Counts | Sigma | Mean | Median | Sigma |
| A | 13 | 254 | 9335 | 52.5 | 825 | 808 | 162.4 |
| A | 12 | 189 | 7724 | 42.58 | 825 | 808 | 162.4 |
| A | 0 | 226 | 7333 | 40.18 | 825 | 808 | 162.4 |
| B | 0 | 190 | 90344 | 591.61 | 814 | 798 | 151.4 |
| B | 12 | 111 | 17580 | 110.87 | 814 | 798 | 151.4 |
| B | 11 | 111 | 15681 | 98.33 | 814 | 798 | 151.4 |
| C | 4 | 254 | 705478 | 3880.5 | 783 | 790 | 181.6 |
| C | 14 | 238 | 126710 | 693.4 | 783 | 790 | 181.6 |
| C | 3 | 233 | 67070 | 364.98 | 783 | 790 | 181.6 |
| D | 1 | 52 | 359673 | 1893.59 | 798 | 779 | 189.5 |
| D | 7 | 80 | 261045 | 1373.21 | 798 | 779 | 189.5 |
| D | 11 | 176 | 177542 | 932.63 | 798 | 779 | 189.5 |
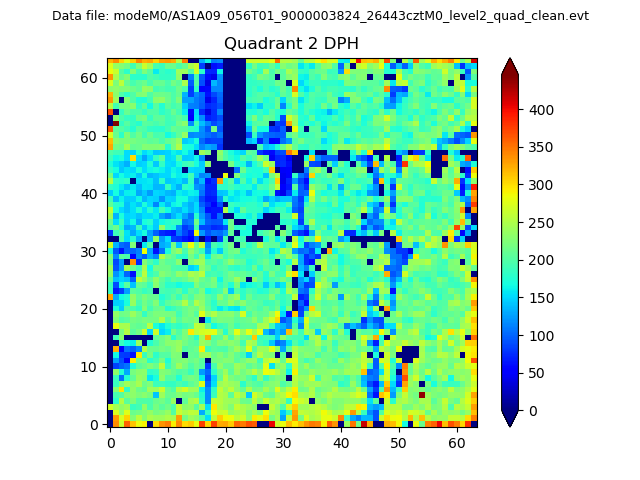
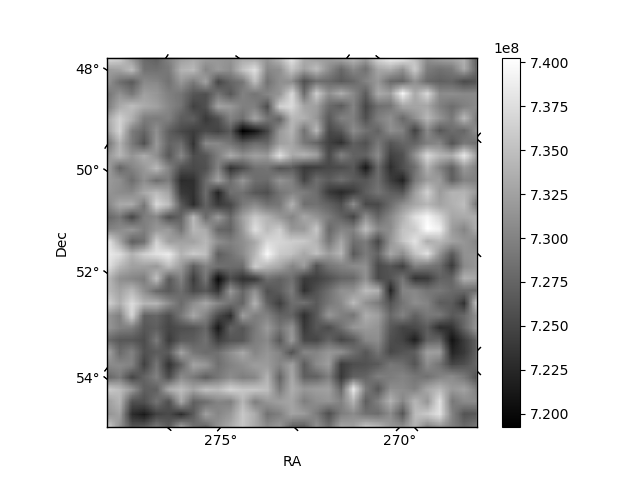
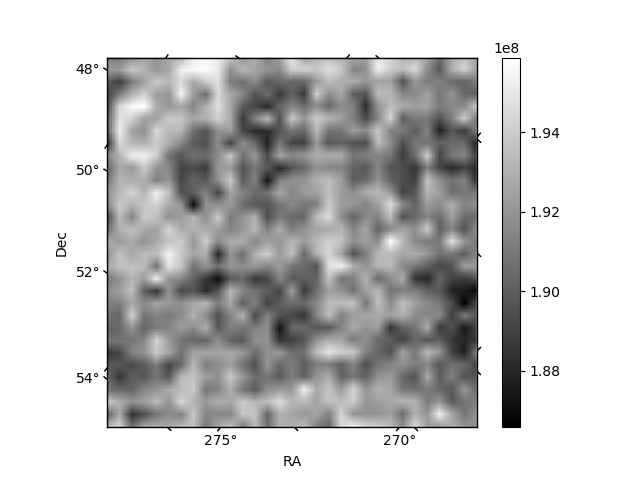
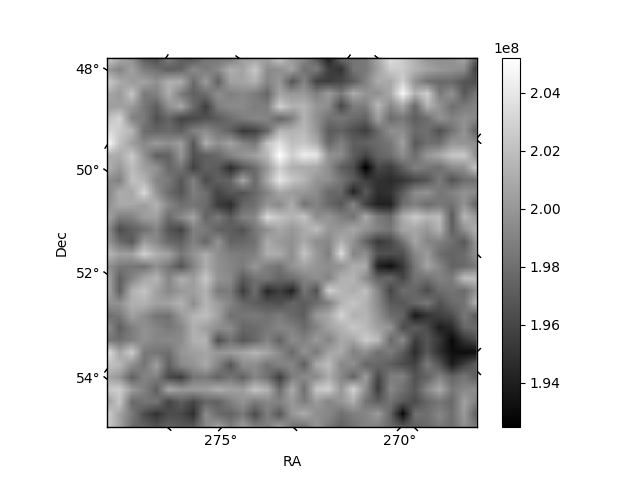
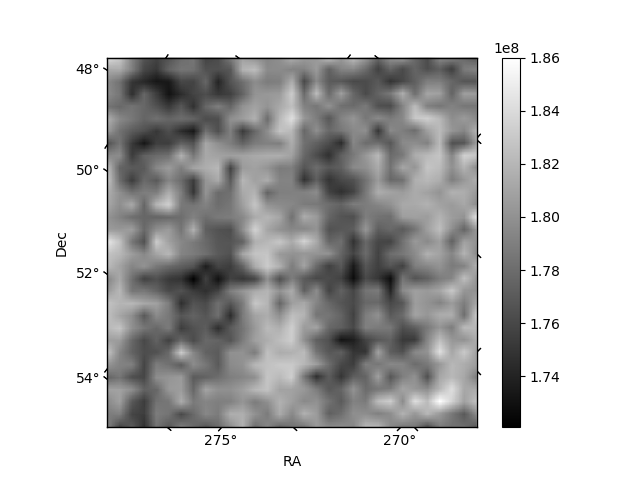
Histogram calculated using DETX and DETY for each event in the final _common_clean file
| Quadrant A | 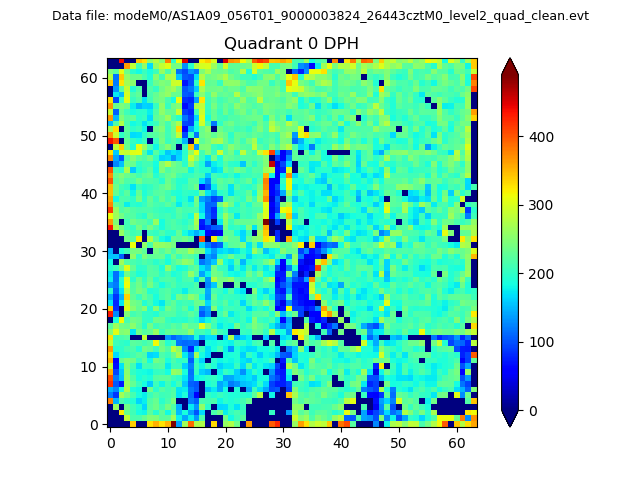 |
 |
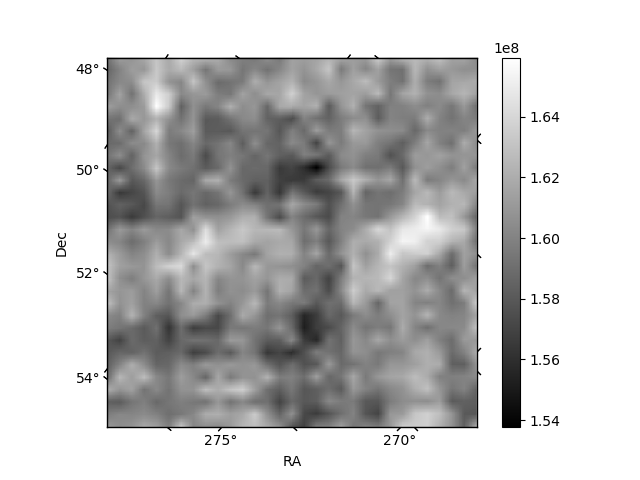
Quadrant B |
|---|---|---|---|
| Quadrant D | 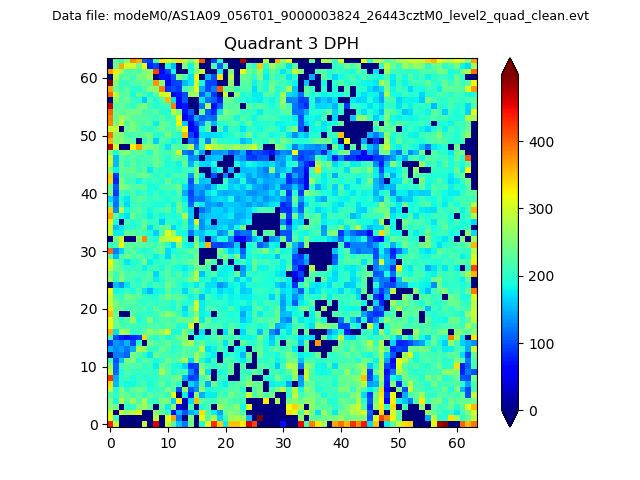 |
 |
Quadrant C |
| Plot type | Count rate plots | Images |
|---|---|---|
| Comparison with Poisson distribution Blue bars denote a histogram of data divided into 1 sec bins. Red curve is a Poisson curve with rate = median count rate of data. |
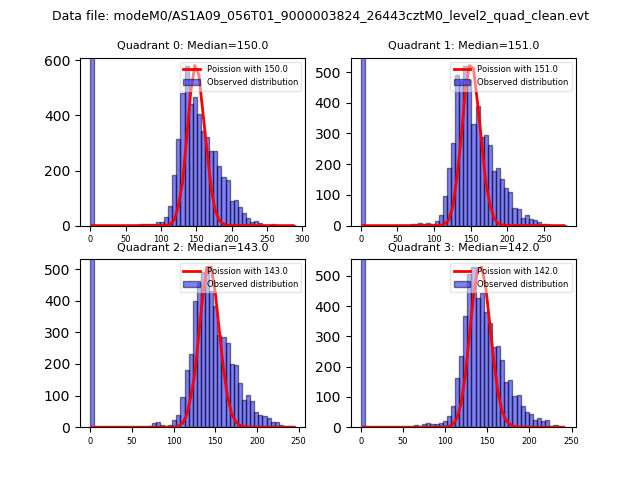 |
 |
| Quadrant-wise count rates Data is divided into 100 sec bins |
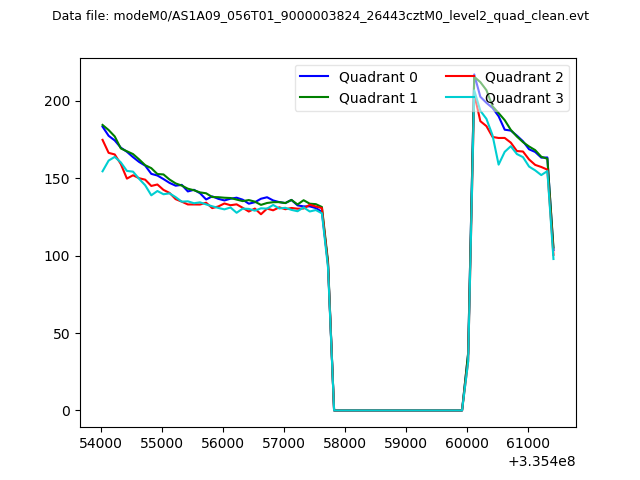 |
|
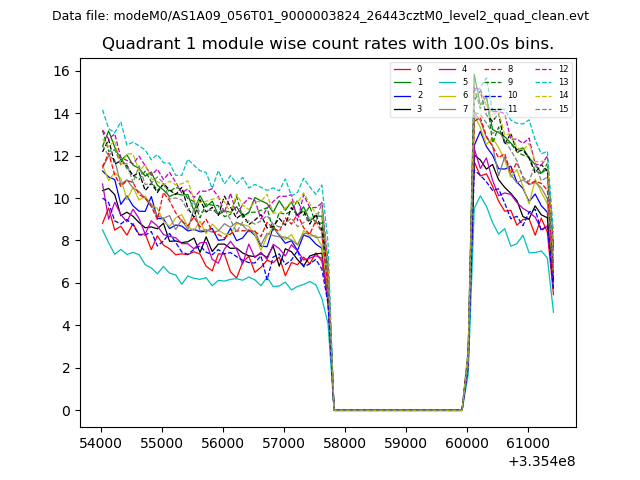
| Module-wise count rates for Quadrant A Data is divided into 100 sec bins |
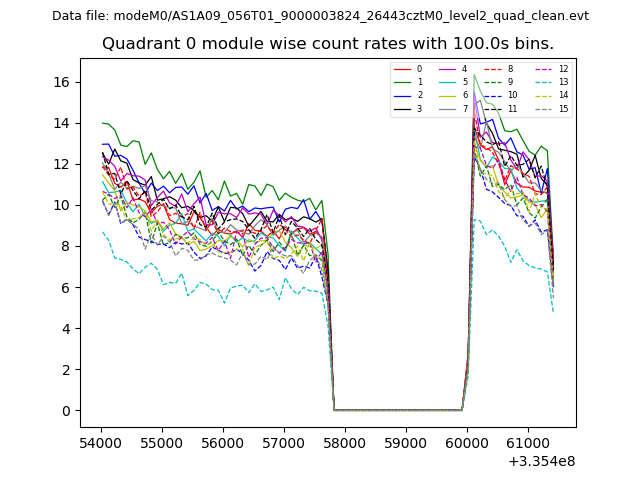 |
 |
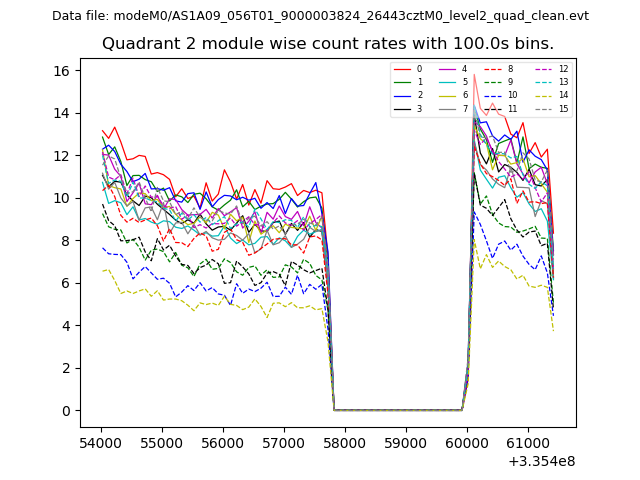
| Module-wise count rates for Quadrant B Data is divided into 100 sec bins |
 |
 |
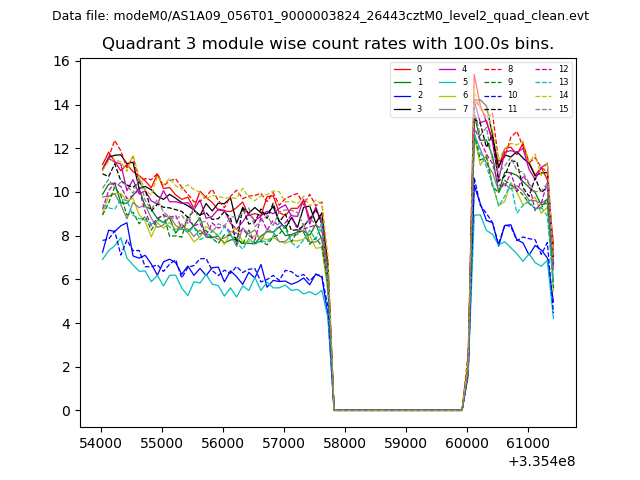
| Module-wise count rates for Quadrant C Data is divided into 100 sec bins |
 |
 |
| Module-wise count rates for Quadrant D Data is divided into 100 sec bins |
 |
 |
| Parameter | Plot |
|---|---|
| CZT HV Monitor | 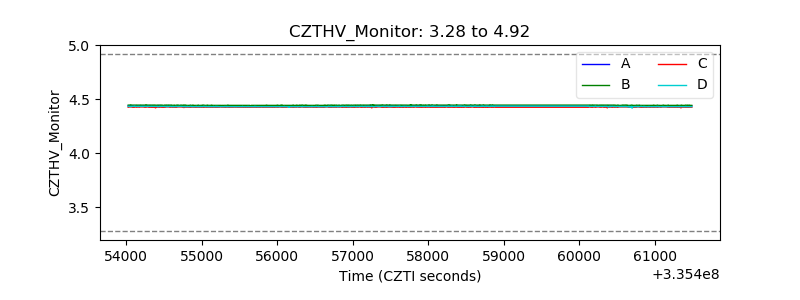 |
| D_VDD | 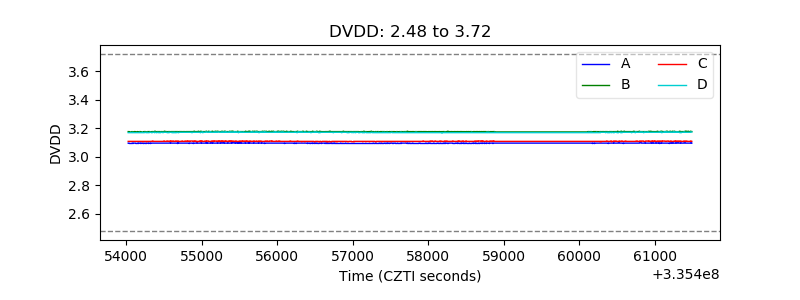 |
| Temperature 1 |  |
| Veto HV Monitor | 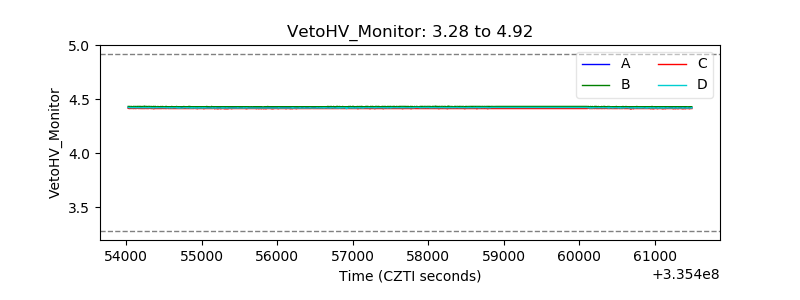 |
| Veto LLD |  |
| Alpha Counter | 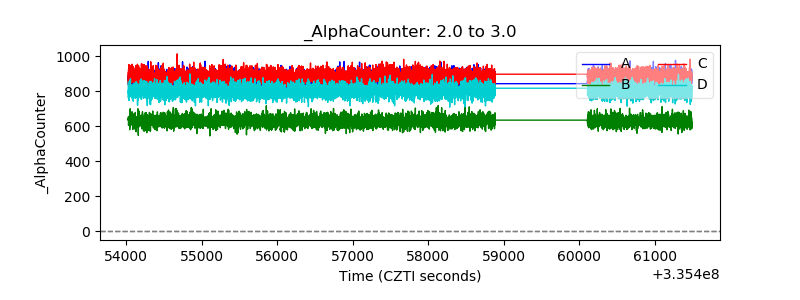 |
| _CPM_Rate | 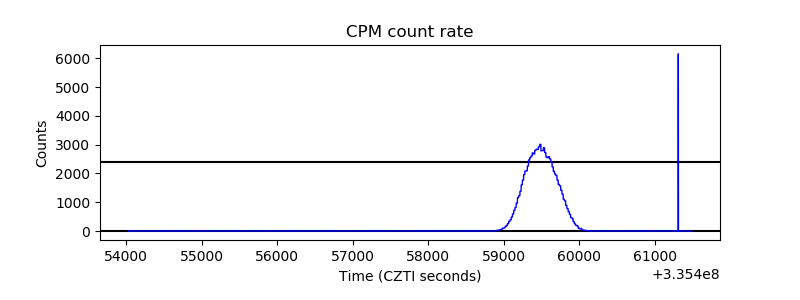 |
| CZT Counter | 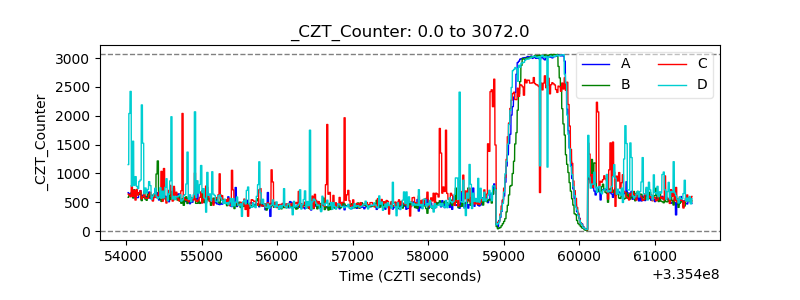 |
| +2.5 Volts monitor |  |
| +5 Volts monitor | 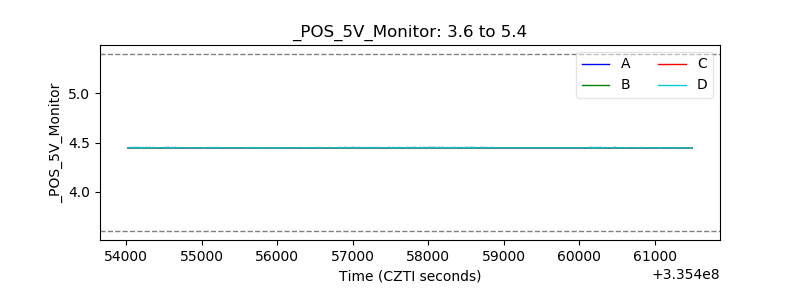 |
| _ROLL_ROT | 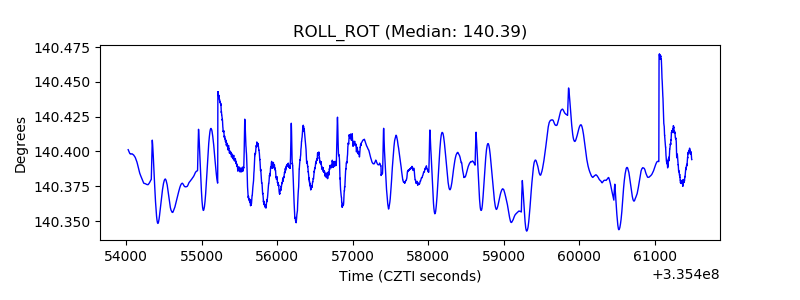 |
| _Roll_DEC | 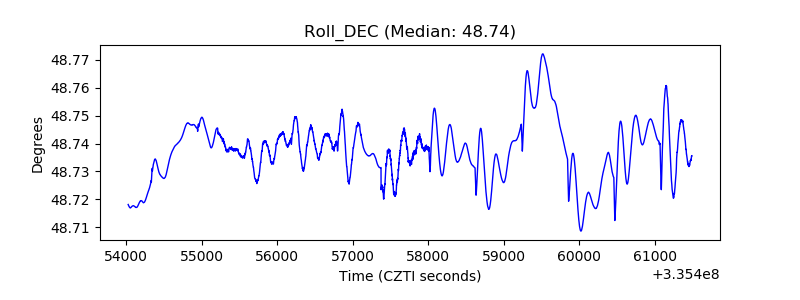 |
| _Roll_RA |  |
| Veto Counter | 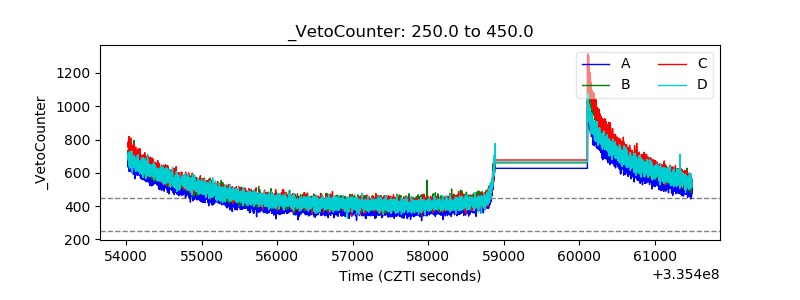 |