| Param | Original file | Final file |
|---|---|---|
| Filename | modeM0/AS1A09_056T01_9000003824_26444cztM0_level2.evt | modeM0/AS1A09_056T01_9000003824_26444cztM0_level2_quad_clean.evt |
| Size (bytes) | 473,322,240 | 112,383,360 |
| Size | 451.4 MB | 107.2 MB |
| Events in quadrant A | 3,156,273 | 758,105 |
| Events in quadrant B | 3,209,619 | 772,439 |
| Events in quadrant C | 3,632,929 | 731,407 |
| Events in quadrant D | 3,928,363 | 722,641 |
| Mode M9 | |||
|---|---|---|---|
| Quadrant | BADHDUFLAG | Total packets | Discarded packets |
| A | 0 | 13 | 0 |
| B | 0 | 13 | 0 |
| C | 0 | 13 | 0 |
| D | 0 | 13 | 0 |
| Mode M0 | |||
|---|---|---|---|
| Quadrant | BADHDUFLAG | Total packets | Discarded packets |
| A | 0 | 13356 | 0 |
| B | 0 | 13410 | 0 |
| C | 0 | 14744 | 0 |
| D | 0 | 15865 | 0 |
| Quadrant | Total seconds | Saturated seconds | Saturation percentage |
|---|---|---|---|
| A | 6003 | 51 | 0.849575% |
| B | 6003 | 48 | 0.799600% |
| C | 6003 | 194 | 3.231717% |
| D | 6003 | 191 | 3.181742% |
Noise dominated data is calculated using 1-second bins in cleaned event files. If a bin has >2000 counts, and if more than 50% of those come from <1% of pixels, then it is considered to be noise-dominated and hence unusable.
| Quadrant | # 1 sec bins | Bins with >0 counts | Bins with >2000 counts | High rate bins dominated by noise | Noise dominated (total time) | Noise dominated (detector-on time) | Marked lightcurve |
|---|---|---|---|---|---|---|---|
| A | 7308 | 6004 | 0 | 0 | 0.00% | 0.00% | 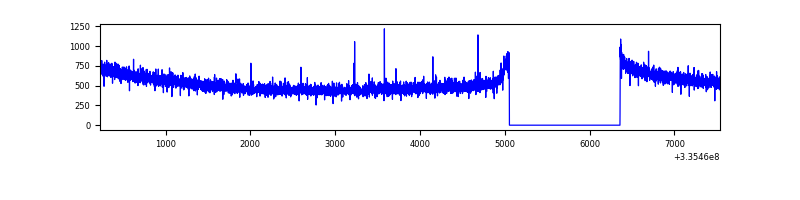 |
| B | 7308 | 6004 | 0 | 0 | 0.00% | 0.00% | 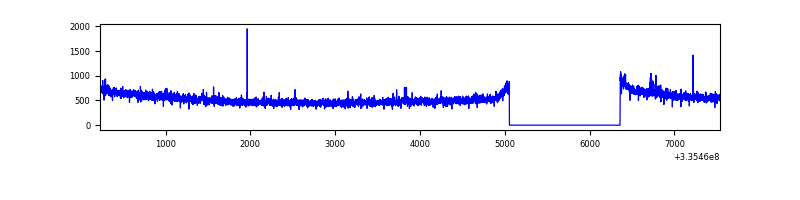 |
| C | 7308 | 6004 | 27 | 27 | 0.37% | 0.45% | 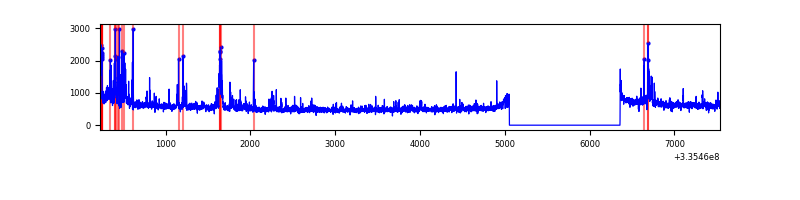 |
| D | 7308 | 6004 | 91 | 91 | 1.25% | 1.52% | 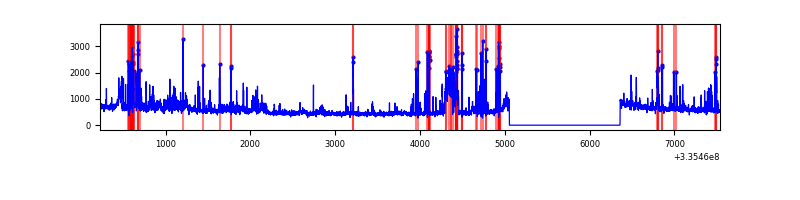 |
Top three noisy pixels from each quadrant. If the there are fewer than three noisy pixels in the level2.evt file, extra rows are filled as -1
| Pixel properties | Quadrant properties | ||||||
|---|---|---|---|---|---|---|---|
| Quadrant | DetID | PixID | Counts | Sigma | Mean | Median | Sigma |
| A | 13 | 254 | 8689 | 49.08 | 817 | 802 | 160.7 |
| A | 0 | 226 | 7079 | 39.06 | 817 | 802 | 160.7 |
| A | 3 | 137 | 6825 | 37.48 | 817 | 802 | 160.7 |
| B | 0 | 190 | 21657 | 140.66 | 810 | 792 | 148.3 |
| B | 12 | 111 | 16776 | 107.76 | 810 | 792 | 148.3 |
| B | 11 | 111 | 14940 | 95.38 | 810 | 792 | 148.3 |
| C | 4 | 254 | 297514 | 1628.66 | 790 | 797 | 182.2 |
| C | 14 | 238 | 129104 | 704.27 | 790 | 797 | 182.2 |
| C | 3 | 233 | 85826 | 466.72 | 790 | 797 | 182.2 |
| D | 11 | 176 | 359134 | 1909.26 | 794 | 777 | 187.7 |
| D | 7 | 80 | 315119 | 1674.76 | 794 | 777 | 187.7 |
| D | 1 | 52 | 200128 | 1062.11 | 794 | 777 | 187.7 |
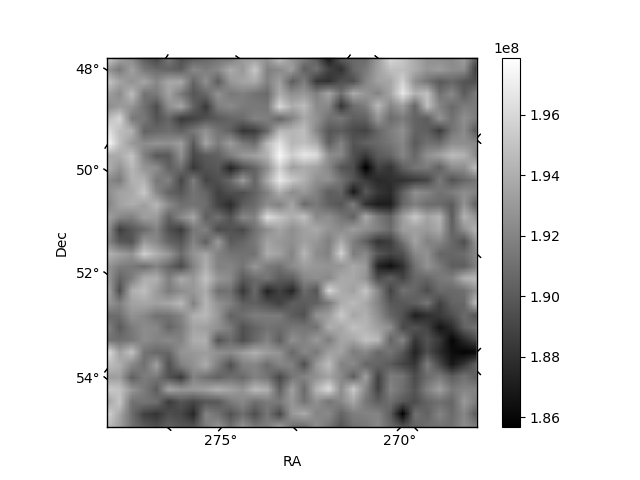
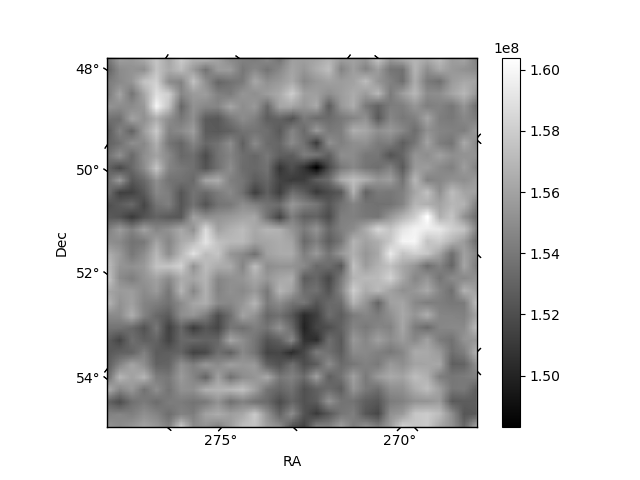
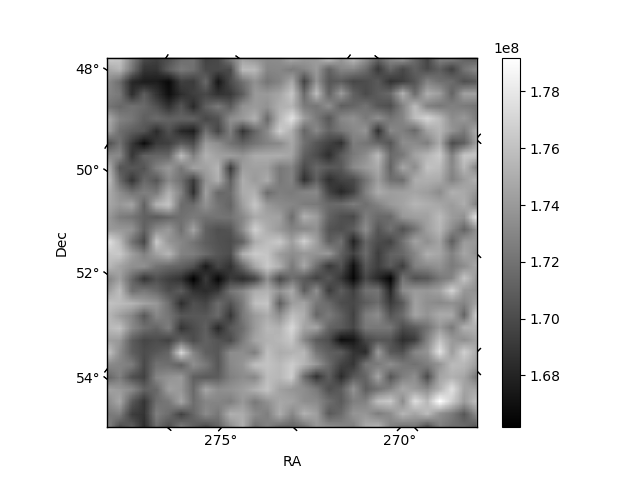
Histogram calculated using DETX and DETY for each event in the final _common_clean file
| Quadrant A | 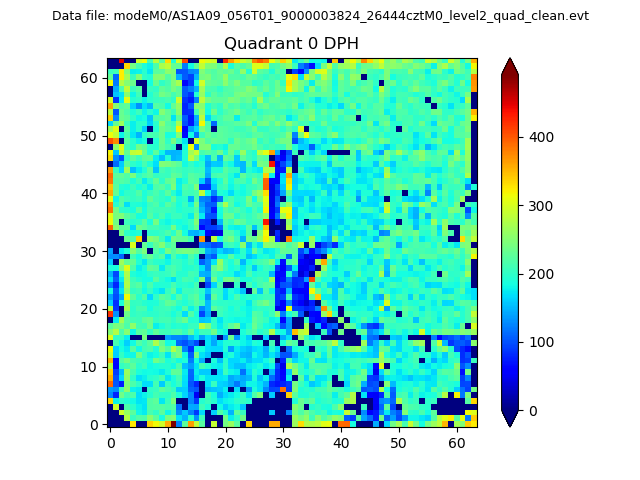 |
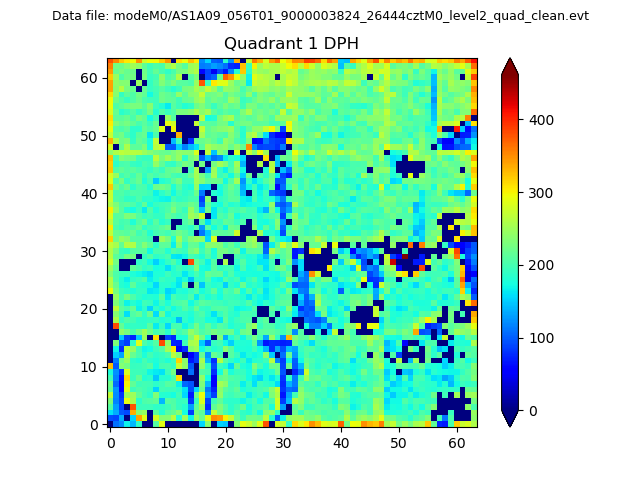 |
Quadrant B |
|---|---|---|---|
| Quadrant D |  |
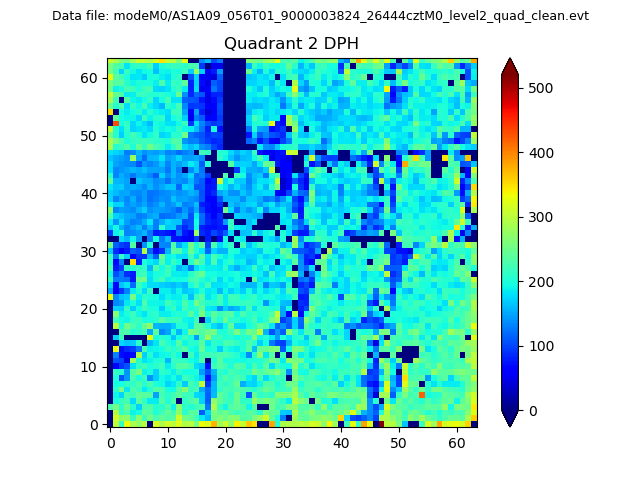 |
Quadrant C |
| Plot type | Count rate plots | Images |
|---|---|---|
| Comparison with Poisson distribution Blue bars denote a histogram of data divided into 1 sec bins. Red curve is a Poisson curve with rate = median count rate of data. |
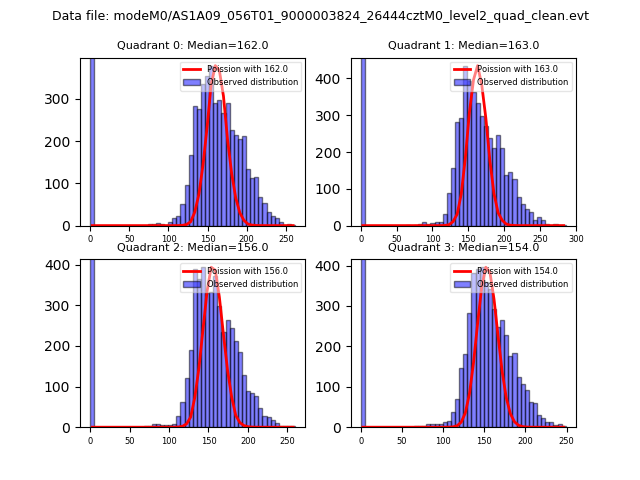 |
 |
| Quadrant-wise count rates Data is divided into 100 sec bins |
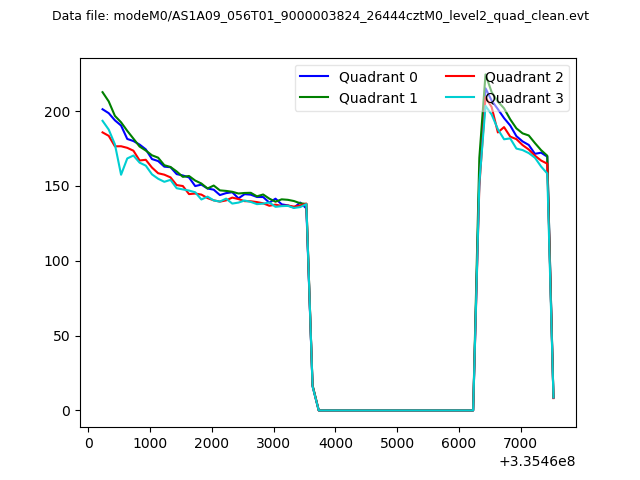 |
|
| Module-wise count rates for Quadrant A Data is divided into 100 sec bins |
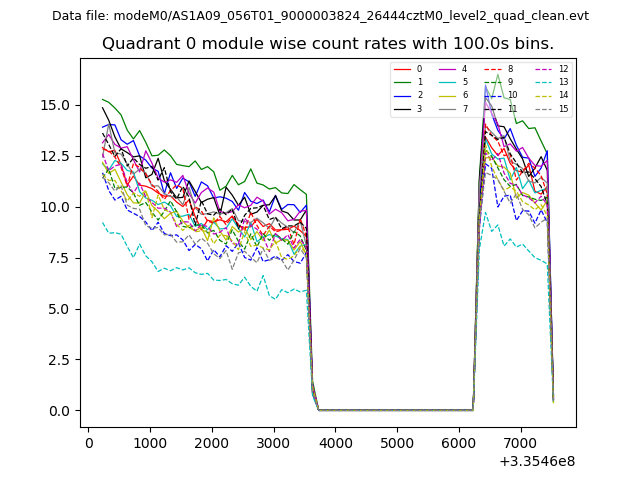 |
 |
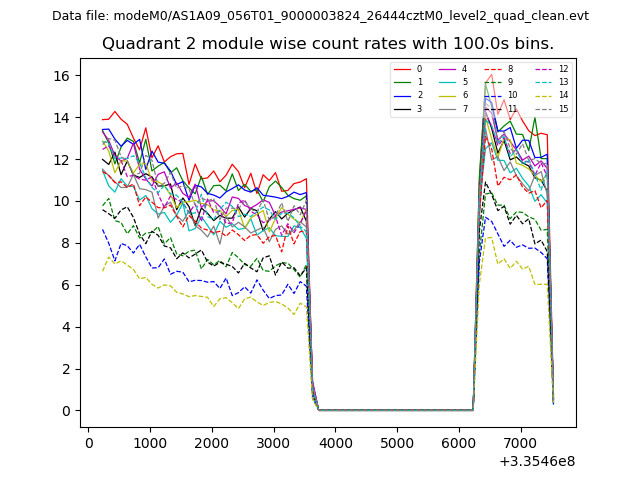
| Module-wise count rates for Quadrant B Data is divided into 100 sec bins |
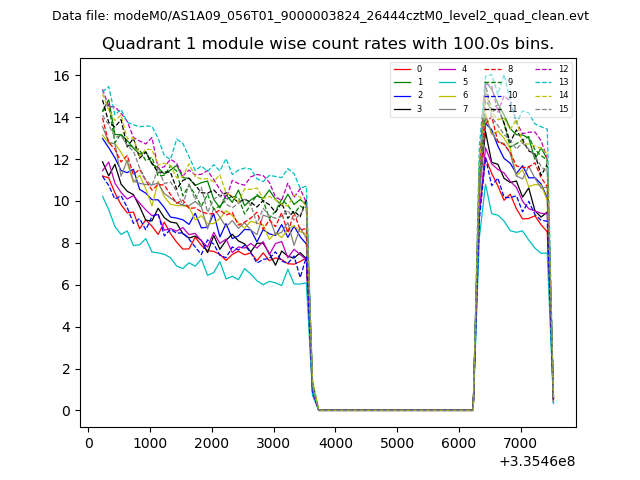 |
 |
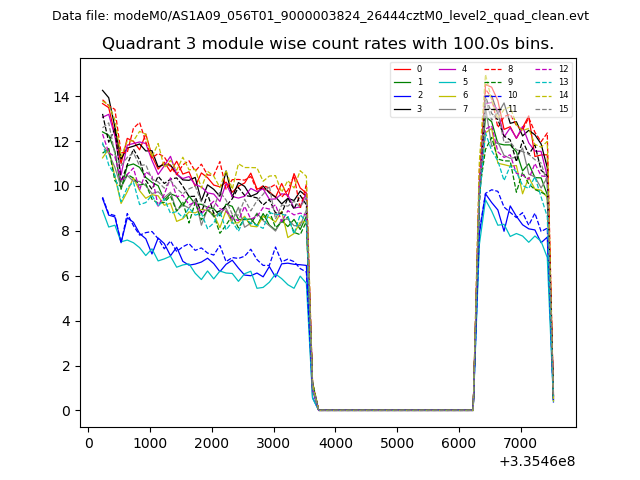
| Module-wise count rates for Quadrant C Data is divided into 100 sec bins |
 |
 |
| Module-wise count rates for Quadrant D Data is divided into 100 sec bins |
 |
 |
| Parameter | Plot |
|---|---|
| CZT HV Monitor | 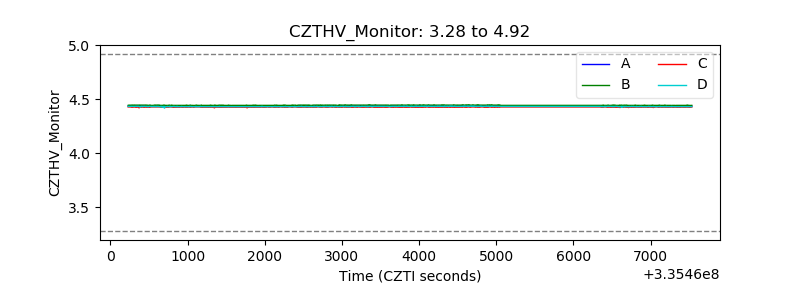 |
| D_VDD | 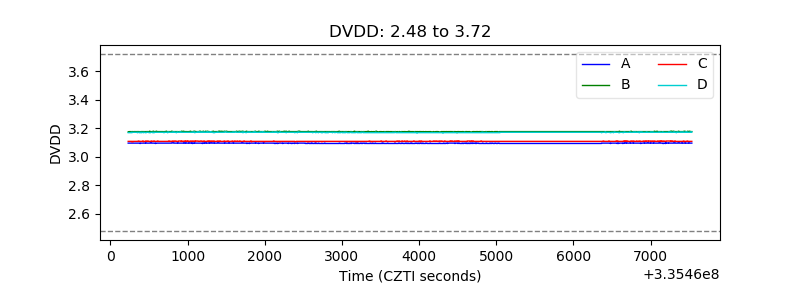 |
| Temperature 1 | 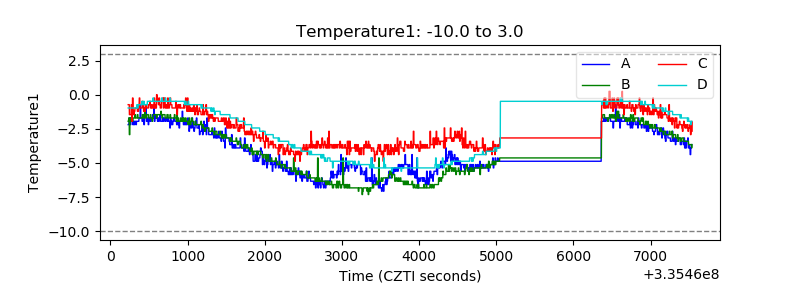 |
| Veto HV Monitor | 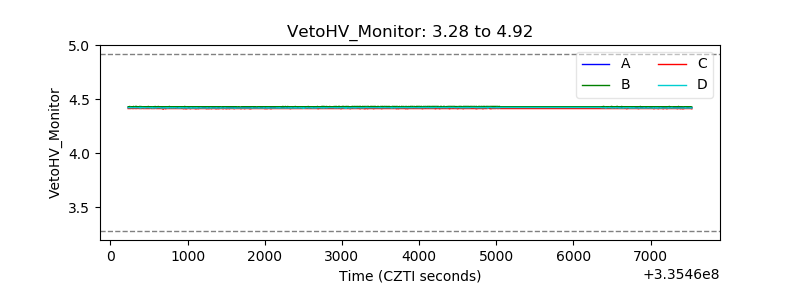 |
| Veto LLD | 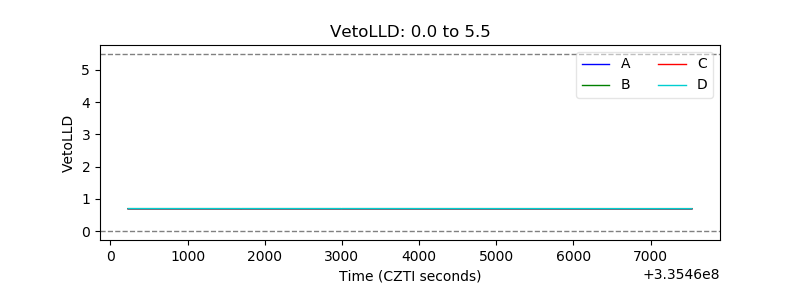 |
| Alpha Counter | 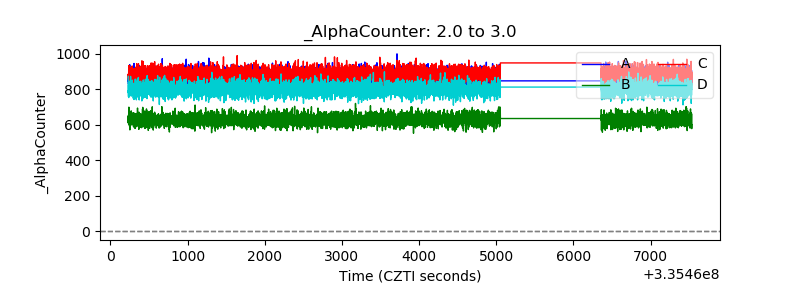 |
| _CPM_Rate | 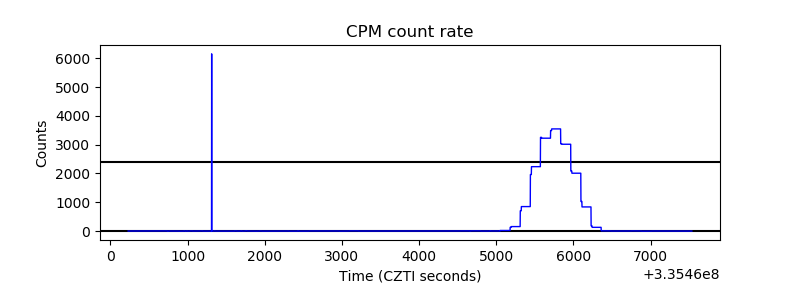 |
| CZT Counter |  |
| +2.5 Volts monitor |  |
| +5 Volts monitor |  |
| _ROLL_ROT | 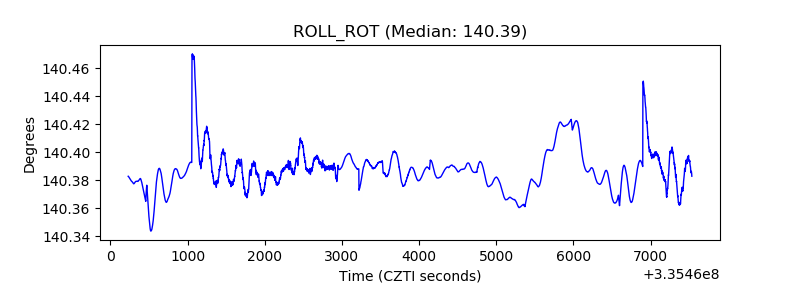 |
| _Roll_DEC |  |
| _Roll_RA | 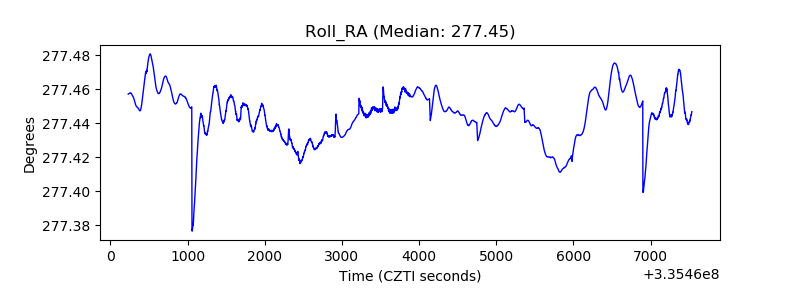 |
| Veto Counter | 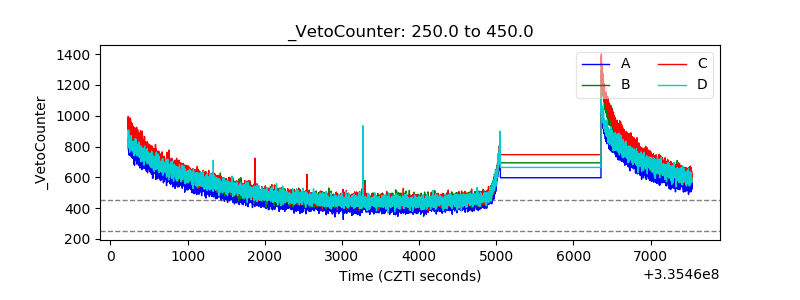 |