| Param | Original file | Final file |
|---|---|---|
| Filename | modeM0/AS1A09_056T01_9000003824_26445cztM0_level2.evt | modeM0/AS1A09_056T01_9000003824_26445cztM0_level2_quad_clean.evt |
| Size (bytes) | 507,824,640 | 107,815,680 |
| Size | 484.3 MB | 102.8 MB |
| Events in quadrant A | 3,330,451 | 724,275 |
| Events in quadrant B | 3,259,651 | 743,936 |
| Events in quadrant C | 3,671,715 | 708,921 |
| Events in quadrant D | 4,706,051 | 664,191 |
| Mode M9 | |||
|---|---|---|---|
| Quadrant | BADHDUFLAG | Total packets | Discarded packets |
| A | 0 | 14 | 0 |
| B | 0 | 14 | 0 |
| C | 0 | 14 | 0 |
| D | 0 | 14 | 0 |
| Mode M0 | |||
|---|---|---|---|
| Quadrant | BADHDUFLAG | Total packets | Discarded packets |
| A | 0 | 13775 | 0 |
| B | 0 | 13492 | 0 |
| C | 0 | 14964 | 0 |
| D | 0 | 18106 | 0 |
| Quadrant | Total seconds | Saturated seconds | Saturation percentage |
|---|---|---|---|
| A | 6068 | 56 | 0.922874% |
| B | 6068 | 56 | 0.922874% |
| C | 6068 | 203 | 3.345419% |
| D | 6068 | 472 | 7.778510% |
Noise dominated data is calculated using 1-second bins in cleaned event files. If a bin has >2000 counts, and if more than 50% of those come from <1% of pixels, then it is considered to be noise-dominated and hence unusable.
| Quadrant | # 1 sec bins | Bins with >0 counts | Bins with >2000 counts | High rate bins dominated by noise | Noise dominated (total time) | Noise dominated (detector-on time) | Marked lightcurve |
|---|---|---|---|---|---|---|---|
| A | 7448 | 6069 | 16 | 16 | 0.21% | 0.26% | 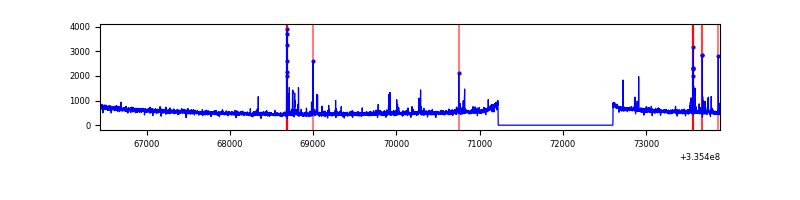 |
| B | 7448 | 6069 | 0 | 0 | 0.00% | 0.00% | 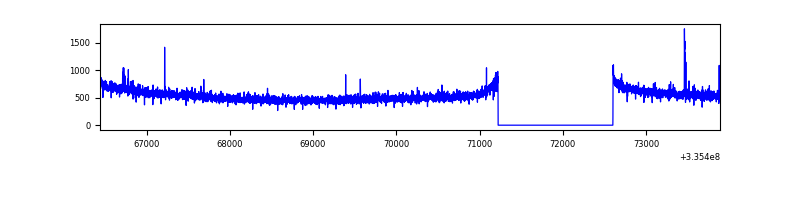 |
| C | 7448 | 6069 | 41 | 41 | 0.55% | 0.68% | 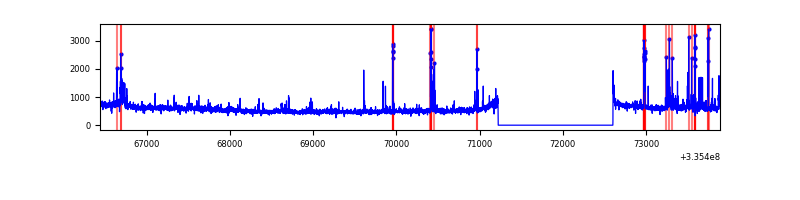 |
| D | 7448 | 6069 | 356 | 356 | 4.78% | 5.87% | 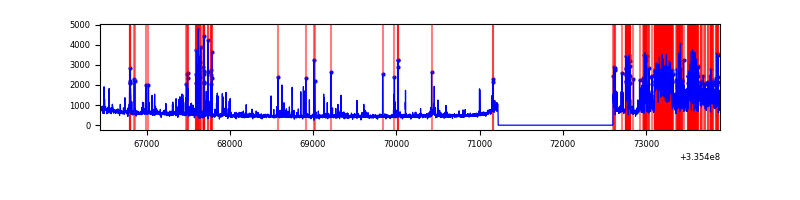 |
Top three noisy pixels from each quadrant. If the there are fewer than three noisy pixels in the level2.evt file, extra rows are filled as -1
| Pixel properties | Quadrant properties | ||||||
|---|---|---|---|---|---|---|---|
| Quadrant | DetID | PixID | Counts | Sigma | Mean | Median | Sigma |
| A | 0 | 13 | 148097 | 913.09 | 823 | 810 | 161.3 |
| A | 13 | 254 | 8221 | 45.94 | 823 | 810 | 161.3 |
| A | 0 | 226 | 7130 | 39.18 | 823 | 810 | 161.3 |
| B | 0 | 190 | 17742 | 113.59 | 823 | 804 | 149.1 |
| B | 12 | 111 | 17086 | 109.2 | 823 | 804 | 149.1 |
| B | 11 | 111 | 14917 | 94.65 | 823 | 804 | 149.1 |
| C | 4 | 254 | 194355 | 1040.41 | 806 | 813 | 186.0 |
| C | 14 | 238 | 130032 | 694.63 | 806 | 813 | 186.0 |
| C | 2 | 16 | 129656 | 692.61 | 806 | 813 | 186.0 |
| D | 7 | 80 | 893590 | 4819.59 | 790 | 777 | 185.2 |
| D | 1 | 52 | 524250 | 2825.82 | 790 | 777 | 185.2 |
| D | 12 | 233 | 185516 | 997.26 | 790 | 777 | 185.2 |
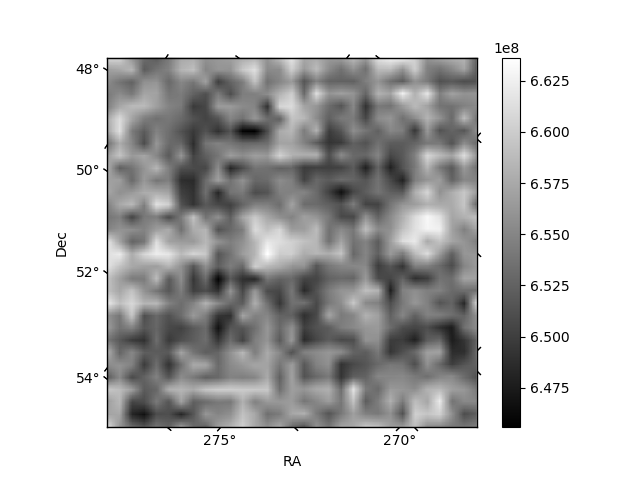
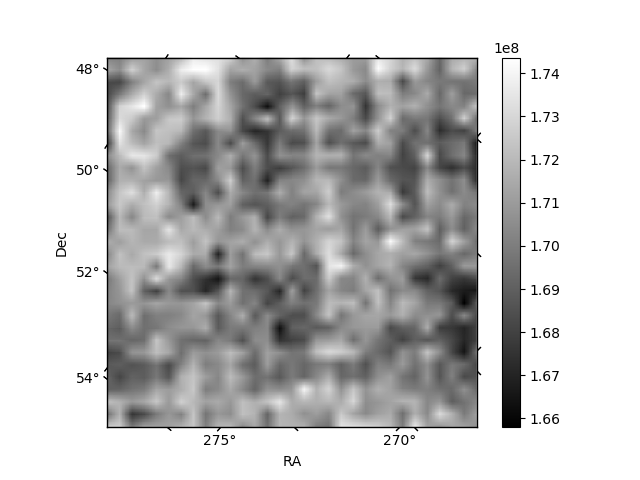
Histogram calculated using DETX and DETY for each event in the final _common_clean file
| Quadrant A | 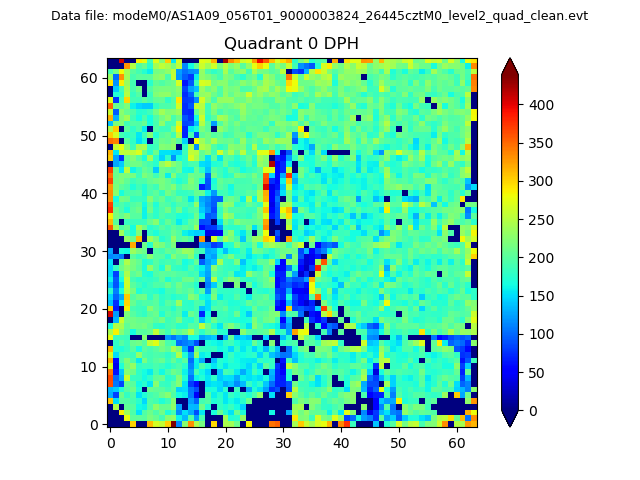 |
 |
Quadrant B |
|---|---|---|---|
| Quadrant D | 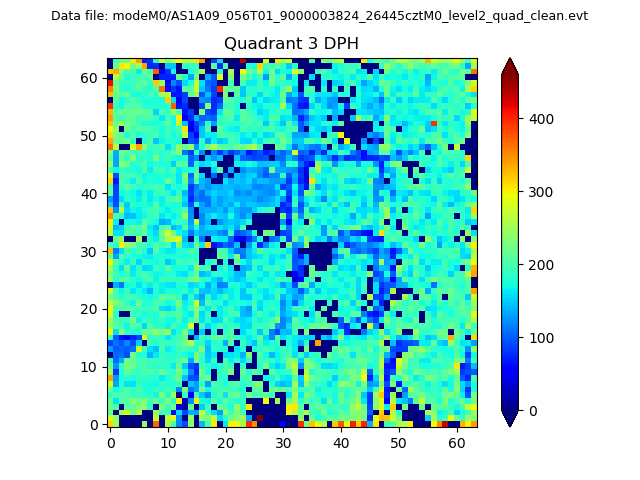 |
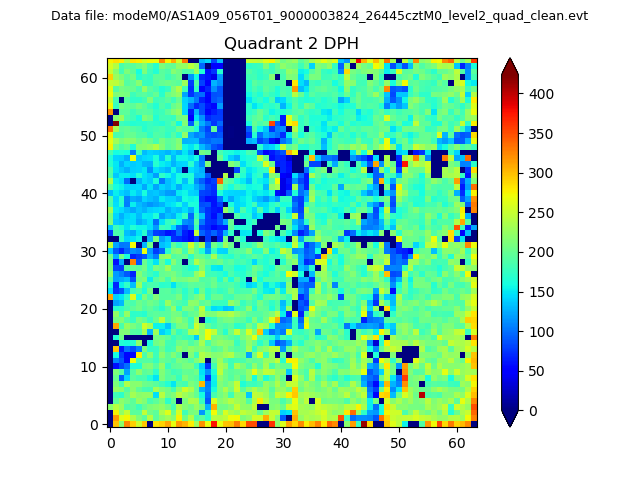 |
Quadrant C |
| Plot type | Count rate plots | Images |
|---|---|---|
| Comparison with Poisson distribution Blue bars denote a histogram of data divided into 1 sec bins. Red curve is a Poisson curve with rate = median count rate of data. |
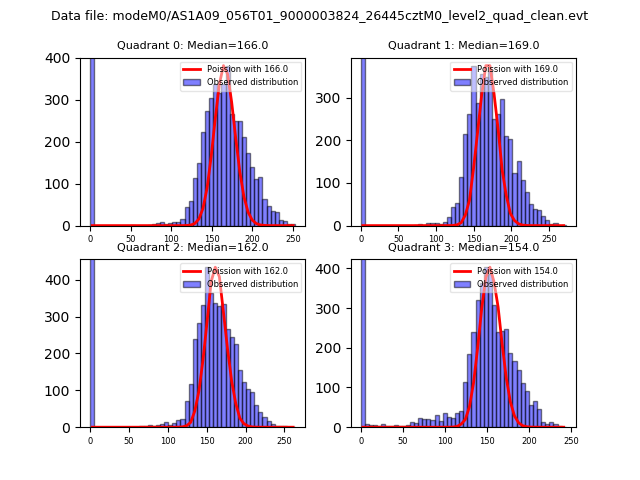 |
 |
| Quadrant-wise count rates Data is divided into 100 sec bins |
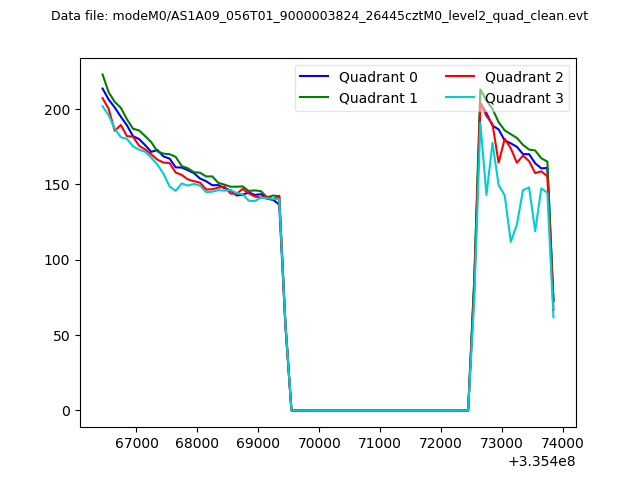 |
|
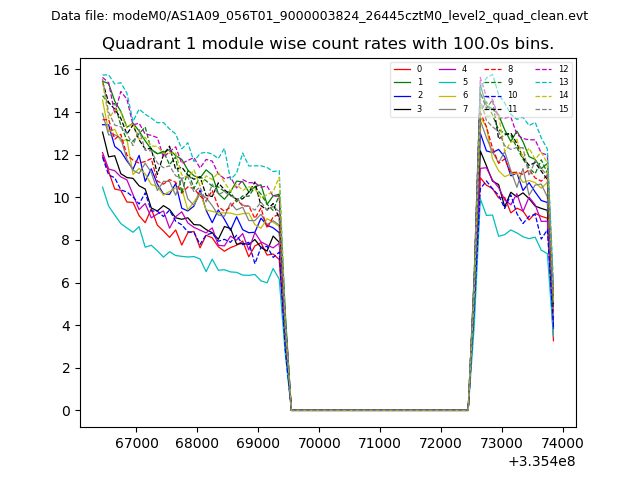
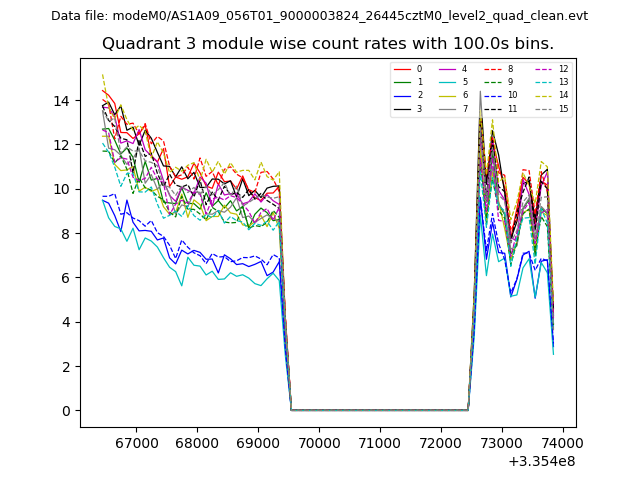
| Module-wise count rates for Quadrant A Data is divided into 100 sec bins |
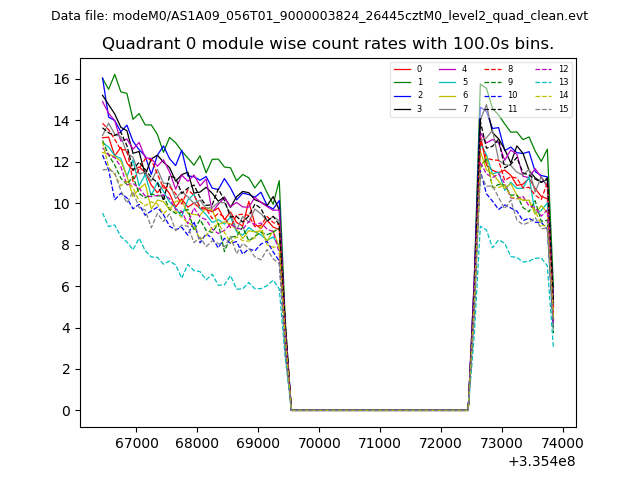 |
 |
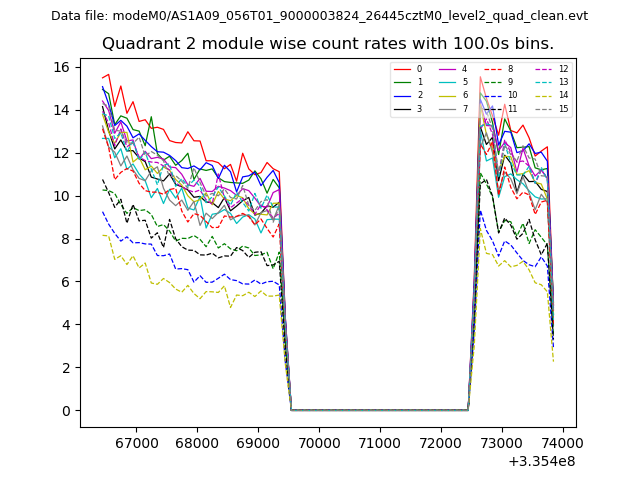
| Module-wise count rates for Quadrant B Data is divided into 100 sec bins |
 |
 |
| Module-wise count rates for Quadrant C Data is divided into 100 sec bins |
 |
 |
| Module-wise count rates for Quadrant D Data is divided into 100 sec bins |
 |
 |
| Parameter | Plot |
|---|---|
| CZT HV Monitor | 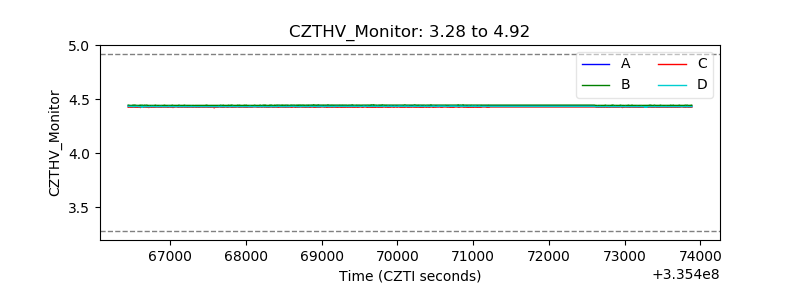 |
| D_VDD | 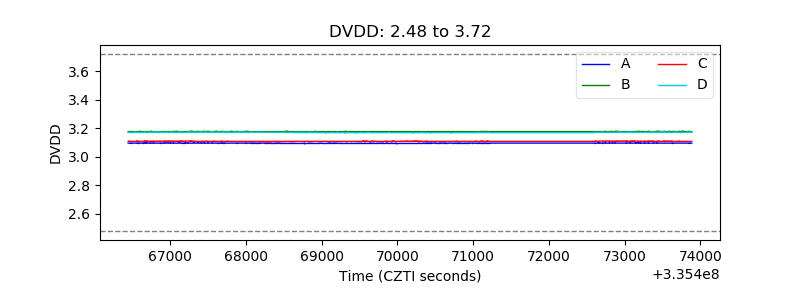 |
| Temperature 1 | 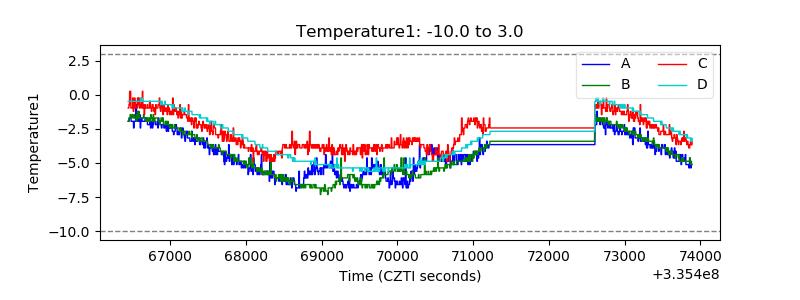 |
| Veto HV Monitor |  |
| Veto LLD |  |
| Alpha Counter | 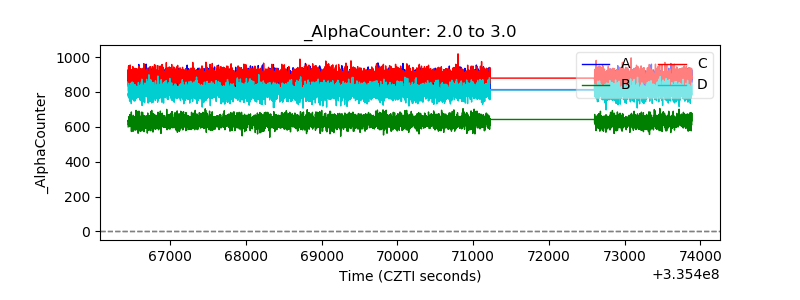 |
| _CPM_Rate | 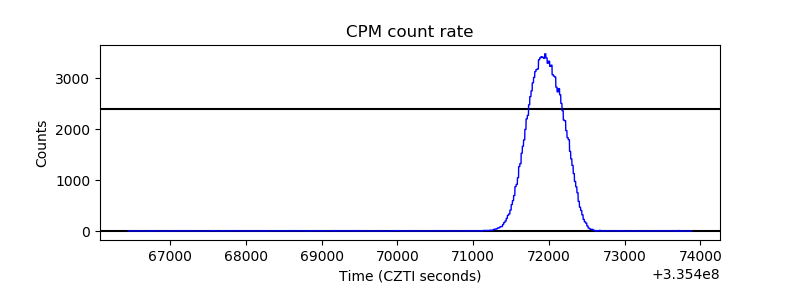 |
| CZT Counter | 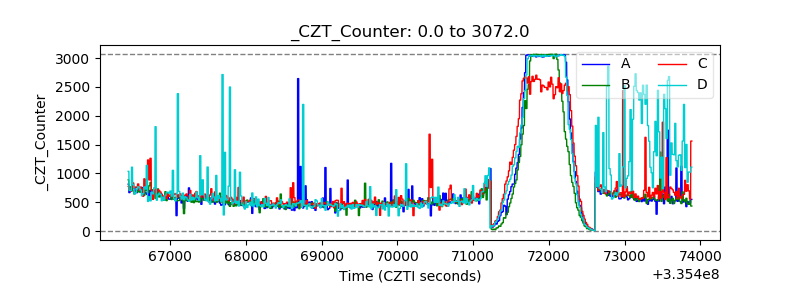 |
| +2.5 Volts monitor |  |
| +5 Volts monitor | 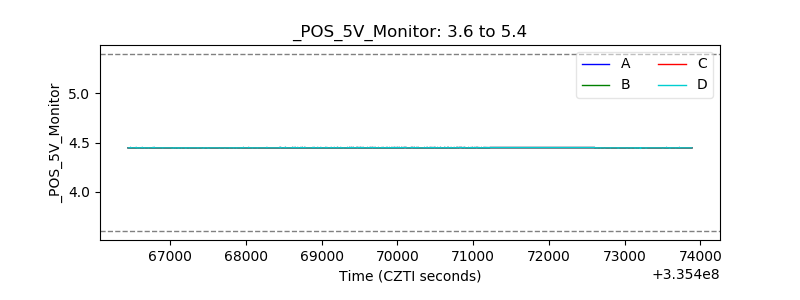 |
| _ROLL_ROT | 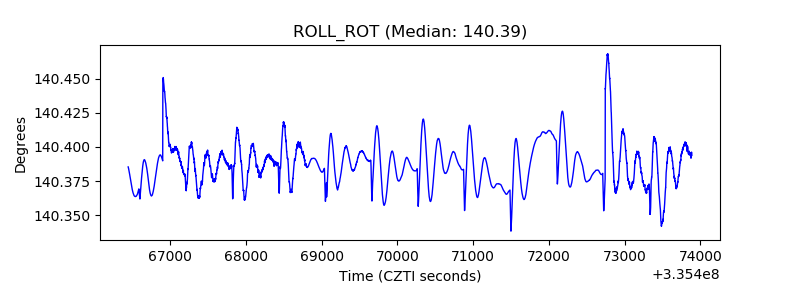 |
| _Roll_DEC |  |
| _Roll_RA | 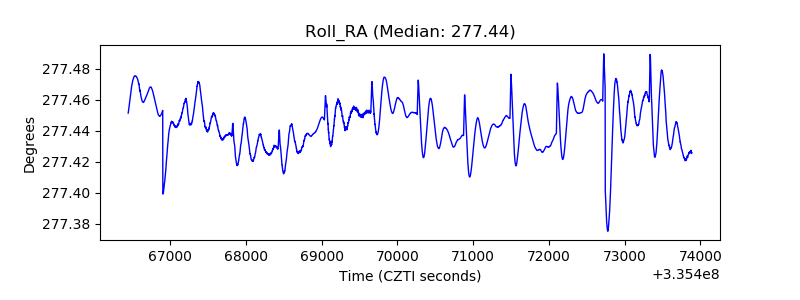 |
| Veto Counter | 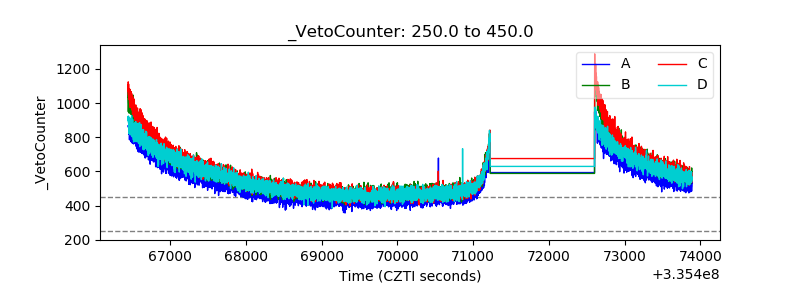 |