| Param | Original file | Final file |
|---|---|---|
| Filename | modeM0/AS1A09_056T01_9000003824_26446cztM0_level2.evt | modeM0/AS1A09_056T01_9000003824_26446cztM0_level2_quad_clean.evt |
| Size (bytes) | 552,340,800 | 99,812,160 |
| Size | 526.8 MB | 95.2 MB |
| Events in quadrant A | 3,287,259 | 665,322 |
| Events in quadrant B | 3,193,317 | 687,099 |
| Events in quadrant C | 3,503,514 | 653,427 |
| Events in quadrant D | 6,329,917 | 590,549 |
| Mode M9 | |||
|---|---|---|---|
| Quadrant | BADHDUFLAG | Total packets | Discarded packets |
| A | 0 | 14 | 0 |
| B | 0 | 14 | 0 |
| C | 0 | 14 | 0 |
| D | 0 | 14 | 0 |
| Mode M0 | |||
|---|---|---|---|
| Quadrant | BADHDUFLAG | Total packets | Discarded packets |
| A | 0 | 13602 | 0 |
| B | 0 | 13281 | 0 |
| C | 0 | 14373 | 0 |
| D | 0 | 22866 | 0 |
| Quadrant | Total seconds | Saturated seconds | Saturation percentage |
|---|---|---|---|
| A | 6104 | 51 | 0.835518% |
| B | 6103 | 26 | 0.426020% |
| C | 6103 | 147 | 2.408651% |
| D | 6103 | 970 | 15.893823% |
Noise dominated data is calculated using 1-second bins in cleaned event files. If a bin has >2000 counts, and if more than 50% of those come from <1% of pixels, then it is considered to be noise-dominated and hence unusable.
| Quadrant | # 1 sec bins | Bins with >0 counts | Bins with >2000 counts | High rate bins dominated by noise | Noise dominated (total time) | Noise dominated (detector-on time) | Marked lightcurve |
|---|---|---|---|---|---|---|---|
| A | 7529 | 6105 | 22 | 22 | 0.29% | 0.36% | 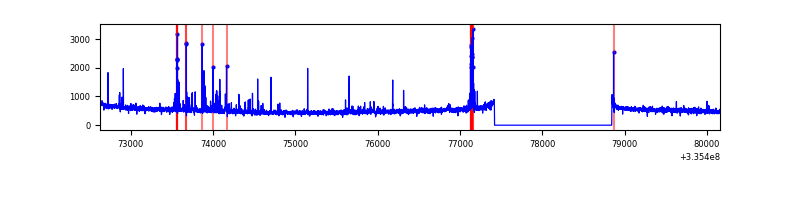 |
| B | 7528 | 6104 | 1 | 1 | 0.01% | 0.02% | 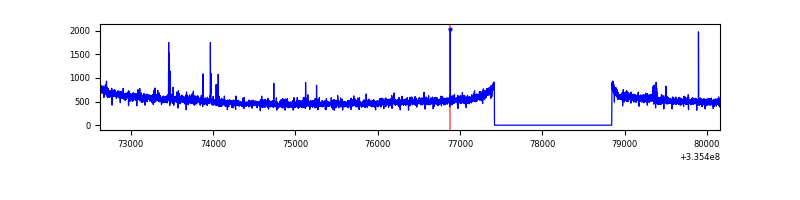 |
| C | 7528 | 6104 | 26 | 26 | 0.35% | 0.43% | 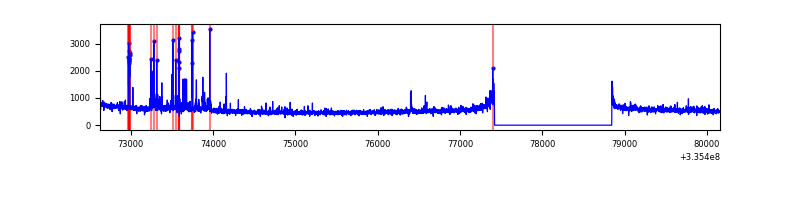 |
| D | 7528 | 6104 | 900 | 900 | 11.96% | 14.74% | 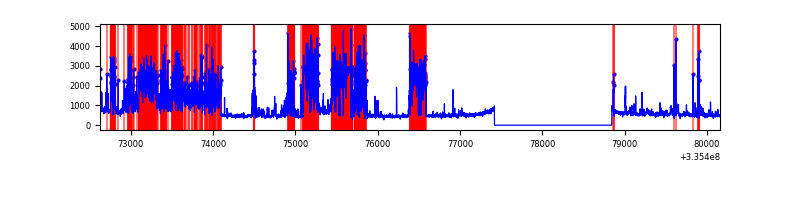 |
Top three noisy pixels from each quadrant. If the there are fewer than three noisy pixels in the level2.evt file, extra rows are filled as -1
| Pixel properties | Quadrant properties | ||||||
|---|---|---|---|---|---|---|---|
| Quadrant | DetID | PixID | Counts | Sigma | Mean | Median | Sigma |
| A | 0 | 13 | 190861 | 1209.38 | 800 | 787 | 157.2 |
| A | 13 | 254 | 9462 | 55.2 | 800 | 787 | 157.2 |
| A | 12 | 189 | 7305 | 41.47 | 800 | 787 | 157.2 |
| B | 12 | 111 | 16866 | 109.91 | 805 | 788 | 146.3 |
| B | 7 | 205 | 16692 | 108.72 | 805 | 788 | 146.3 |
| B | 5 | 172 | 15128 | 98.03 | 805 | 788 | 146.3 |
| C | 14 | 238 | 128283 | 697.08 | 787 | 795 | 182.9 |
| C | 2 | 16 | 117829 | 639.92 | 787 | 795 | 182.9 |
| C | 3 | 233 | 95415 | 517.36 | 787 | 795 | 182.9 |
| D | 7 | 80 | 2570677 | 14896.67 | 735 | 720 | 172.5 |
| D | 1 | 52 | 667182 | 3863.12 | 735 | 720 | 172.5 |
| D | 12 | 233 | 167307 | 965.62 | 735 | 720 | 172.5 |
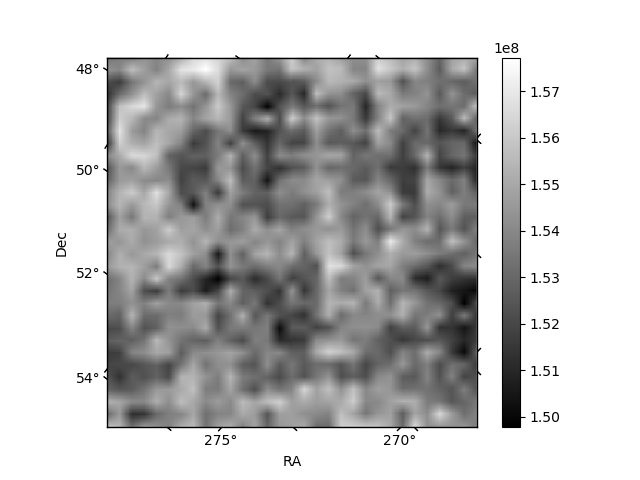
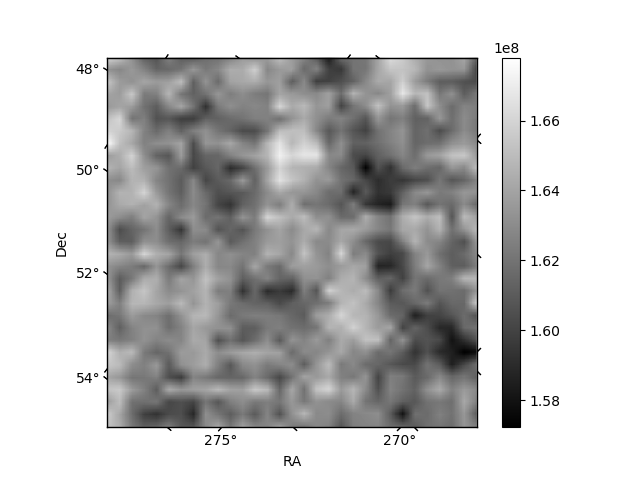
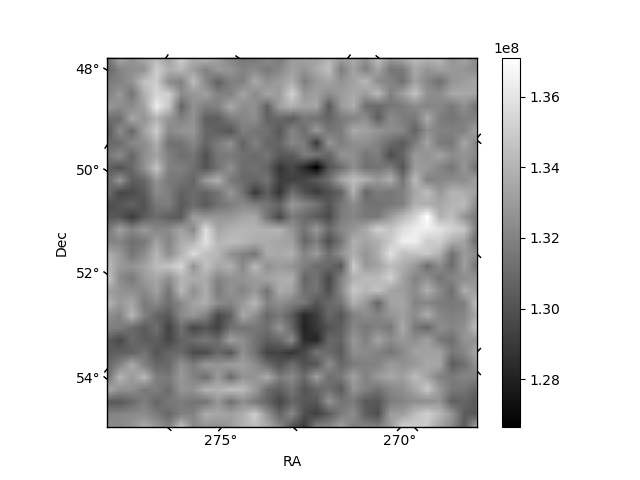
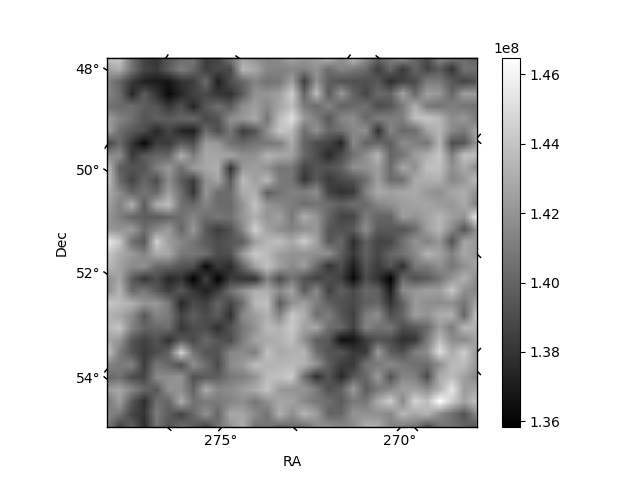
Histogram calculated using DETX and DETY for each event in the final _common_clean file
| Quadrant A | 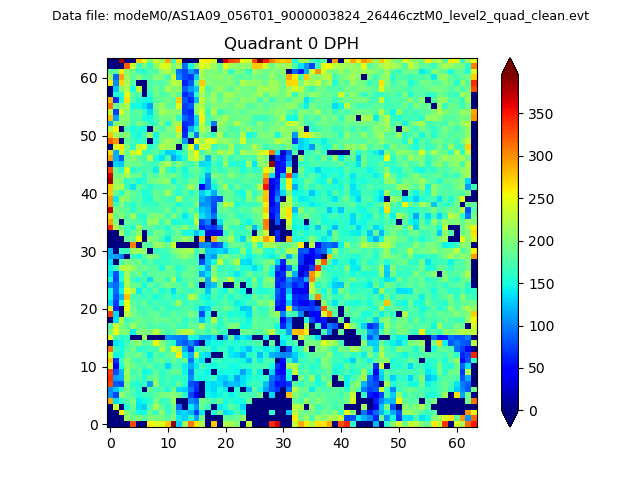 |
 |
Quadrant B |
|---|---|---|---|
| Quadrant D | 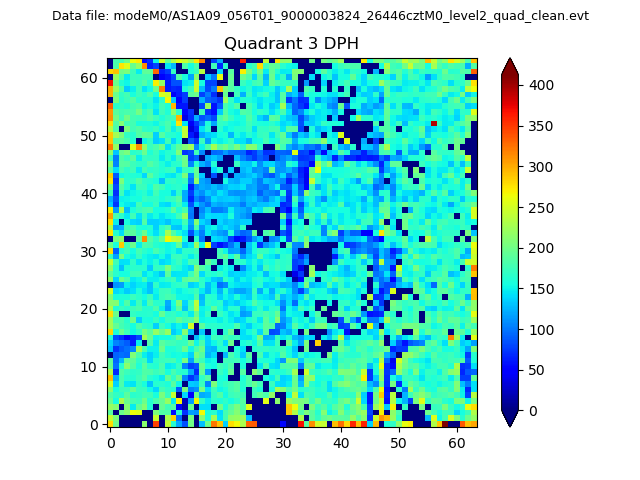 |
 |
Quadrant C |
| Plot type | Count rate plots | Images |
|---|---|---|
| Comparison with Poisson distribution Blue bars denote a histogram of data divided into 1 sec bins. Red curve is a Poisson curve with rate = median count rate of data. |
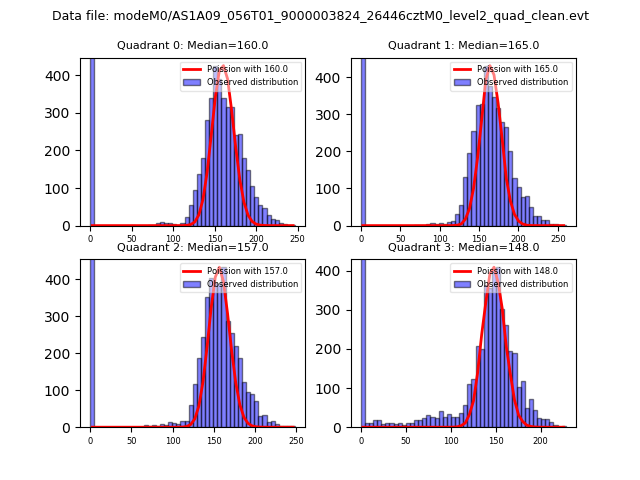 |
 |
| Quadrant-wise count rates Data is divided into 100 sec bins |
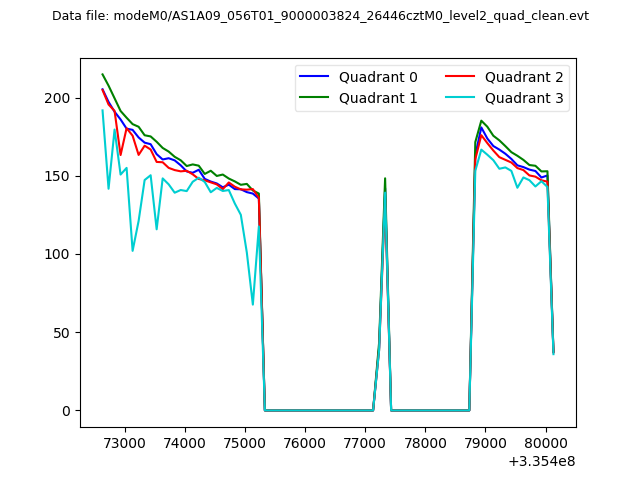 |
|
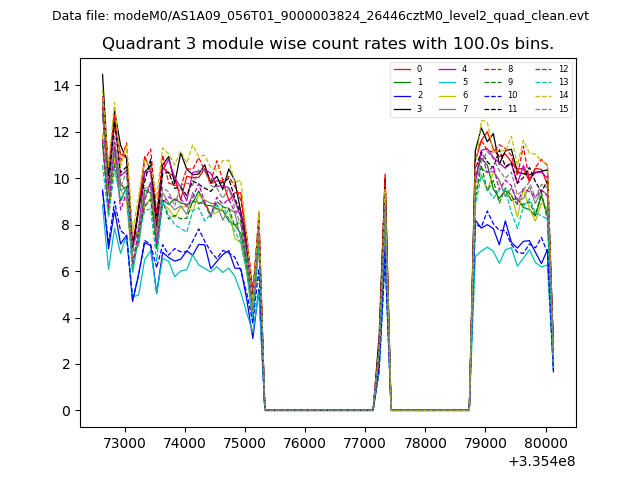
| Module-wise count rates for Quadrant A Data is divided into 100 sec bins |
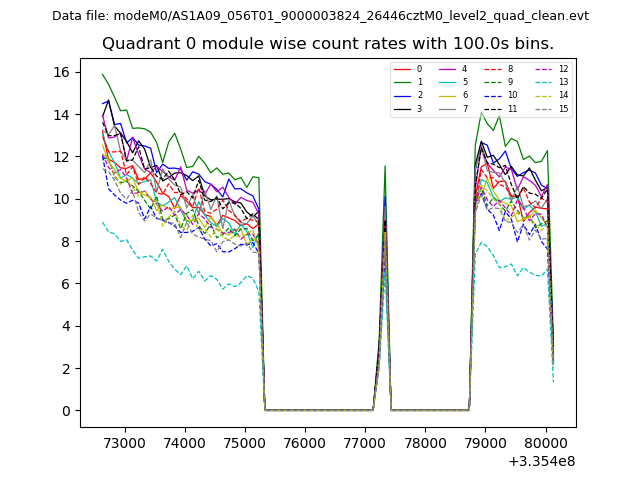 |
 |
| Module-wise count rates for Quadrant B Data is divided into 100 sec bins |
 |
 |
| Module-wise count rates for Quadrant C Data is divided into 100 sec bins |
 |
 |
| Module-wise count rates for Quadrant D Data is divided into 100 sec bins |
 |
 |
| Parameter | Plot |
|---|---|
| CZT HV Monitor | 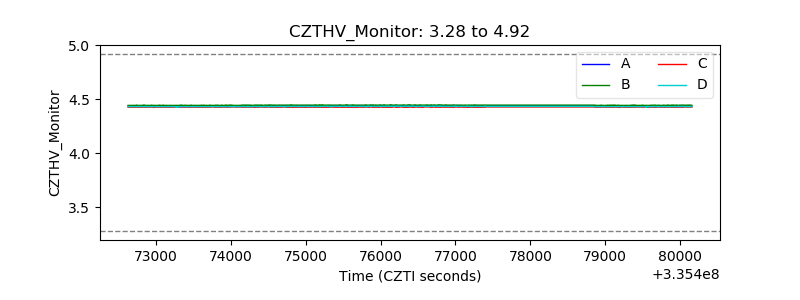 |
| D_VDD | 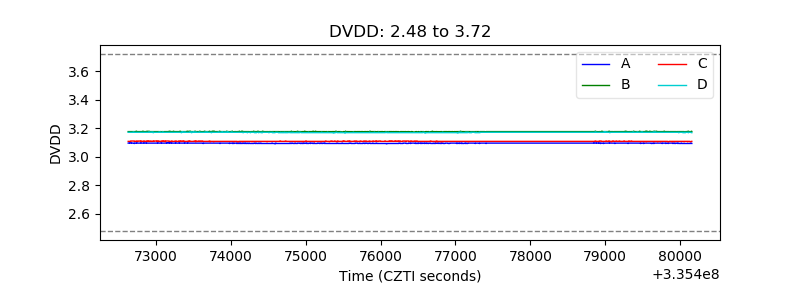 |
| Temperature 1 | 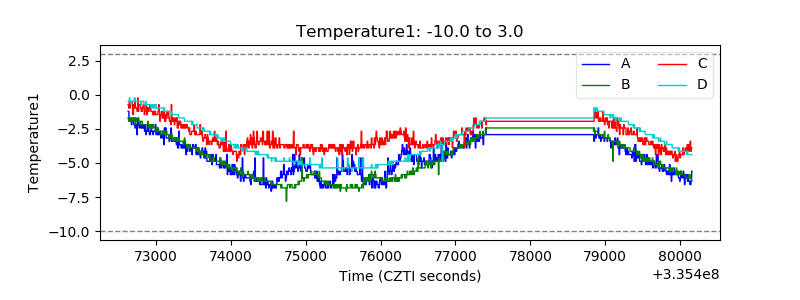 |
| Veto HV Monitor | 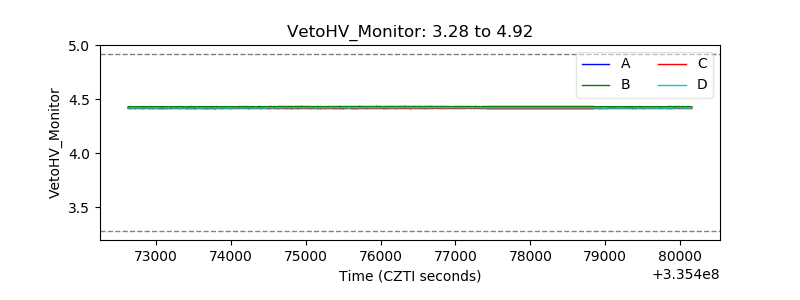 |
| Veto LLD | 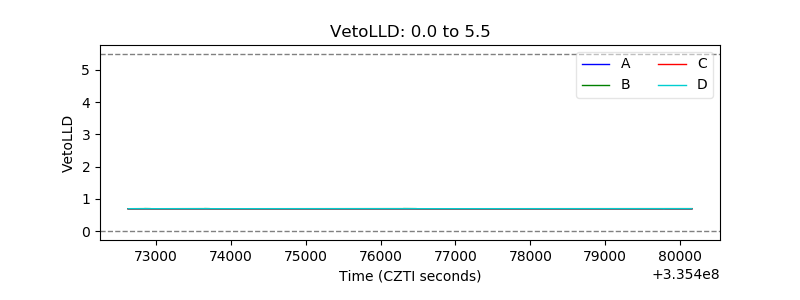 |
| Alpha Counter |  |
| _CPM_Rate | 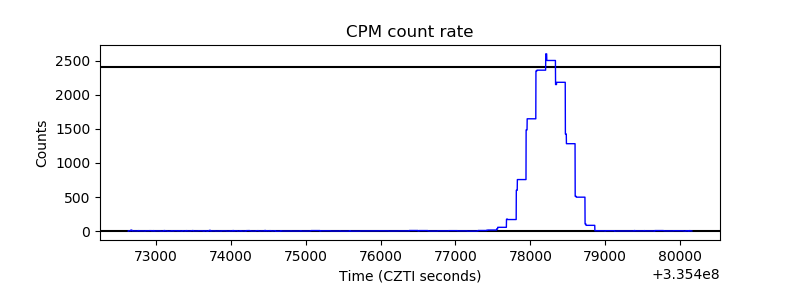 |
| CZT Counter |  |
| +2.5 Volts monitor |  |
| +5 Volts monitor | 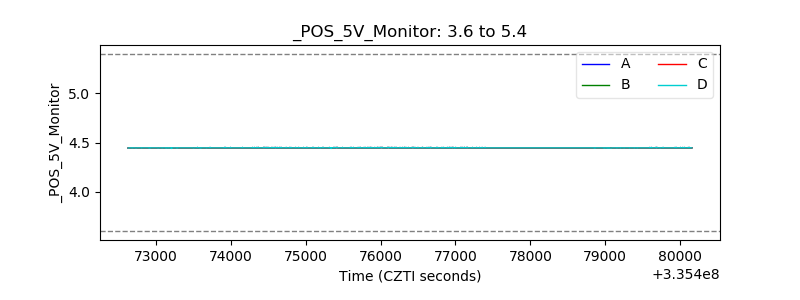 |
| _ROLL_ROT | 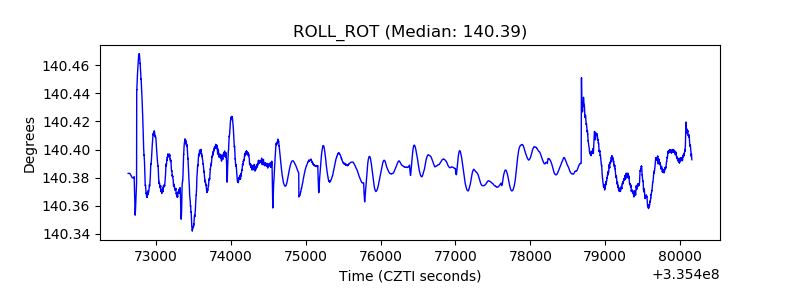 |
| _Roll_DEC | 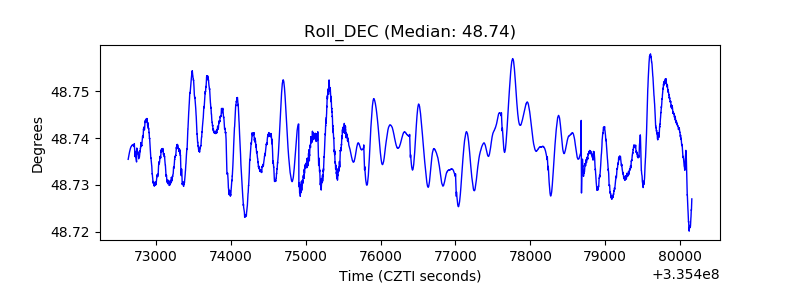 |
| _Roll_RA |  |
| Veto Counter | 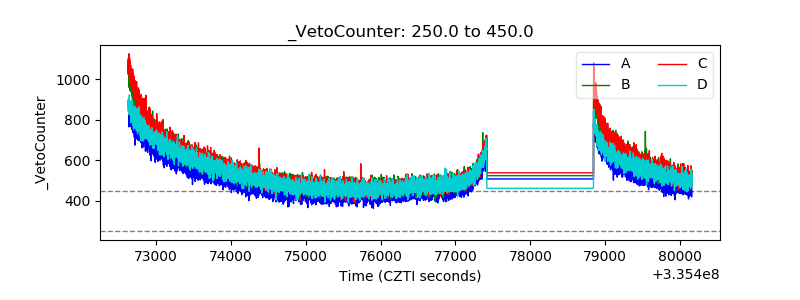 |