| Param | Original file | Final file |
|---|---|---|
| Filename | modeM0/AS1A09_056T01_9000003824_26447cztM0_level2.evt | modeM0/AS1A09_056T01_9000003824_26447cztM0_level2_quad_clean.evt |
| Size (bytes) | 474,359,040 | 98,628,480 |
| Size | 452.4 MB | 94.1 MB |
| Events in quadrant A | 3,174,661 | 646,058 |
| Events in quadrant B | 3,200,578 | 666,410 |
| Events in quadrant C | 3,414,171 | 637,677 |
| Events in quadrant D | 4,148,151 | 596,450 |
| Mode M9 | |||
|---|---|---|---|
| Quadrant | BADHDUFLAG | Total packets | Discarded packets |
| A | 0 | 14 | 0 |
| B | 0 | 15 | 0 |
| C | 0 | 15 | 0 |
| D | 0 | 15 | 0 |
| Mode M0 | |||
|---|---|---|---|
| Quadrant | BADHDUFLAG | Total packets | Discarded packets |
| A | 0 | 13470 | 0 |
| B | 0 | 13433 | 0 |
| C | 0 | 14023 | 0 |
| D | 0 | 16568 | 0 |
| Quadrant | Total seconds | Saturated seconds | Saturation percentage |
|---|---|---|---|
| A | 6309 | 42 | 0.665716% |
| B | 6309 | 52 | 0.824219% |
| C | 6309 | 108 | 1.711840% |
| D | 6309 | 322 | 5.103820% |
Noise dominated data is calculated using 1-second bins in cleaned event files. If a bin has >2000 counts, and if more than 50% of those come from <1% of pixels, then it is considered to be noise-dominated and hence unusable.
| Quadrant | # 1 sec bins | Bins with >0 counts | Bins with >2000 counts | High rate bins dominated by noise | Noise dominated (total time) | Noise dominated (detector-on time) | Marked lightcurve |
|---|---|---|---|---|---|---|---|
| A | 7574 | 6310 | 13 | 13 | 0.17% | 0.21% | 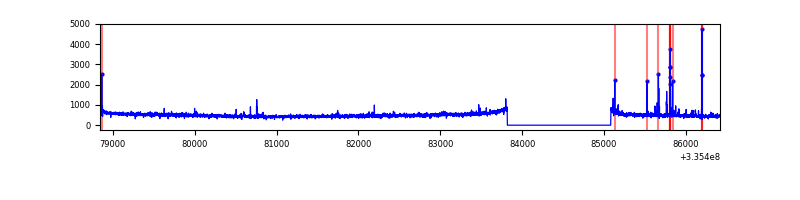 |
| B | 7574 | 6310 | 3 | 3 | 0.04% | 0.05% | 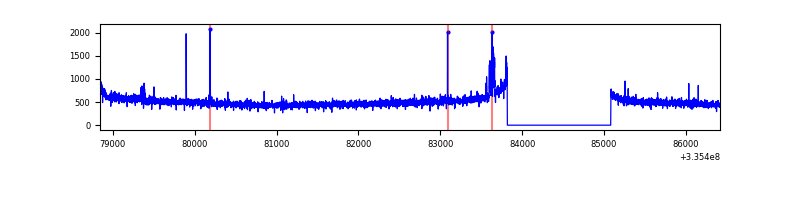 |
| C | 7574 | 6310 | 0 | 0 | 0.00% | 0.00% | 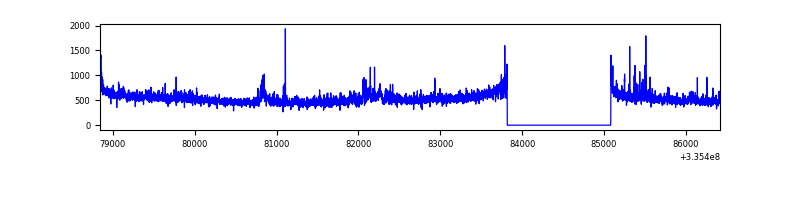 |
| D | 7574 | 6309 | 217 | 217 | 2.87% | 3.44% | 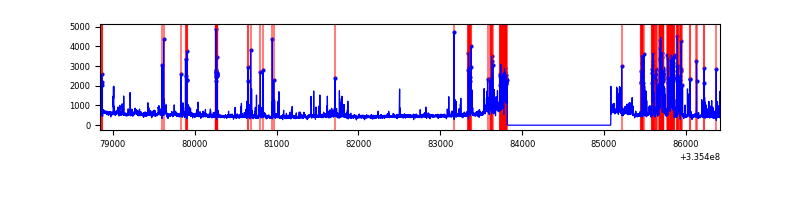 |
Top three noisy pixels from each quadrant. If the there are fewer than three noisy pixels in the level2.evt file, extra rows are filled as -1
| Pixel properties | Quadrant properties | ||||||
|---|---|---|---|---|---|---|---|
| Quadrant | DetID | PixID | Counts | Sigma | Mean | Median | Sigma |
| A | 0 | 13 | 104042 | 656.93 | 793 | 777 | 157.2 |
| A | 12 | 189 | 11257 | 66.67 | 793 | 777 | 157.2 |
| A | 13 | 254 | 9698 | 56.75 | 793 | 777 | 157.2 |
| B | 0 | 190 | 52373 | 344.22 | 801 | 782 | 149.9 |
| B | 12 | 111 | 17561 | 111.95 | 801 | 782 | 149.9 |
| B | 11 | 111 | 15498 | 98.19 | 801 | 782 | 149.9 |
| C | 3 | 233 | 221958 | 1222.27 | 779 | 786 | 181.0 |
| C | 14 | 238 | 124717 | 684.89 | 779 | 786 | 181.0 |
| C | 4 | 254 | 23351 | 124.7 | 779 | 786 | 181.0 |
| D | 12 | 233 | 605976 | 3375.27 | 757 | 740 | 179.3 |
| D | 1 | 52 | 269627 | 1499.53 | 757 | 740 | 179.3 |
| D | 7 | 80 | 197731 | 1098.58 | 757 | 740 | 179.3 |
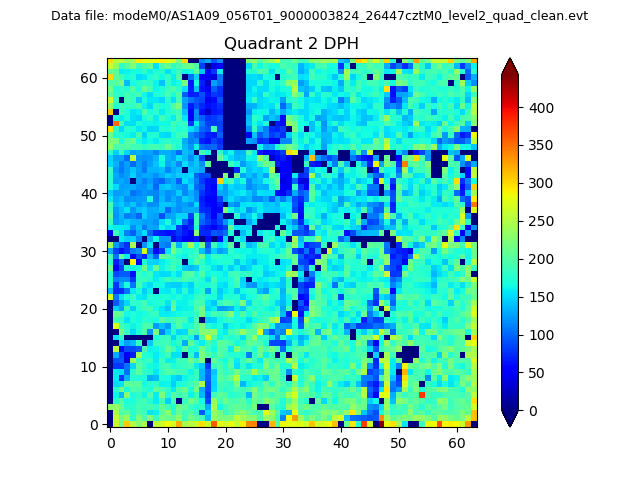
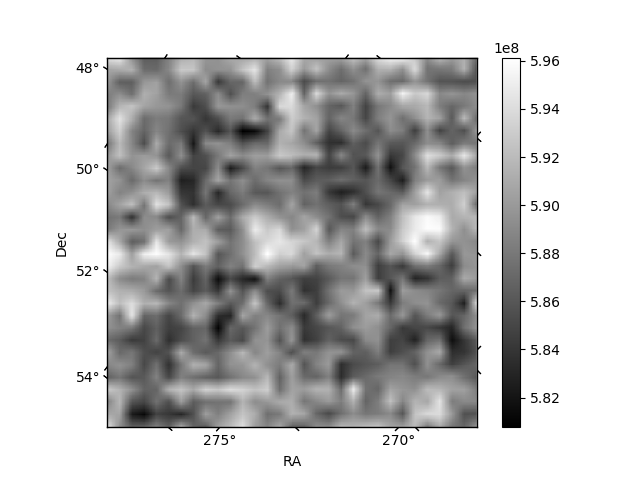
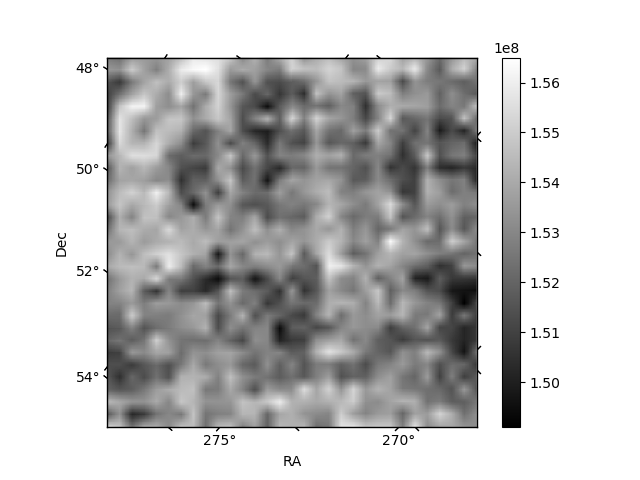
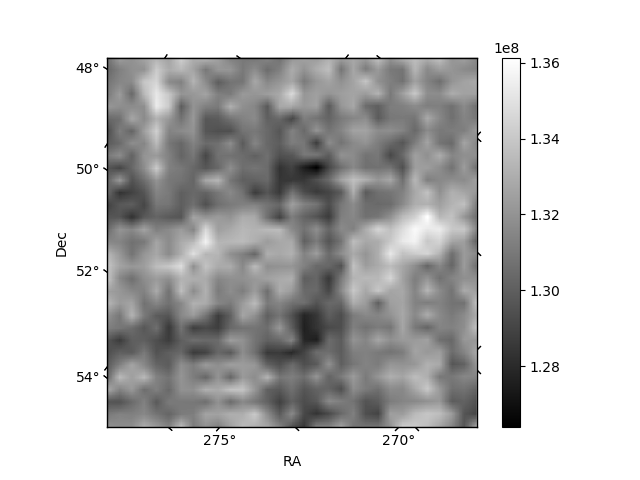
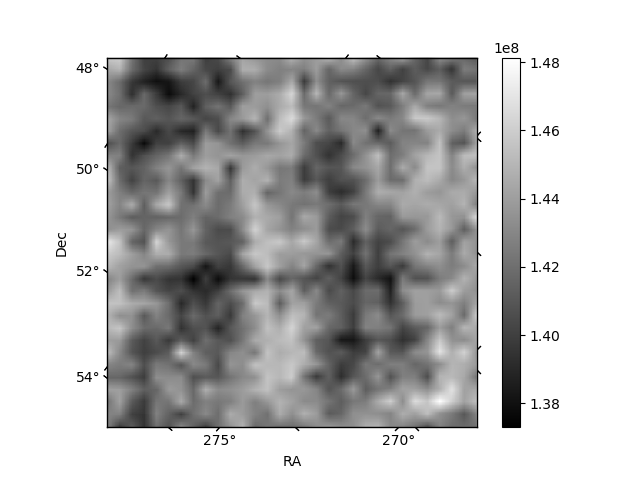
Histogram calculated using DETX and DETY for each event in the final _common_clean file
| Quadrant A | 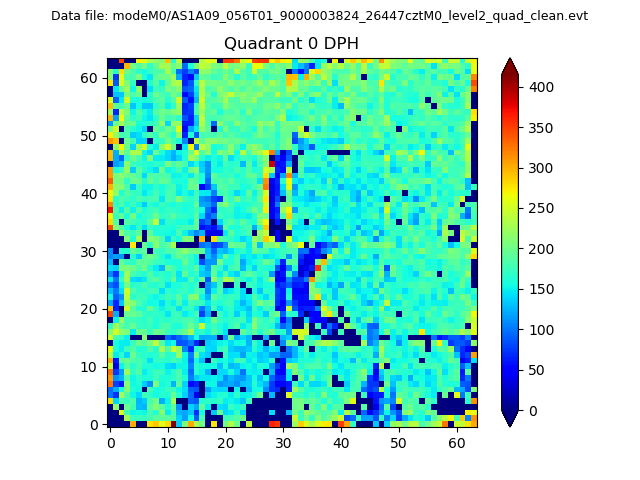 |
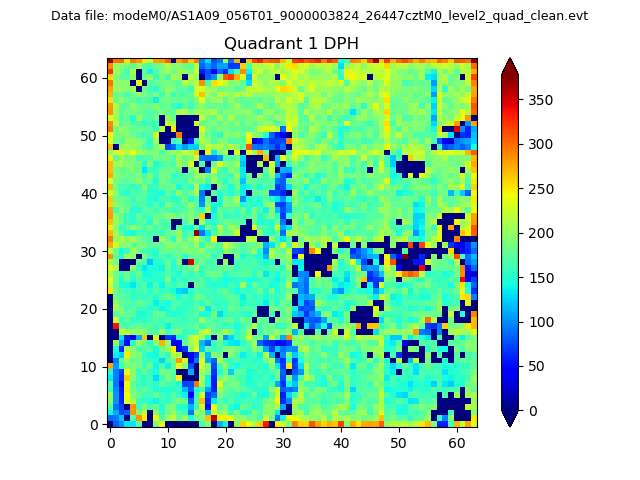 |
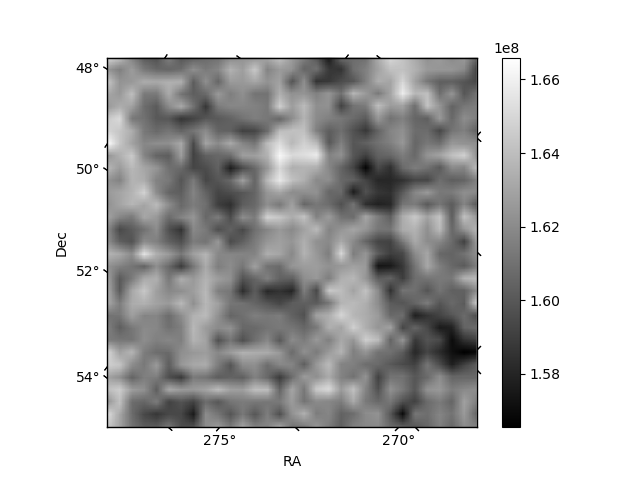
Quadrant B |
|---|---|---|---|
| Quadrant D | 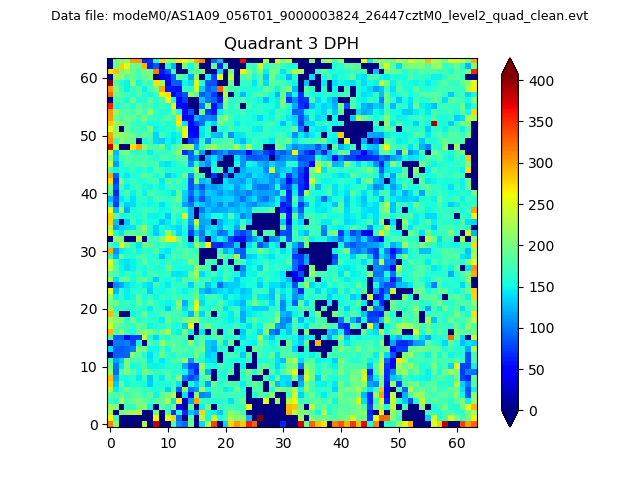 |
 |
Quadrant C |
| Plot type | Count rate plots | Images |
|---|---|---|
| Comparison with Poisson distribution Blue bars denote a histogram of data divided into 1 sec bins. Red curve is a Poisson curve with rate = median count rate of data. |
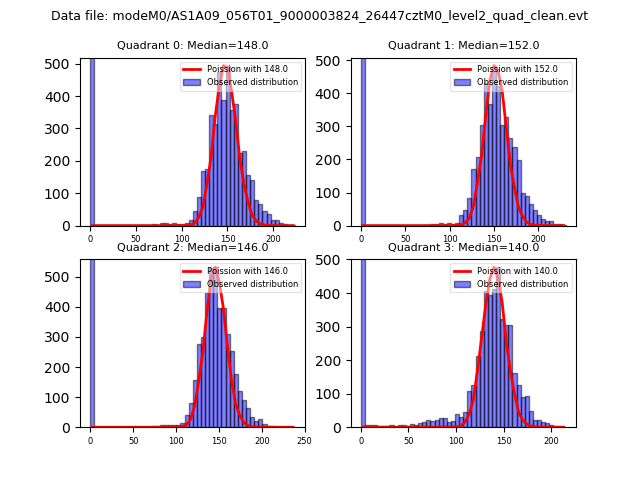 |
 |
| Quadrant-wise count rates Data is divided into 100 sec bins |
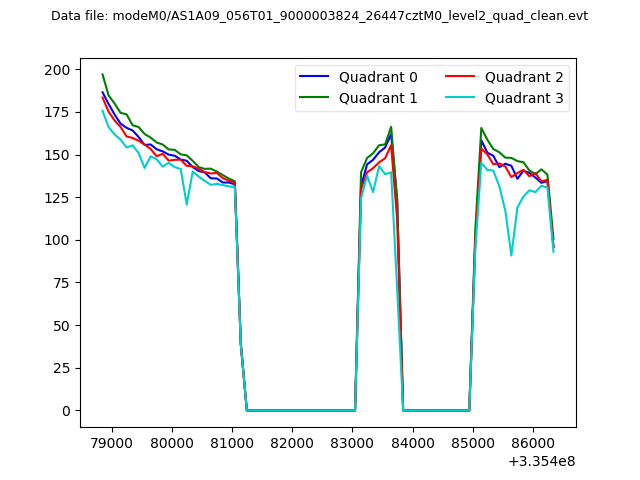 |
|
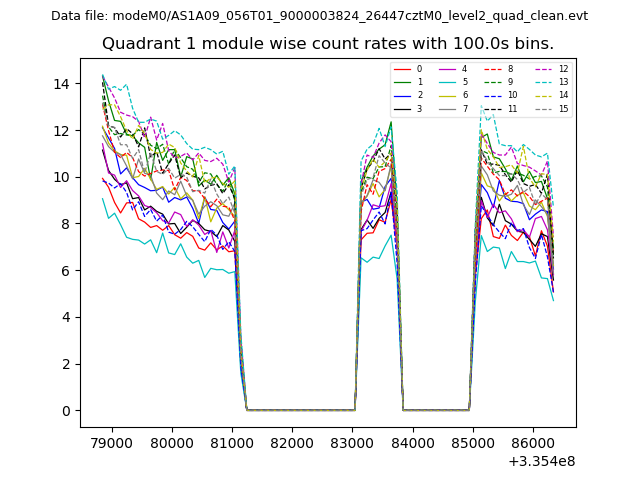
| Module-wise count rates for Quadrant A Data is divided into 100 sec bins |
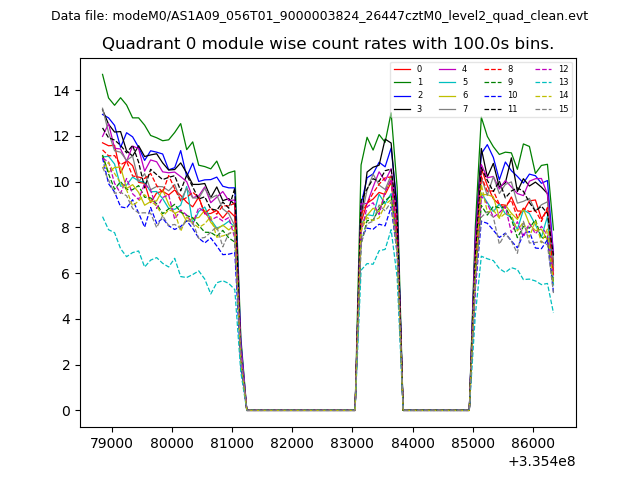 |
 |
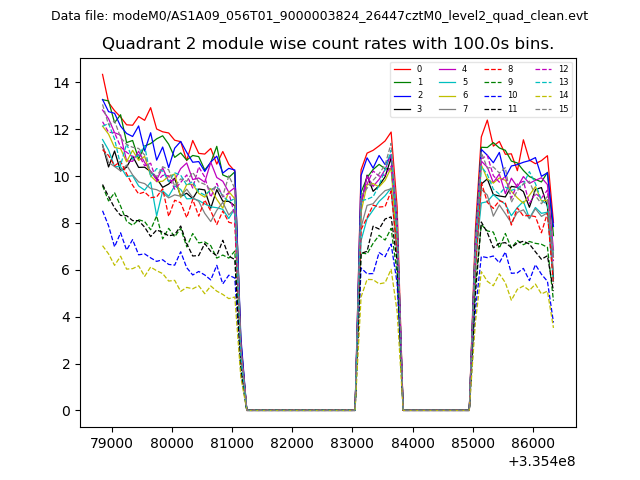
| Module-wise count rates for Quadrant B Data is divided into 100 sec bins |
 |
 |
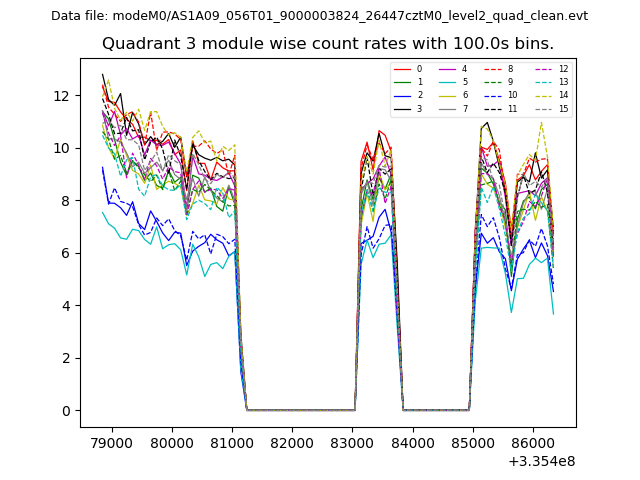
| Module-wise count rates for Quadrant C Data is divided into 100 sec bins |
 |
 |
| Module-wise count rates for Quadrant D Data is divided into 100 sec bins |
 |
 |
| Parameter | Plot |
|---|---|
| CZT HV Monitor | 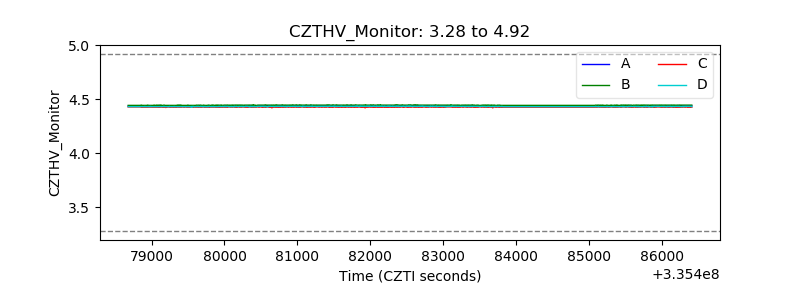 |
| D_VDD | 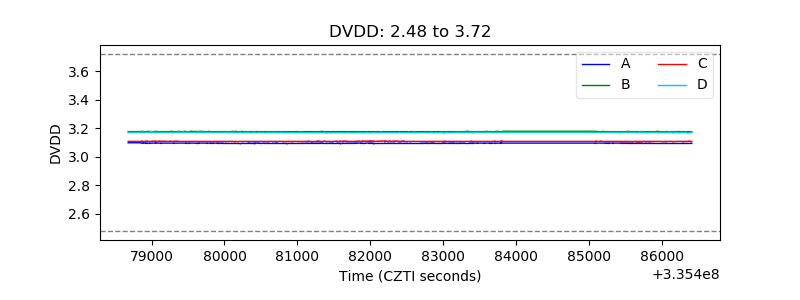 |
| Temperature 1 | 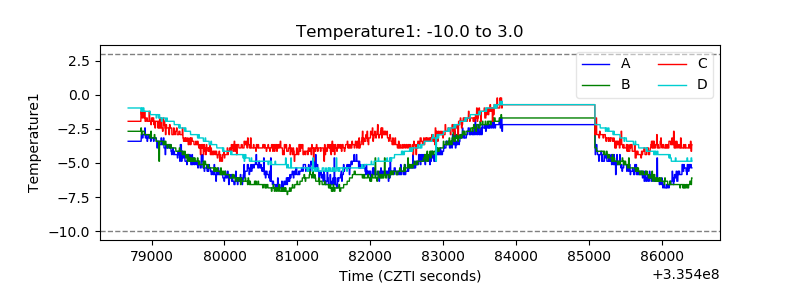 |
| Veto HV Monitor | 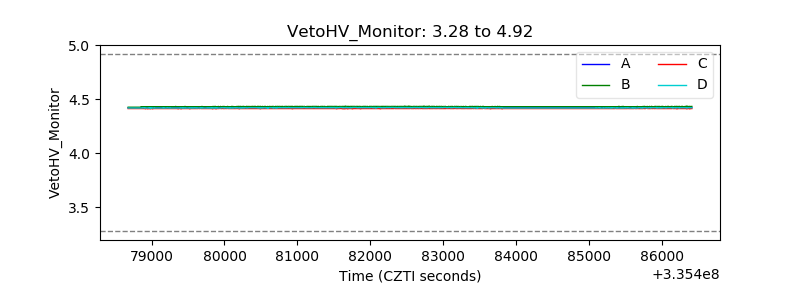 |
| Veto LLD | 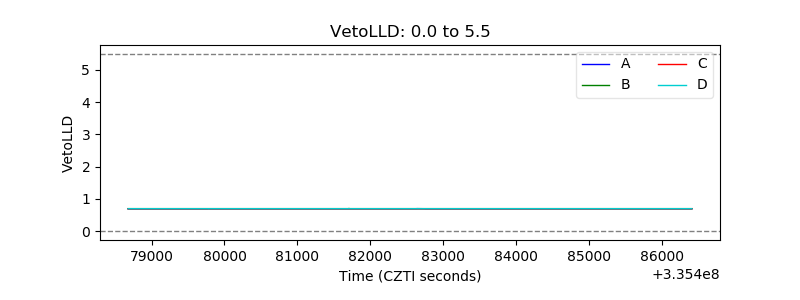 |
| Alpha Counter | 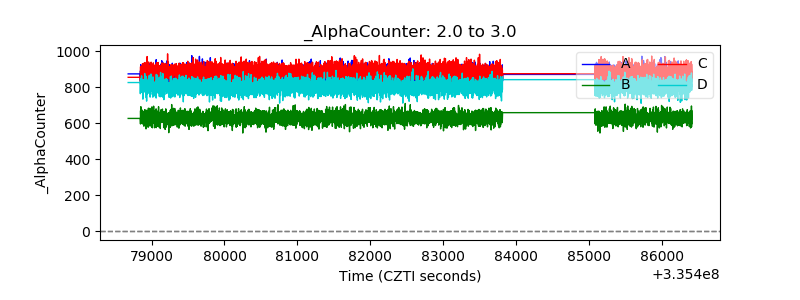 |
| _CPM_Rate | 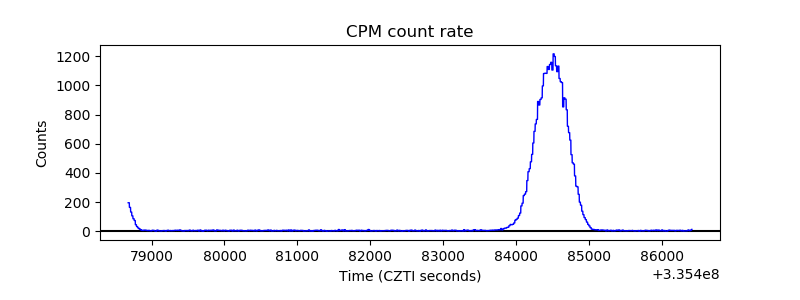 |
| CZT Counter | 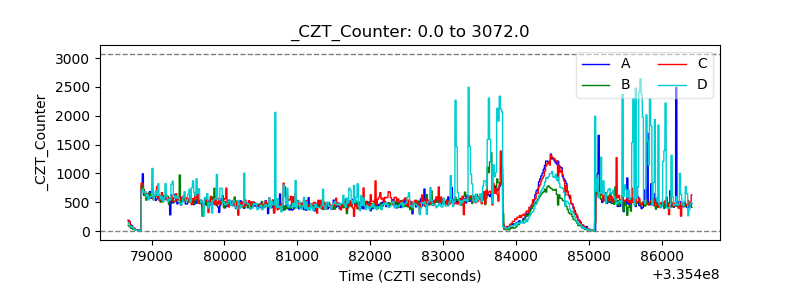 |
| +2.5 Volts monitor |  |
| +5 Volts monitor |  |
| _ROLL_ROT | 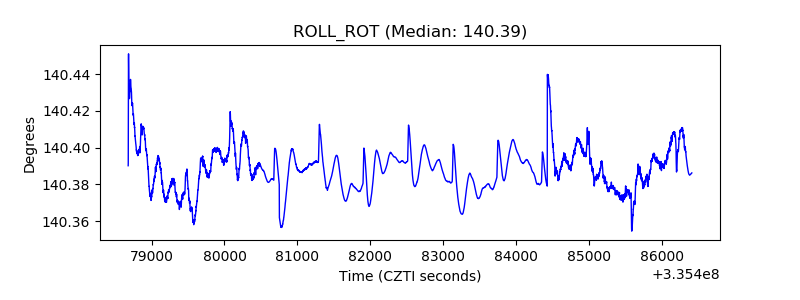 |
| _Roll_DEC | 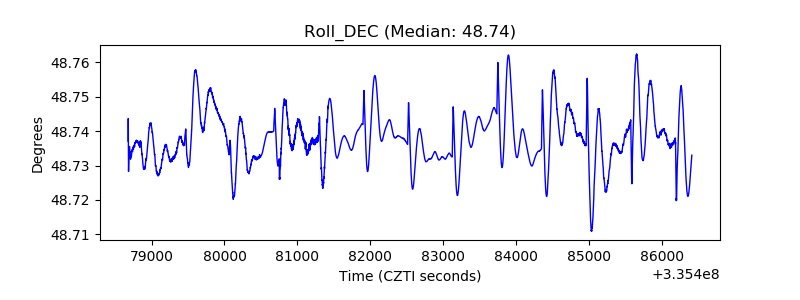 |
| _Roll_RA | 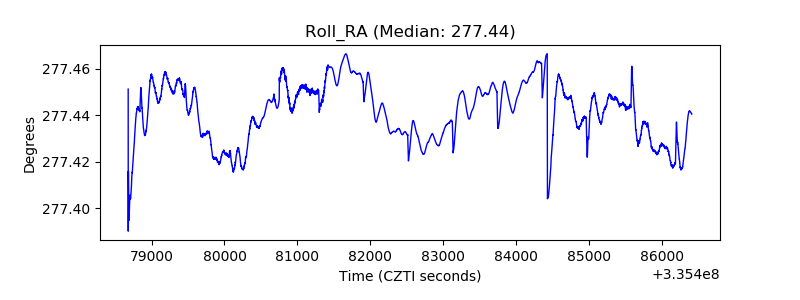 |
| Veto Counter | 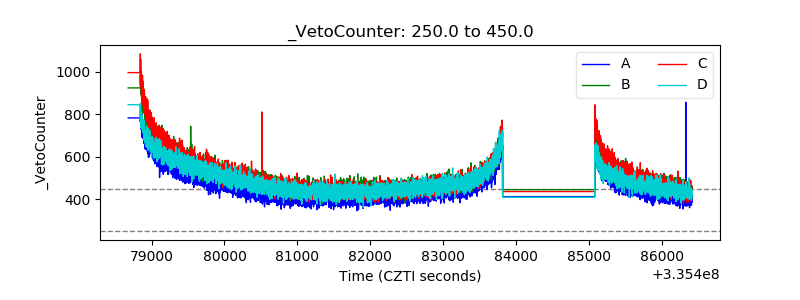 |