| Param | Original file | Final file |
|---|---|---|
| Filename | modeM0/AS1A09_056T01_9000003824_26450cztM0_level2.evt | modeM0/AS1A09_056T01_9000003824_26450cztM0_level2_quad_clean.evt |
| Size (bytes) | 598,492,800 | 107,645,760 |
| Size | 570.8 MB | 102.7 MB |
| Events in quadrant A | 3,736,640 | 686,719 |
| Events in quadrant B | 3,782,959 | 702,205 |
| Events in quadrant C | 4,538,479 | 664,311 |
| Events in quadrant D | 5,533,498 | 659,324 |
| Mode M9 | |||
|---|---|---|---|
| Quadrant | BADHDUFLAG | Total packets | Discarded packets |
| A | 0 | 5 | 0 |
| B | 0 | 5 | 0 |
| C | 0 | 5 | 0 |
| D | 0 | 5 | 0 |
| Mode M0 | |||
|---|---|---|---|
| Quadrant | BADHDUFLAG | Total packets | Discarded packets |
| A | 0 | 16365 | 0 |
| B | 0 | 16403 | 0 |
| C | 0 | 18542 | 0 |
| D | 0 | 21503 | 0 |
| Quadrant | Total seconds | Saturated seconds | Saturation percentage |
|---|---|---|---|
| A | 7867 | 219 | 2.783780% |
| B | 7868 | 236 | 2.999492% |
| C | 7868 | 389 | 4.944077% |
| D | 7868 | 467 | 5.935435% |
Noise dominated data is calculated using 1-second bins in cleaned event files. If a bin has >2000 counts, and if more than 50% of those come from <1% of pixels, then it is considered to be noise-dominated and hence unusable.
| Quadrant | # 1 sec bins | Bins with >0 counts | Bins with >2000 counts | High rate bins dominated by noise | Noise dominated (total time) | Noise dominated (detector-on time) | Marked lightcurve |
|---|---|---|---|---|---|---|---|
| A | 8377 | 7869 | 0 | 0 | 0.00% | 0.00% | 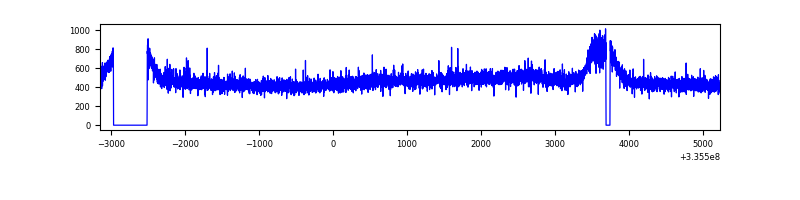 |
| B | 8378 | 7870 | 0 | 0 | 0.00% | 0.00% | 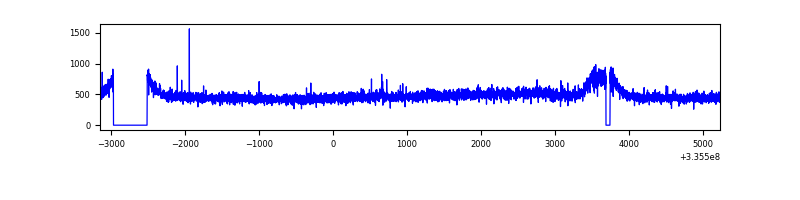 |
| C | 8378 | 7870 | 63 | 63 | 0.75% | 0.80% | 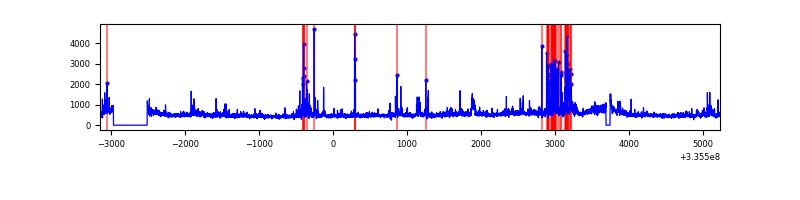 |
| D | 8378 | 7870 | 259 | 259 | 3.09% | 3.29% | 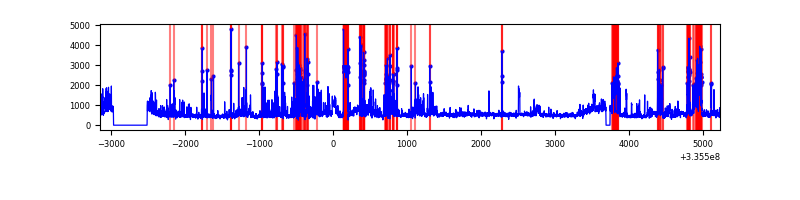 |
Top three noisy pixels from each quadrant. If the there are fewer than three noisy pixels in the level2.evt file, extra rows are filled as -1
| Pixel properties | Quadrant properties | ||||||
|---|---|---|---|---|---|---|---|
| Quadrant | DetID | PixID | Counts | Sigma | Mean | Median | Sigma |
| A | 12 | 189 | 14829 | 71.91 | 962 | 938 | 193.2 |
| A | 13 | 254 | 11010 | 52.14 | 962 | 938 | 193.2 |
| A | 12 | 16 | 10390 | 48.93 | 962 | 938 | 193.2 |
| B | 12 | 111 | 23100 | 118.83 | 962 | 934 | 186.5 |
| B | 11 | 111 | 20670 | 105.81 | 962 | 934 | 186.5 |
| B | 14 | 111 | 18438 | 93.84 | 962 | 934 | 186.5 |
| C | 3 | 233 | 349162 | 1576.78 | 930 | 931 | 220.8 |
| C | 2 | 16 | 248727 | 1122.02 | 930 | 931 | 220.8 |
| C | 4 | 254 | 173146 | 779.79 | 930 | 931 | 220.8 |
| D | 1 | 52 | 825703 | 3764.66 | 926 | 904 | 219.1 |
| D | 7 | 80 | 589436 | 2686.25 | 926 | 904 | 219.1 |
| D | 11 | 176 | 530528 | 2417.38 | 926 | 904 | 219.1 |
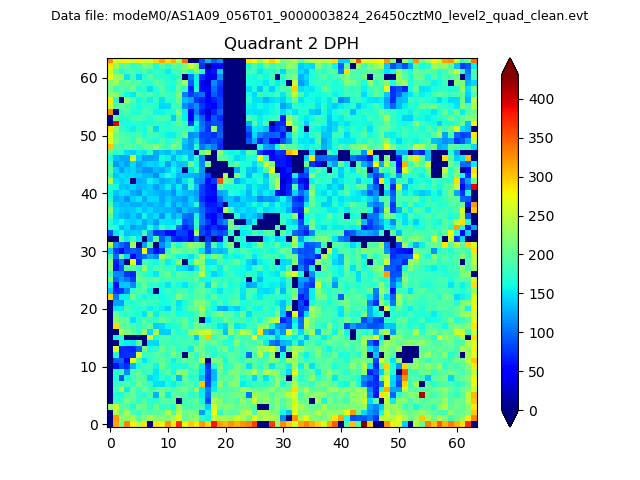
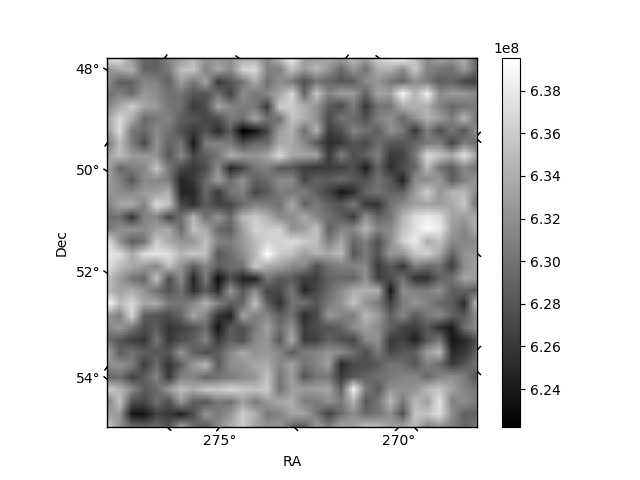
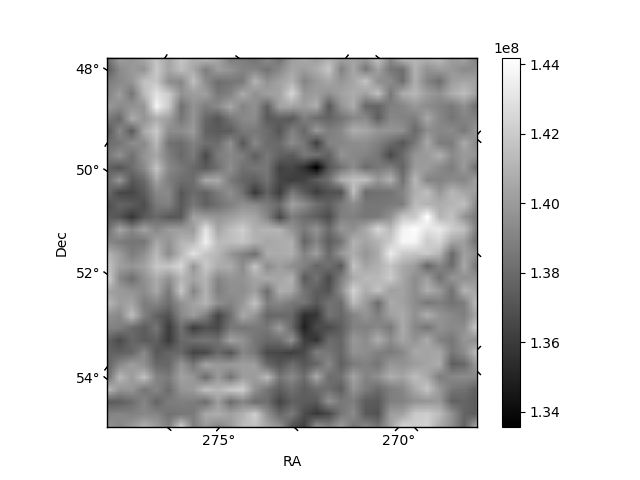
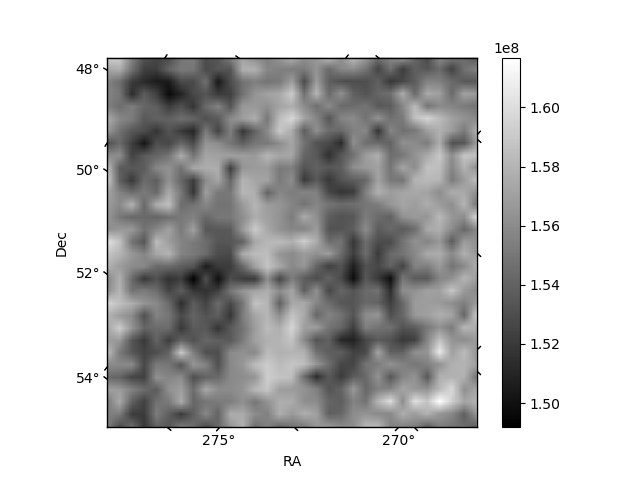
Histogram calculated using DETX and DETY for each event in the final _common_clean file
| Quadrant A | 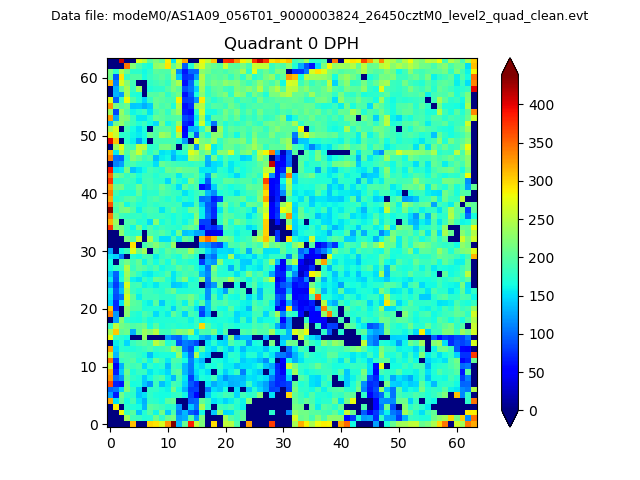 |
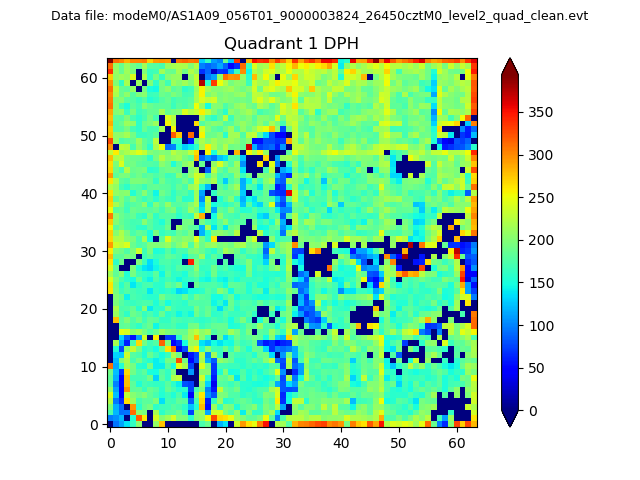 |
Quadrant B |
|---|---|---|---|
| Quadrant D | 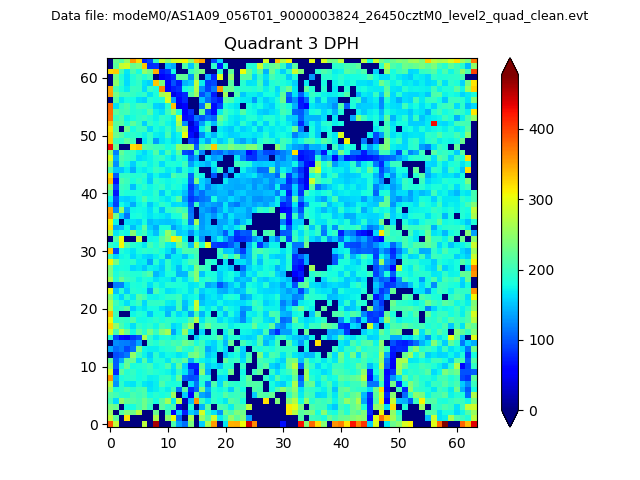 |
 |
Quadrant C |
| Plot type | Count rate plots | Images |
|---|---|---|
| Comparison with Poisson distribution Blue bars denote a histogram of data divided into 1 sec bins. Red curve is a Poisson curve with rate = median count rate of data. |
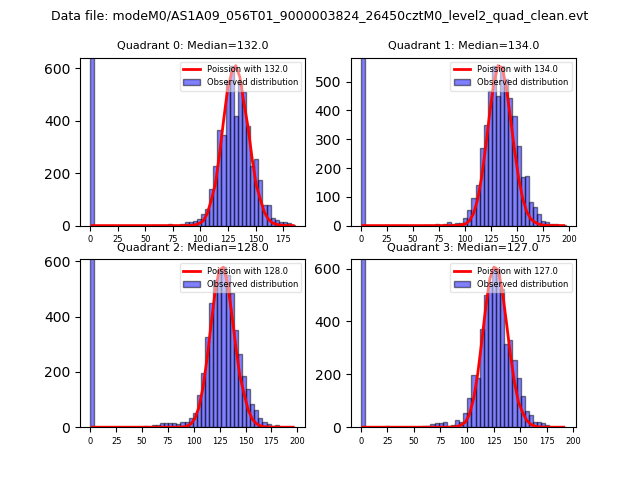 |
 |
| Quadrant-wise count rates Data is divided into 100 sec bins |
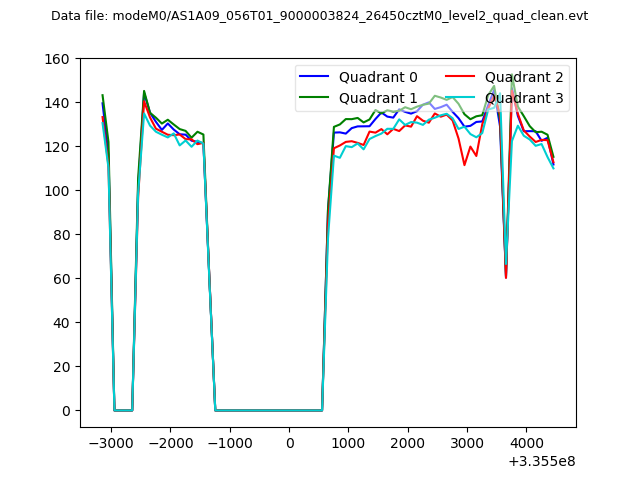 |
|
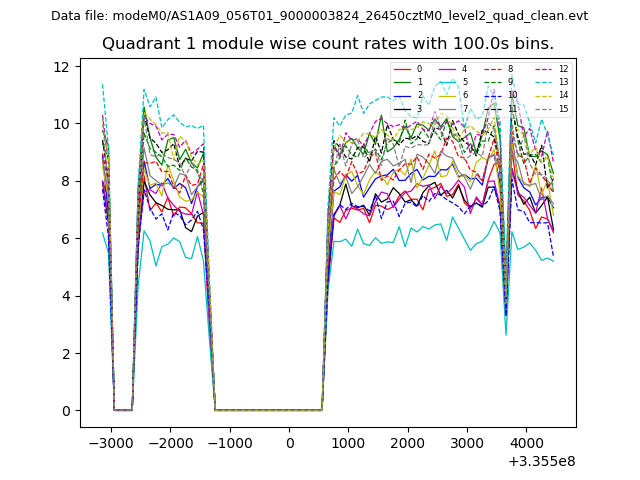
| Module-wise count rates for Quadrant A Data is divided into 100 sec bins |
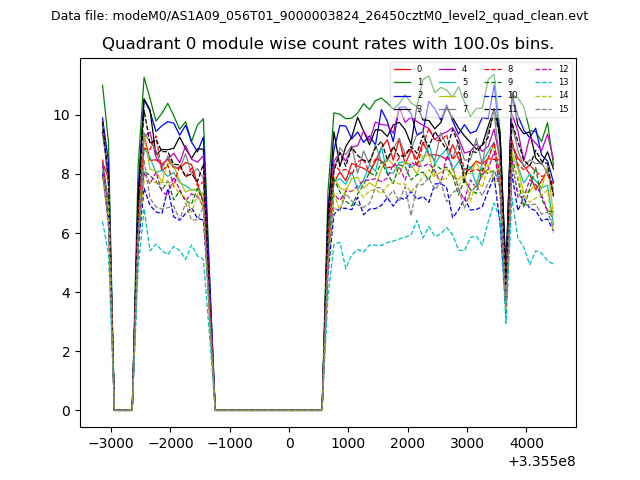 |
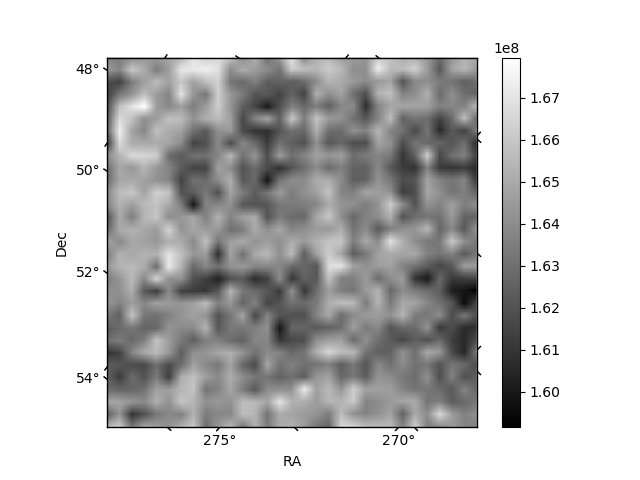 |
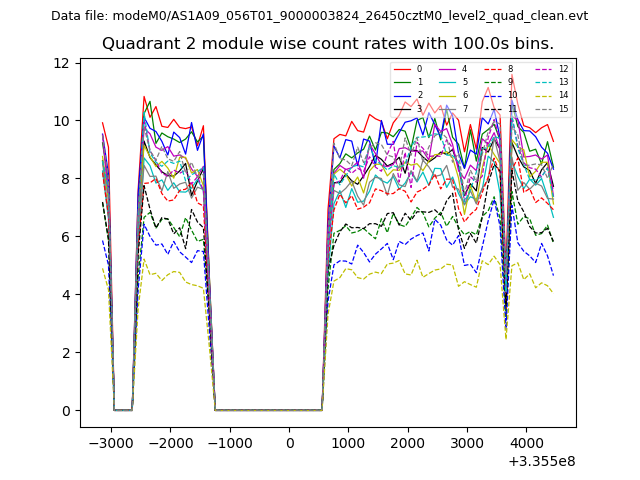
| Module-wise count rates for Quadrant B Data is divided into 100 sec bins |
 |
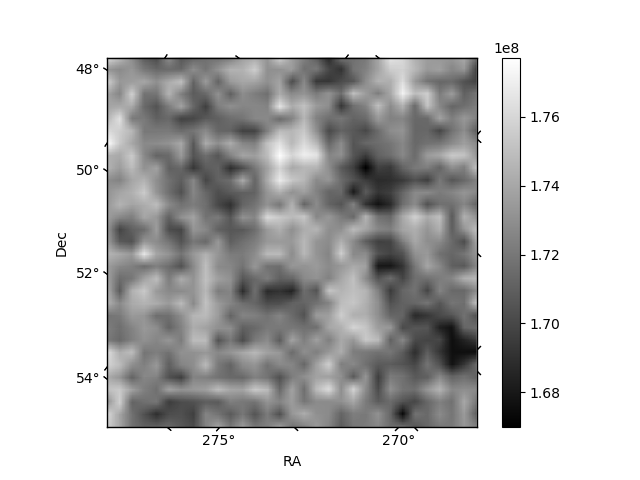 |
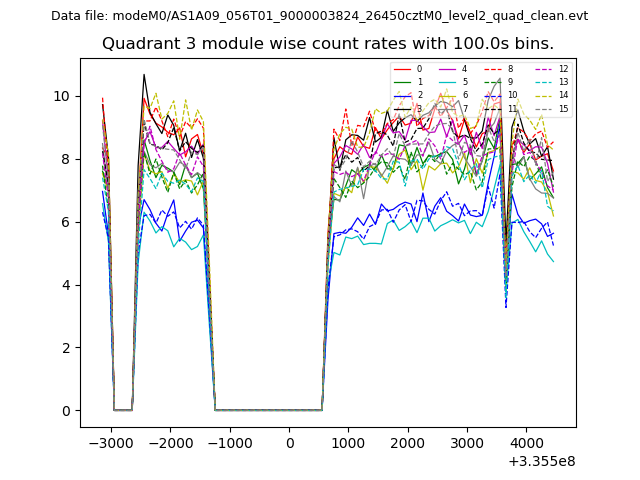
| Module-wise count rates for Quadrant C Data is divided into 100 sec bins |
 |
 |
| Module-wise count rates for Quadrant D Data is divided into 100 sec bins |
 |
 |
| Parameter | Plot |
|---|---|
| CZT HV Monitor | 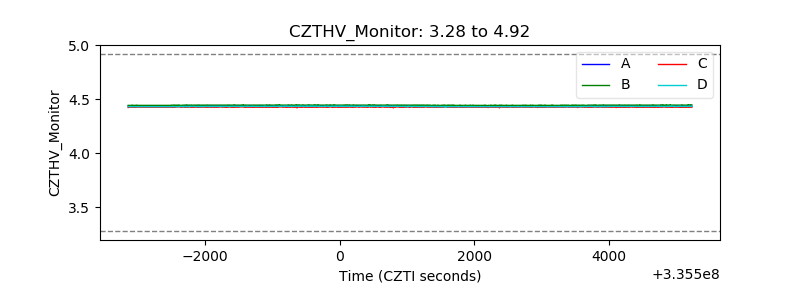 |
| D_VDD | 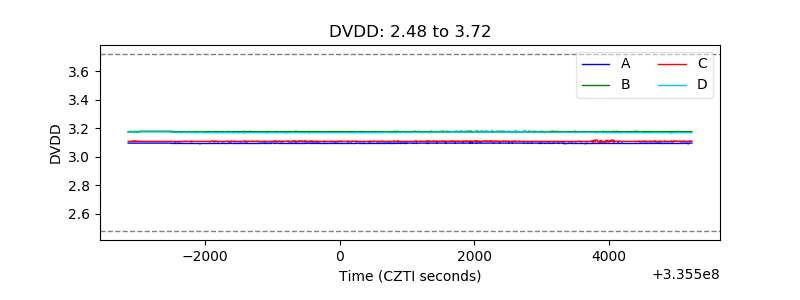 |
| Temperature 1 | 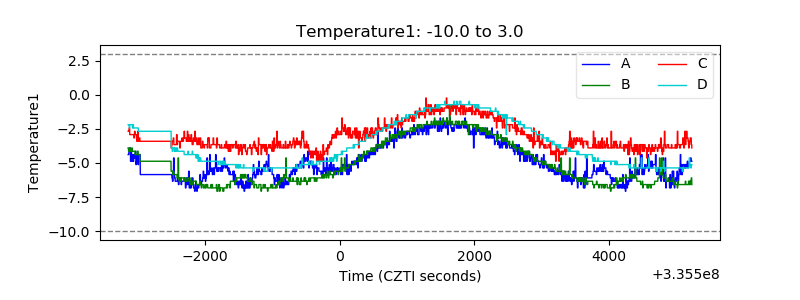 |
| Veto HV Monitor | 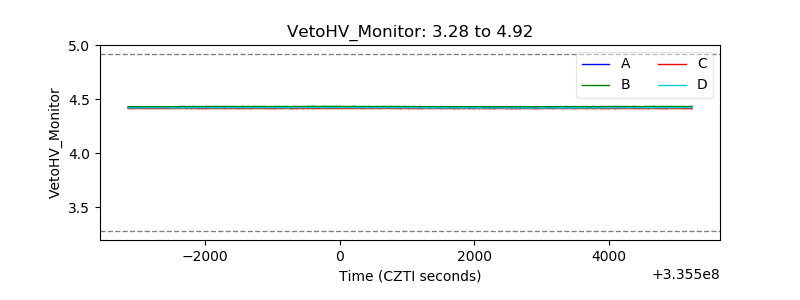 |
| Veto LLD |  |
| Alpha Counter | 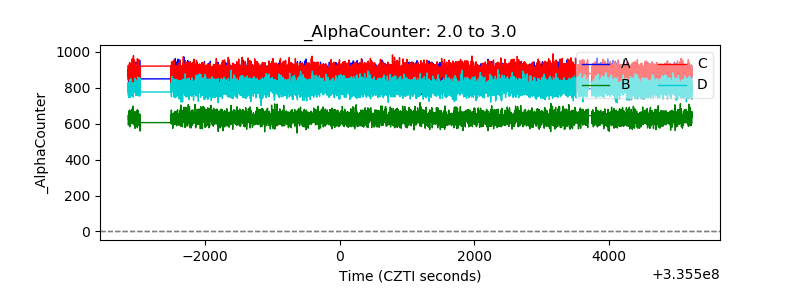 |
| _CPM_Rate | 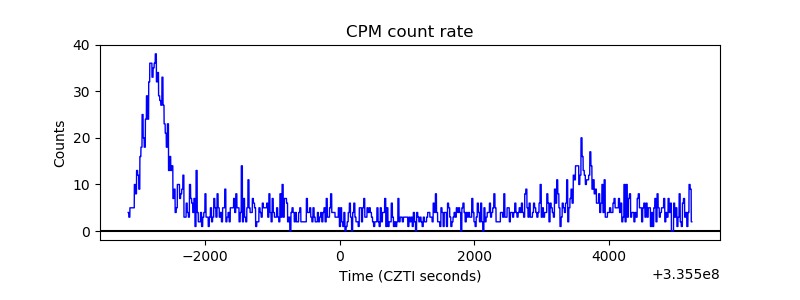 |
| CZT Counter | 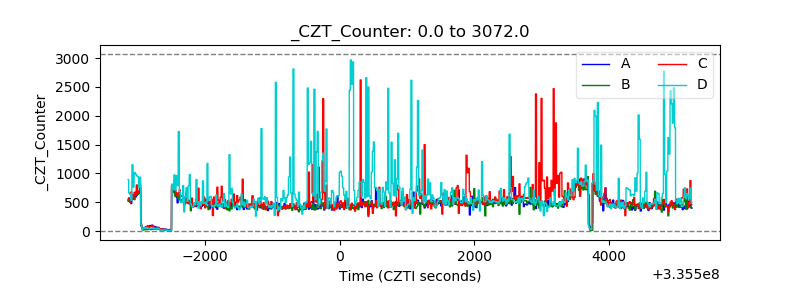 |
| +2.5 Volts monitor |  |
| +5 Volts monitor |  |
| _ROLL_ROT | 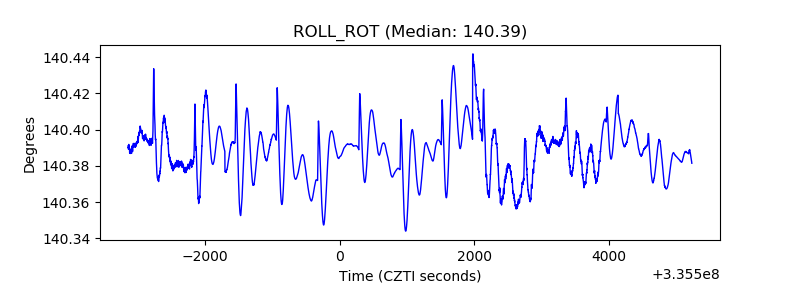 |
| _Roll_DEC | 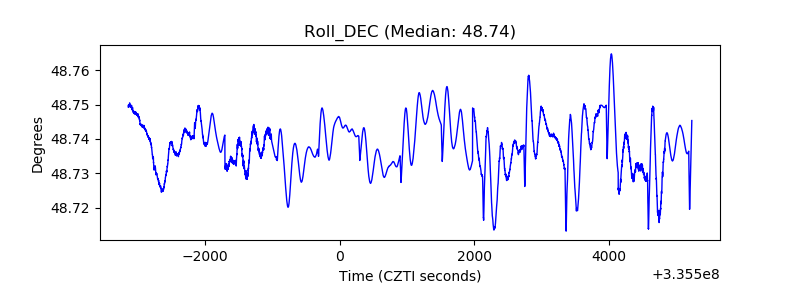 |
| _Roll_RA | 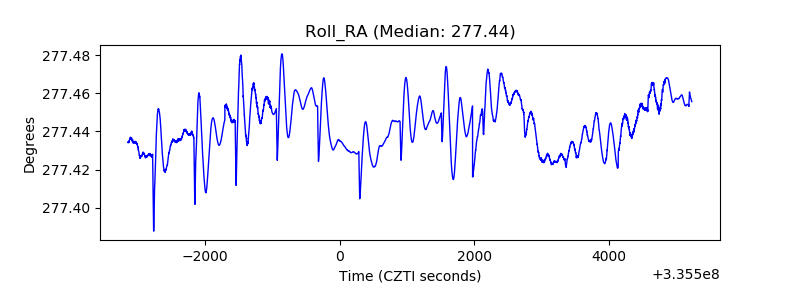 |
| Veto Counter | 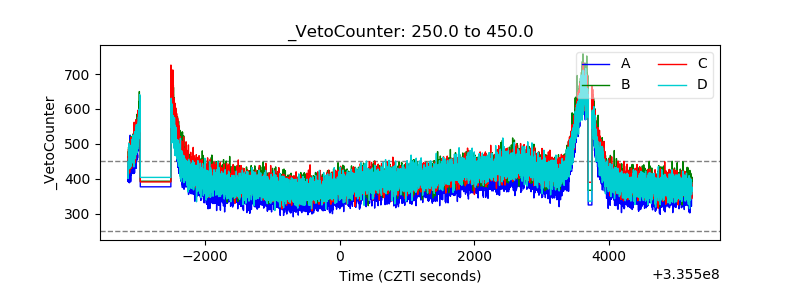 |