| Param | Original file | Final file |
|---|---|---|
| Filename | modeM0/AS1A09_056T01_9000003824_26451cztM0_level2.evt | modeM0/AS1A09_056T01_9000003824_26451cztM0_level2_quad_clean.evt |
| Size (bytes) | 696,101,760 | 112,916,160 |
| Size | 663.9 MB | 107.7 MB |
| Events in quadrant A | 4,185,357 | 714,202 |
| Events in quadrant B | 4,266,692 | 730,421 |
| Events in quadrant C | 5,240,450 | 686,886 |
| Events in quadrant D | 6,793,488 | 677,370 |
| Mode M9 | |||
|---|---|---|---|
| Quadrant | BADHDUFLAG | Total packets | Discarded packets |
| A | 0 | 3 | 0 |
| B | 0 | 3 | 0 |
| C | 0 | 3 | 0 |
| D | 0 | 3 | 0 |
| Mode M0 | |||
|---|---|---|---|
| Quadrant | BADHDUFLAG | Total packets | Discarded packets |
| A | 0 | 18236 | 0 |
| B | 0 | 18360 | 0 |
| C | 0 | 21155 | 0 |
| D | 0 | 26234 | 0 |
| Quadrant | Total seconds | Saturated seconds | Saturation percentage |
|---|---|---|---|
| A | 8787 | 324 | 3.687265% |
| B | 8788 | 354 | 4.028220% |
| C | 8788 | 530 | 6.030951% |
| D | 8788 | 583 | 6.634046% |
Noise dominated data is calculated using 1-second bins in cleaned event files. If a bin has >2000 counts, and if more than 50% of those come from <1% of pixels, then it is considered to be noise-dominated and hence unusable.
| Quadrant | # 1 sec bins | Bins with >0 counts | Bins with >2000 counts | High rate bins dominated by noise | Noise dominated (total time) | Noise dominated (detector-on time) | Marked lightcurve |
|---|---|---|---|---|---|---|---|
| A | 9102 | 8789 | 0 | 0 | 0.00% | 0.00% | 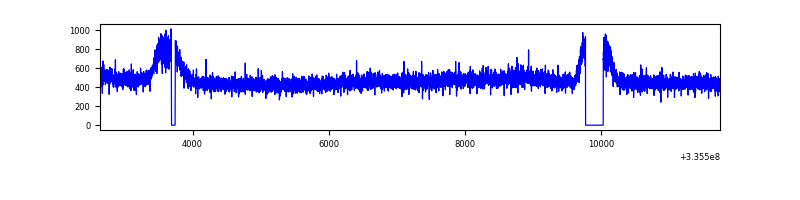 |
| B | 9103 | 8790 | 0 | 0 | 0.00% | 0.00% | 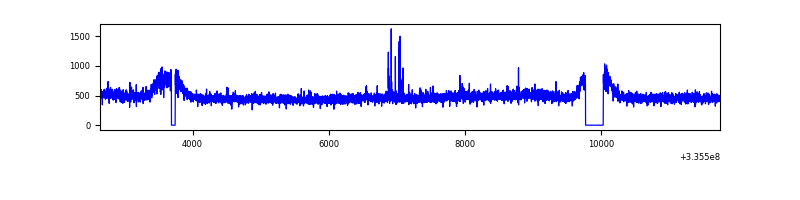 |
| C | 9103 | 8790 | 92 | 92 | 1.01% | 1.05% | 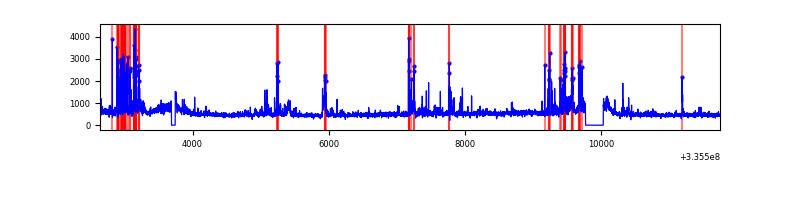 |
| D | 9103 | 8790 | 274 | 274 | 3.01% | 3.12% | 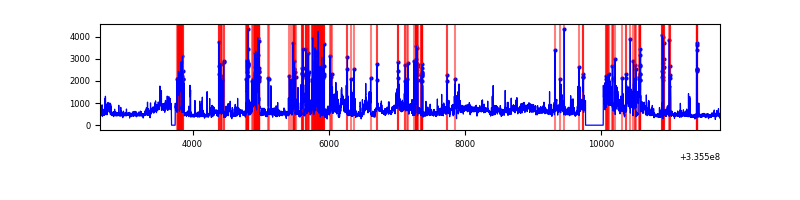 |
Top three noisy pixels from each quadrant. If the there are fewer than three noisy pixels in the level2.evt file, extra rows are filled as -1
| Pixel properties | Quadrant properties | ||||||
|---|---|---|---|---|---|---|---|
| Quadrant | DetID | PixID | Counts | Sigma | Mean | Median | Sigma |
| A | 13 | 254 | 12984 | 54.44 | 1082 | 1055 | 219.1 |
| A | 12 | 189 | 12902 | 54.07 | 1082 | 1055 | 219.1 |
| A | 3 | 137 | 10775 | 44.36 | 1082 | 1055 | 219.1 |
| B | 12 | 111 | 26282 | 120.74 | 1080 | 1051 | 209.0 |
| B | 0 | 190 | 26024 | 119.5 | 1080 | 1051 | 209.0 |
| B | 11 | 111 | 23519 | 107.51 | 1080 | 1051 | 209.0 |
| C | 2 | 16 | 651535 | 2639.85 | 1043 | 1045 | 246.4 |
| C | 3 | 233 | 347910 | 1407.66 | 1043 | 1045 | 246.4 |
| C | 14 | 238 | 163389 | 658.83 | 1043 | 1045 | 246.4 |
| D | 7 | 80 | 1284609 | 5196.92 | 1041 | 1014 | 247.0 |
| D | 1 | 52 | 1194323 | 4831.38 | 1041 | 1014 | 247.0 |
| D | 11 | 176 | 279592 | 1127.88 | 1041 | 1014 | 247.0 |
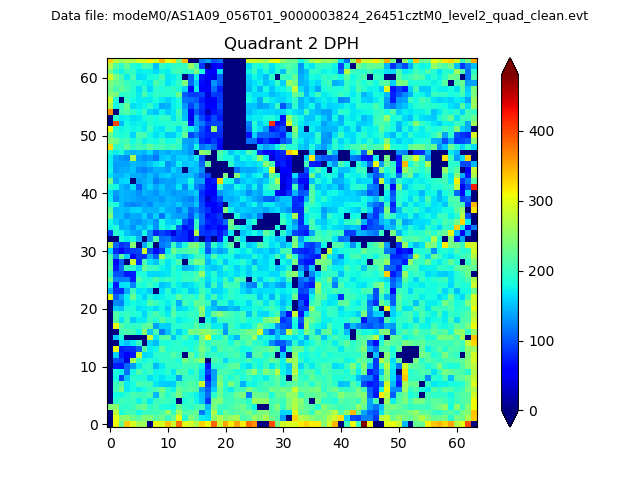
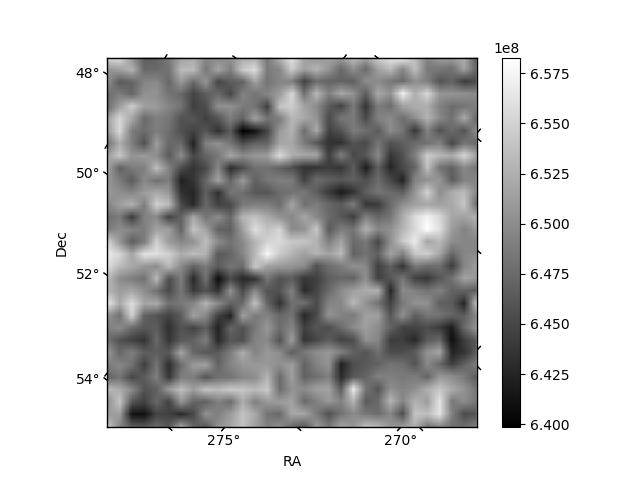
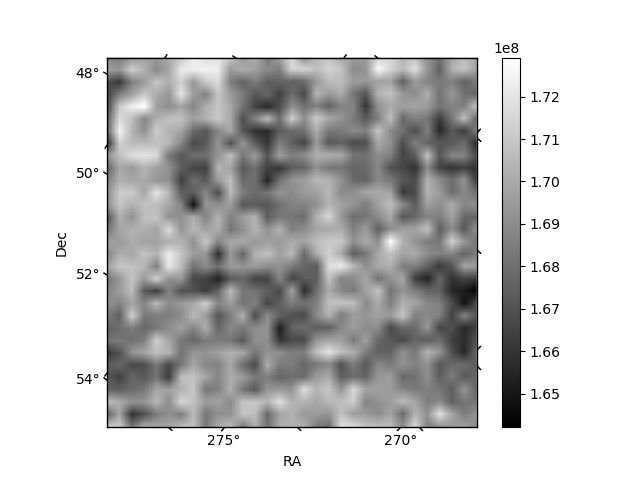
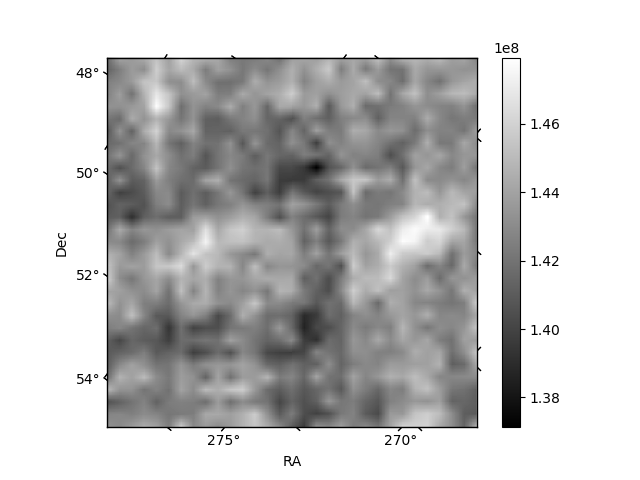
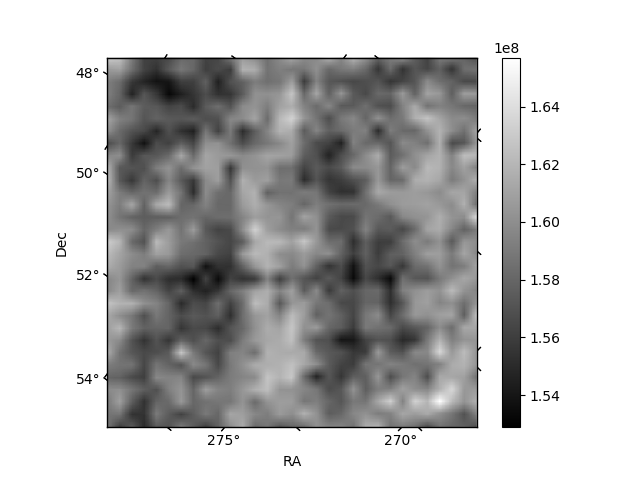
Histogram calculated using DETX and DETY for each event in the final _common_clean file
| Quadrant A | 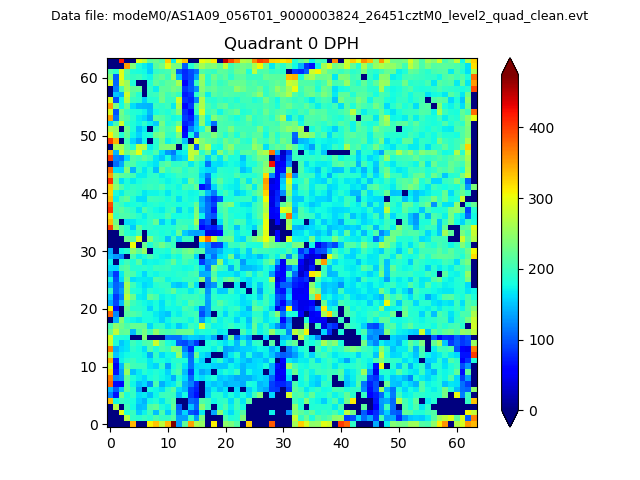 |
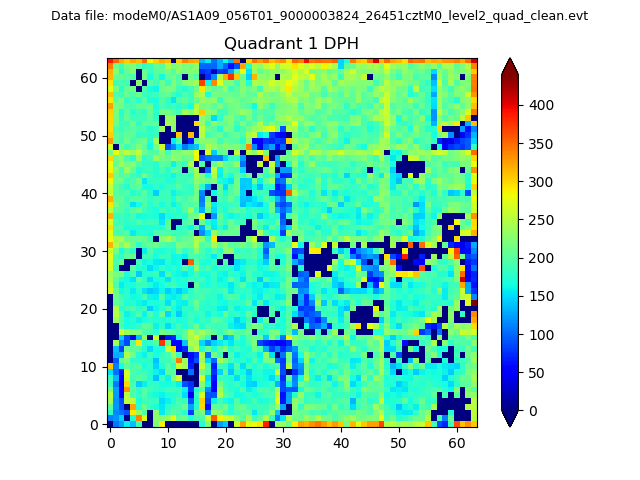 |
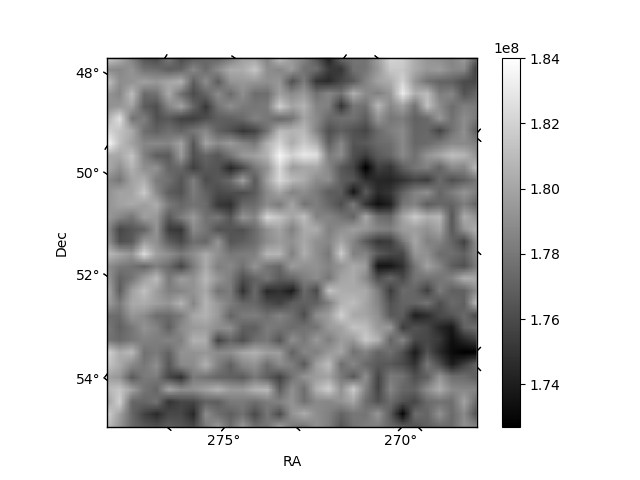
Quadrant B |
|---|---|---|---|
| Quadrant D | 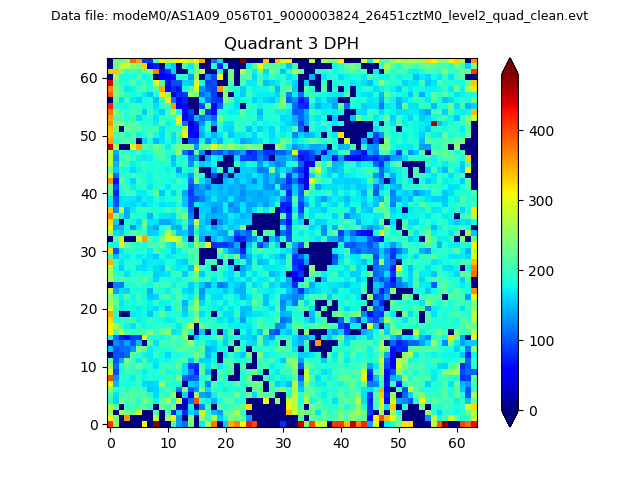 |
 |
Quadrant C |
| Plot type | Count rate plots | Images |
|---|---|---|
| Comparison with Poisson distribution Blue bars denote a histogram of data divided into 1 sec bins. Red curve is a Poisson curve with rate = median count rate of data. |
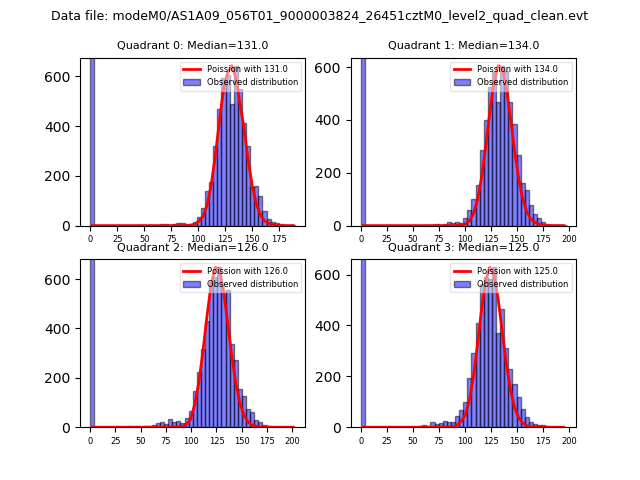 |
 |
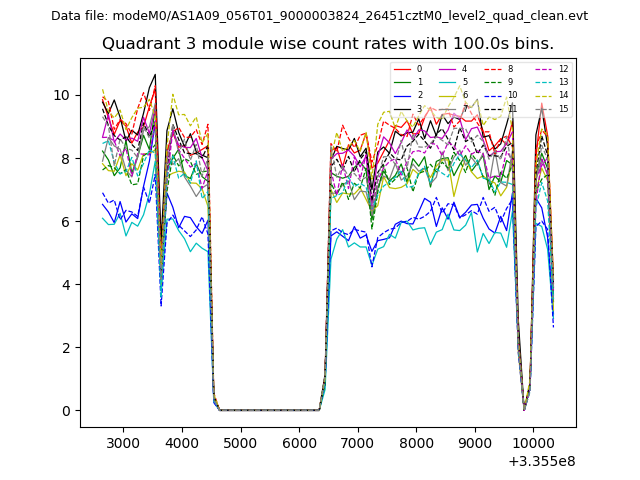
| Quadrant-wise count rates Data is divided into 100 sec bins |
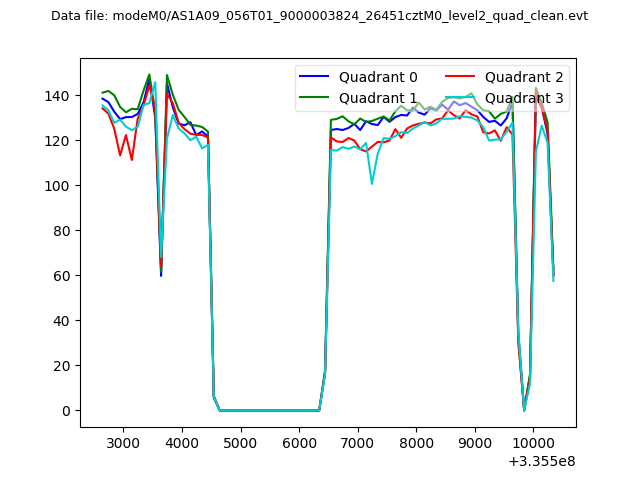 |
|
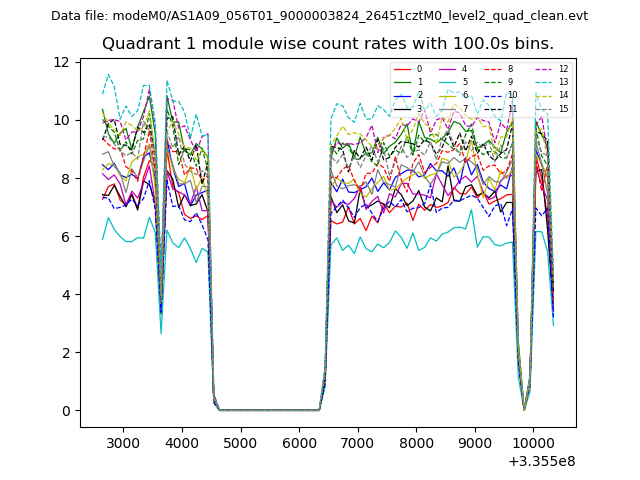
| Module-wise count rates for Quadrant A Data is divided into 100 sec bins |
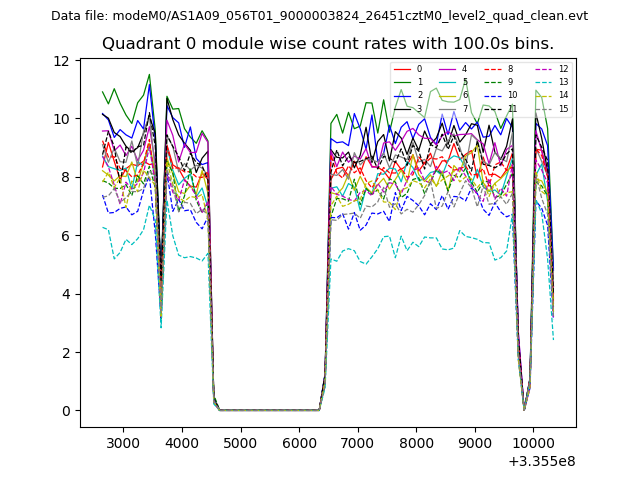 |
 |
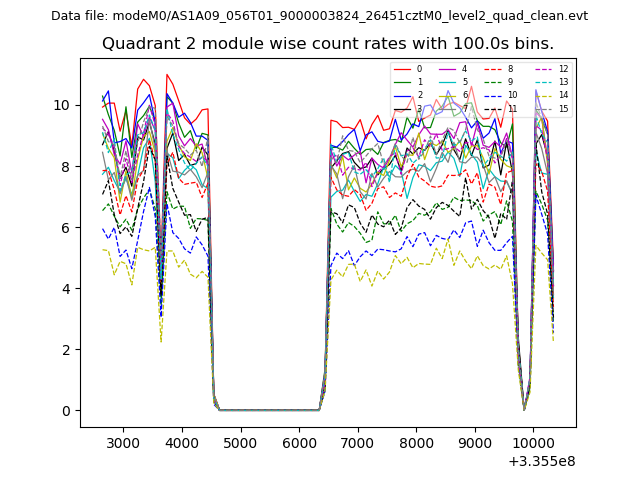
| Module-wise count rates for Quadrant B Data is divided into 100 sec bins |
 |
 |
| Module-wise count rates for Quadrant C Data is divided into 100 sec bins |
 |
 |
| Module-wise count rates for Quadrant D Data is divided into 100 sec bins |
 |
 |
| Parameter | Plot |
|---|---|
| CZT HV Monitor | 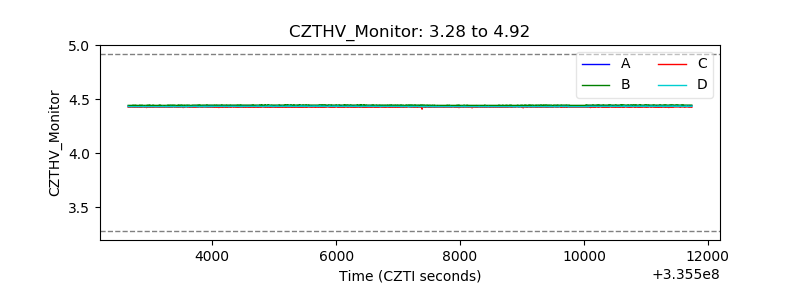 |
| D_VDD | 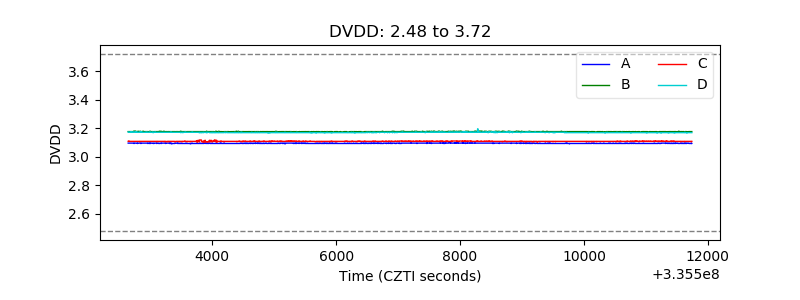 |
| Temperature 1 | 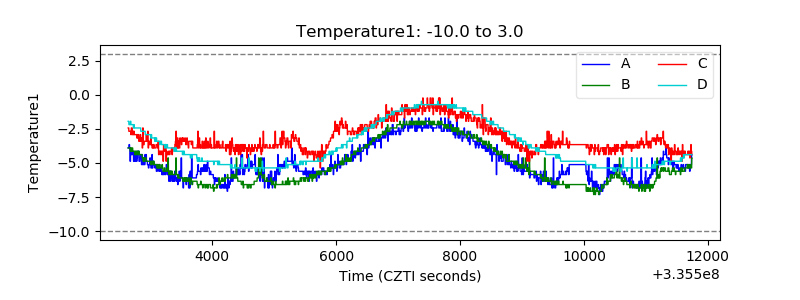 |
| Veto HV Monitor | 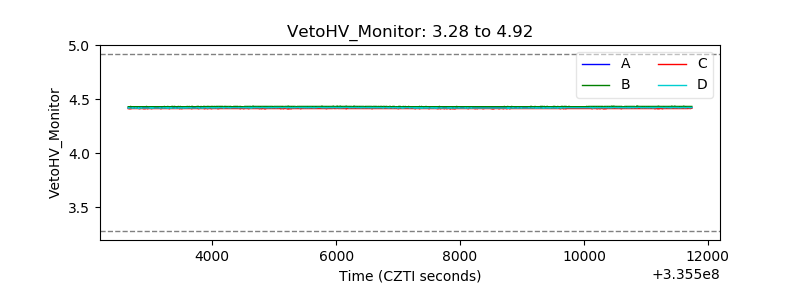 |
| Veto LLD | 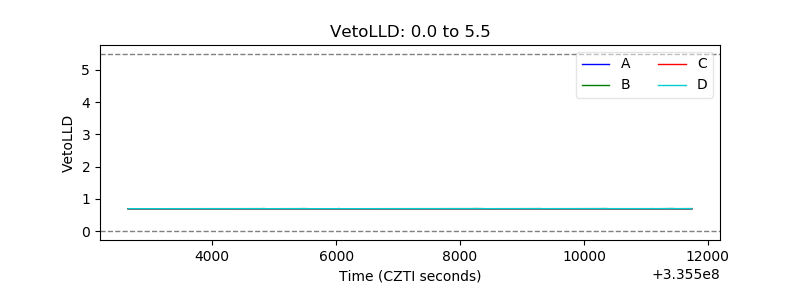 |
| Alpha Counter | 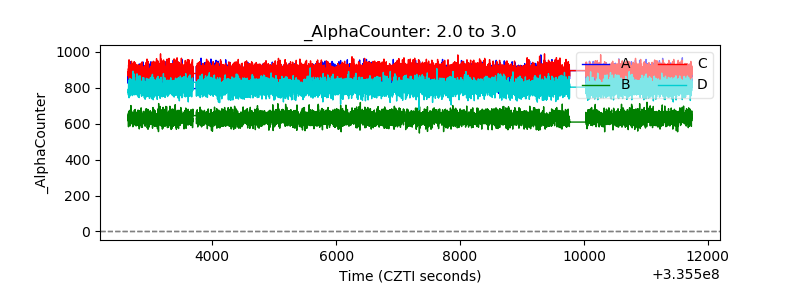 |
| _CPM_Rate | 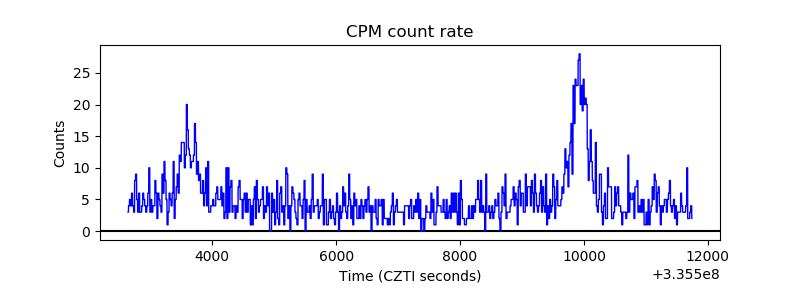 |
| CZT Counter | 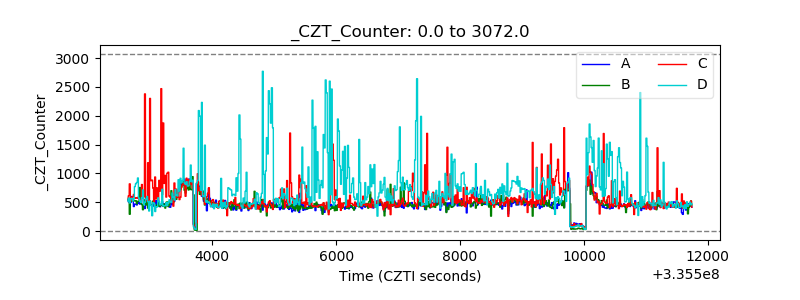 |
| +2.5 Volts monitor |  |
| +5 Volts monitor |  |
| _ROLL_ROT | 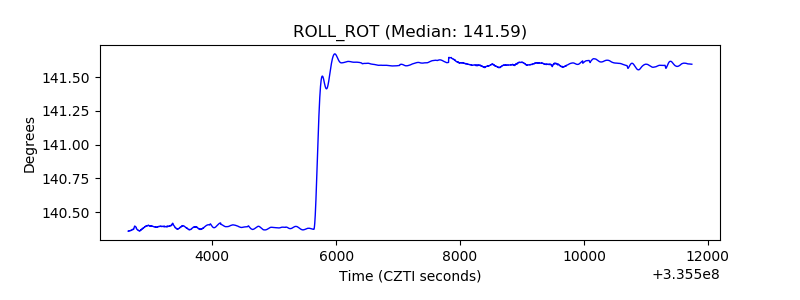 |
| _Roll_DEC | 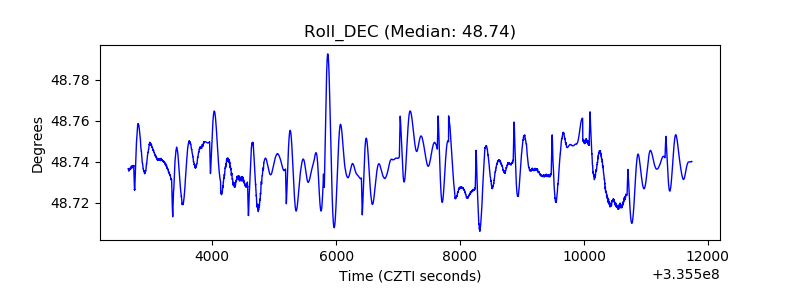 |
| _Roll_RA | 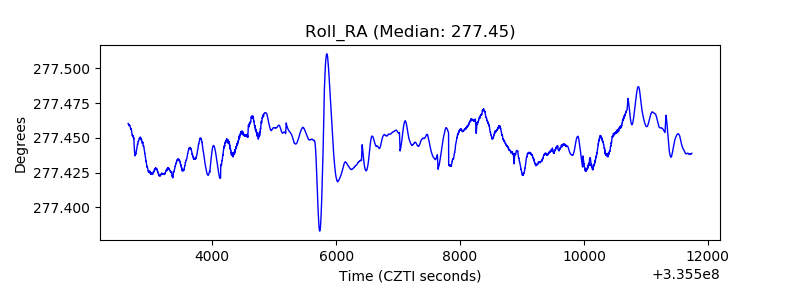 |
| Veto Counter | 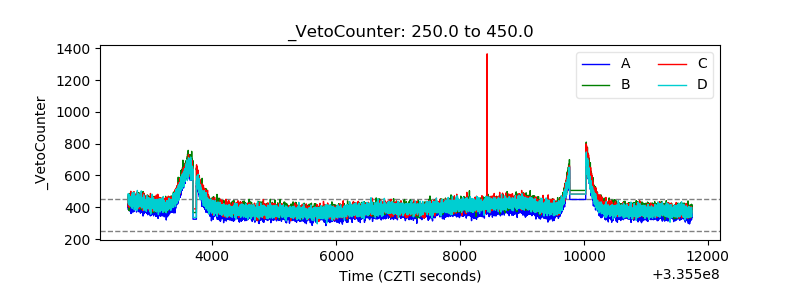 |