| Param | Original file | Final file |
|---|---|---|
| Filename | modeM0/AS1A09_056T01_9000003824_26453cztM0_level2.evt | modeM0/AS1A09_056T01_9000003824_26453cztM0_level2_quad_clean.evt |
| Size (bytes) | 579,709,440 | 86,437,440 |
| Size | 552.9 MB | 82.4 MB |
| Events in quadrant A | 3,680,294 | 530,000 |
| Events in quadrant B | 3,728,670 | 539,468 |
| Events in quadrant C | 4,013,496 | 515,334 |
| Events in quadrant D | 5,609,485 | 494,577 |
| Mode M9 | |||
|---|---|---|---|
| Quadrant | BADHDUFLAG | Total packets | Discarded packets |
| A | 0 | 8 | 0 |
| B | 0 | 8 | 0 |
| C | 0 | 8 | 0 |
| D | 0 | 8 | 0 |
| Mode M0 | |||
|---|---|---|---|
| Quadrant | BADHDUFLAG | Total packets | Discarded packets |
| A | 0 | 15907 | 0 |
| B | 0 | 16001 | 0 |
| C | 0 | 16737 | 0 |
| D | 0 | 21636 | 0 |
| Quadrant | Total seconds | Saturated seconds | Saturation percentage |
|---|---|---|---|
| A | 7733 | 207 | 2.676840% |
| B | 7732 | 244 | 3.155717% |
| C | 7733 | 280 | 3.620846% |
| D | 7733 | 621 | 8.030519% |
Noise dominated data is calculated using 1-second bins in cleaned event files. If a bin has >2000 counts, and if more than 50% of those come from <1% of pixels, then it is considered to be noise-dominated and hence unusable.
| Quadrant | # 1 sec bins | Bins with >0 counts | Bins with >2000 counts | High rate bins dominated by noise | Noise dominated (total time) | Noise dominated (detector-on time) | Marked lightcurve |
|---|---|---|---|---|---|---|---|
| A | 8458 | 7734 | 0 | 0 | 0.00% | 0.00% | 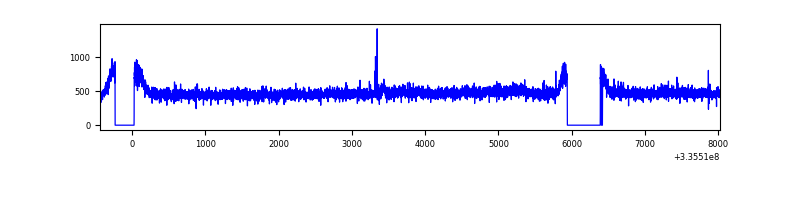 |
| B | 8457 | 7733 | 1 | 1 | 0.01% | 0.01% | 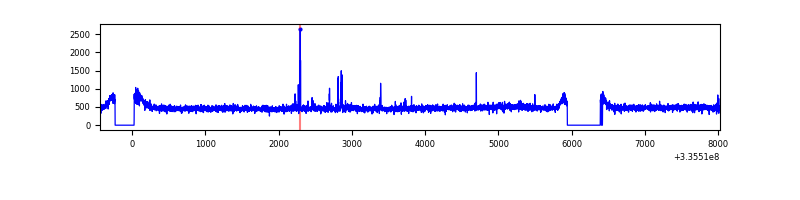 |
| C | 8458 | 7735 | 24 | 24 | 0.28% | 0.31% | 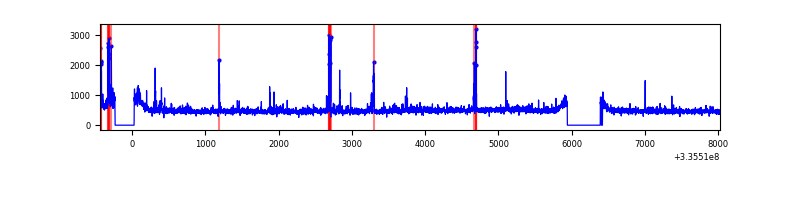 |
| D | 8458 | 7735 | 377 | 377 | 4.46% | 4.87% | 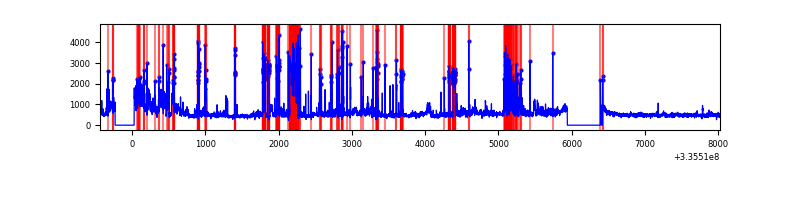 |
Top three noisy pixels from each quadrant. If the there are fewer than three noisy pixels in the level2.evt file, extra rows are filled as -1
| Pixel properties | Quadrant properties | ||||||
|---|---|---|---|---|---|---|---|
| Quadrant | DetID | PixID | Counts | Sigma | Mean | Median | Sigma |
| A | 6 | 16 | 41530 | 213.74 | 940 | 917 | 190.0 |
| A | 13 | 254 | 12352 | 60.18 | 940 | 917 | 190.0 |
| A | 3 | 137 | 9104 | 43.09 | 940 | 917 | 190.0 |
| B | 12 | 111 | 23381 | 124.46 | 939 | 913 | 180.5 |
| B | 0 | 190 | 23289 | 123.95 | 939 | 913 | 180.5 |
| B | 11 | 111 | 20359 | 107.72 | 939 | 913 | 180.5 |
| C | 2 | 16 | 220728 | 1032.27 | 904 | 905 | 213.0 |
| C | 14 | 238 | 142049 | 662.8 | 904 | 905 | 213.0 |
| C | 3 | 233 | 99860 | 464.68 | 904 | 905 | 213.0 |
| D | 7 | 80 | 810951 | 3844.18 | 885 | 861 | 210.7 |
| D | 11 | 176 | 572831 | 2714.21 | 885 | 861 | 210.7 |
| D | 1 | 52 | 552828 | 2619.29 | 885 | 861 | 210.7 |
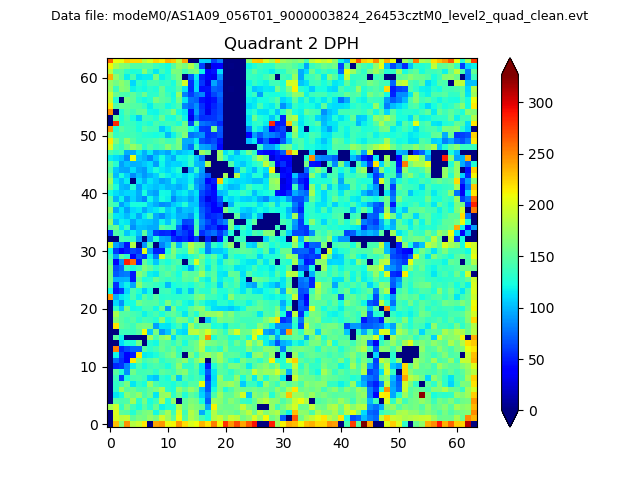
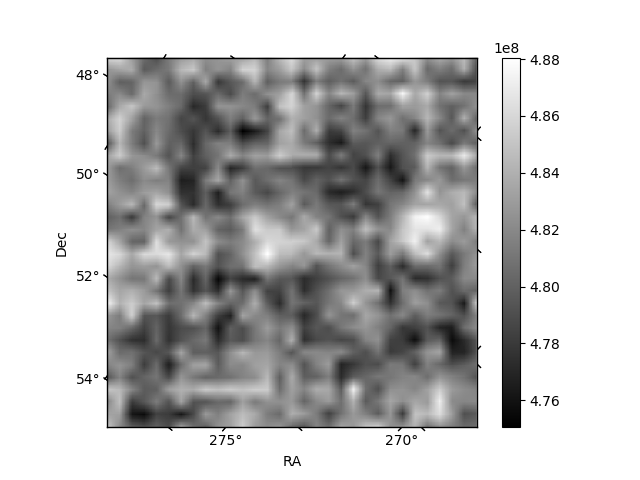
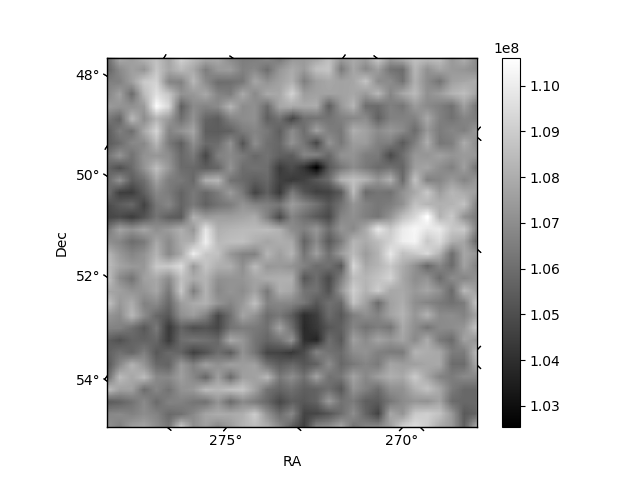
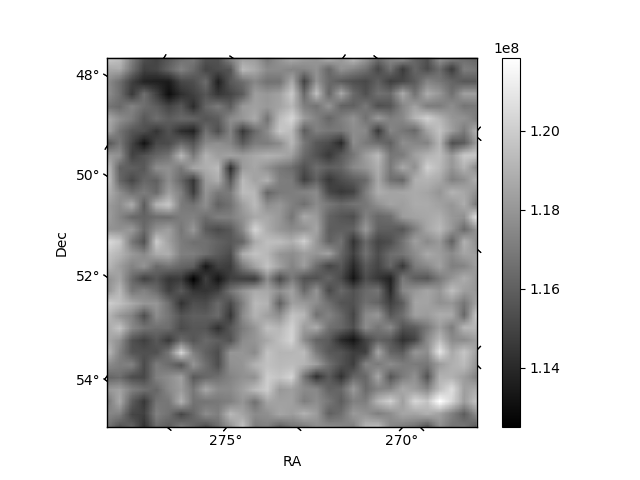
Histogram calculated using DETX and DETY for each event in the final _common_clean file
| Quadrant A | 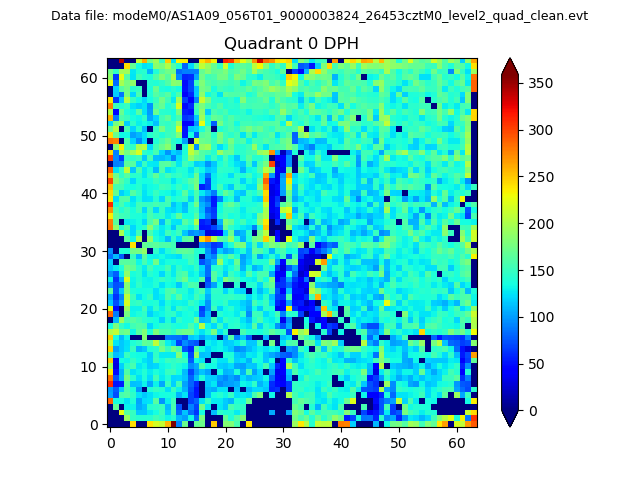 |
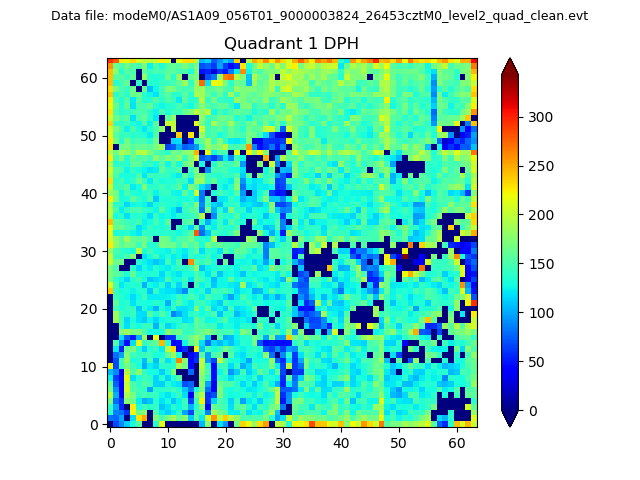 |
Quadrant B |
|---|---|---|---|
| Quadrant D | 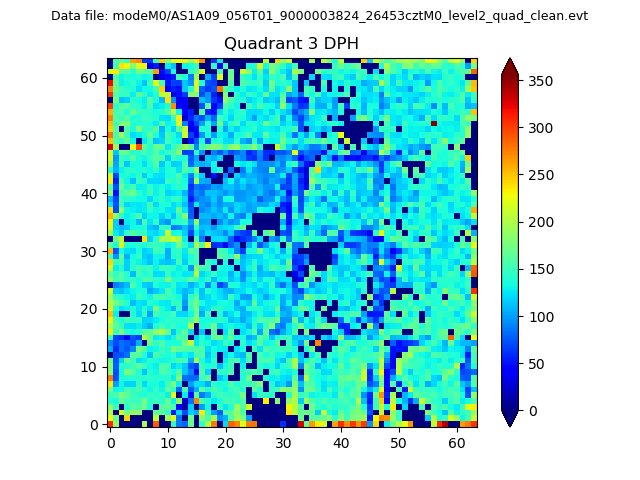 |
 |
Quadrant C |
| Plot type | Count rate plots | Images |
|---|---|---|
| Comparison with Poisson distribution Blue bars denote a histogram of data divided into 1 sec bins. Red curve is a Poisson curve with rate = median count rate of data. |
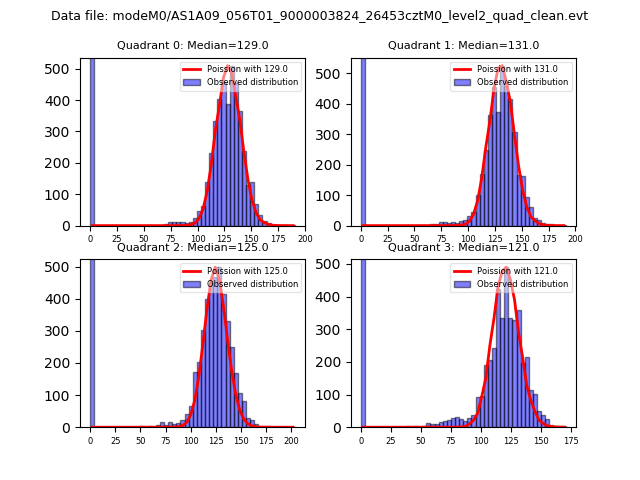 |
 |
| Quadrant-wise count rates Data is divided into 100 sec bins |
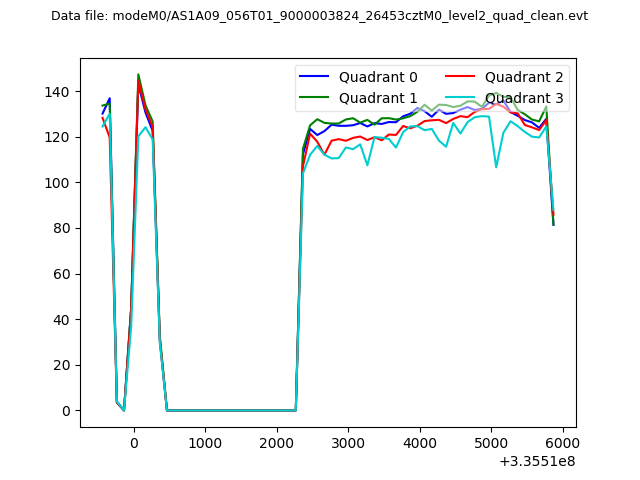 |
|
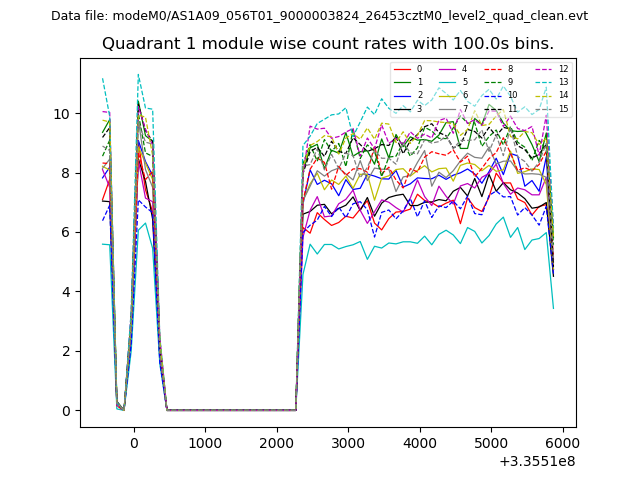
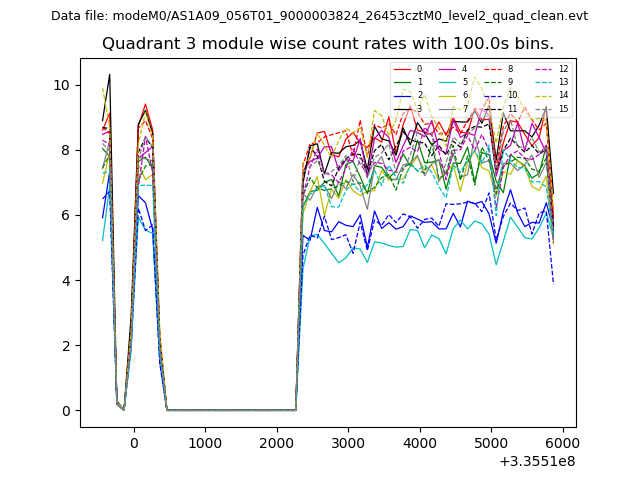
| Module-wise count rates for Quadrant A Data is divided into 100 sec bins |
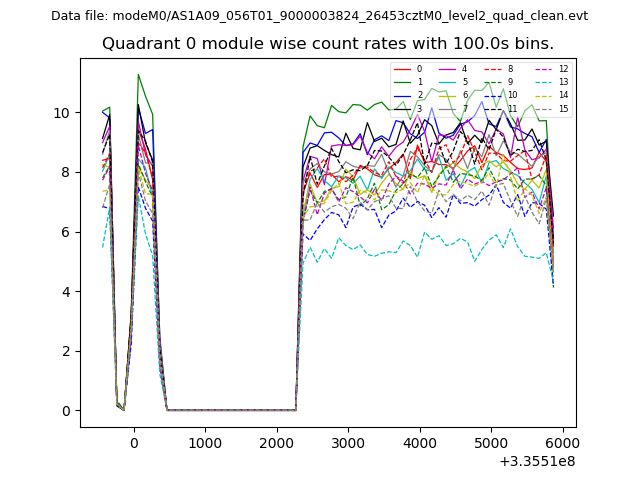 |
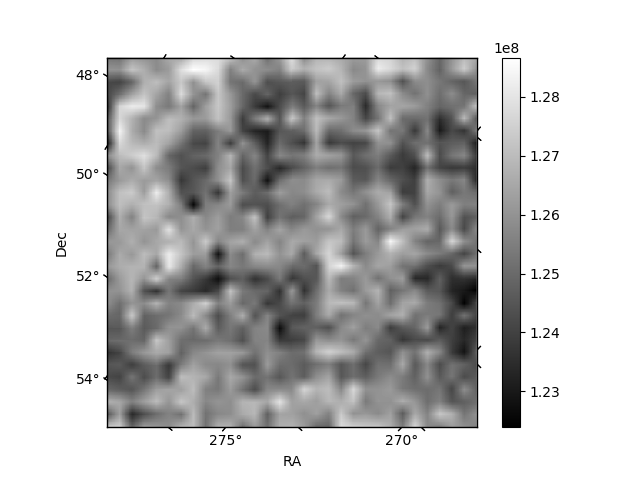 |
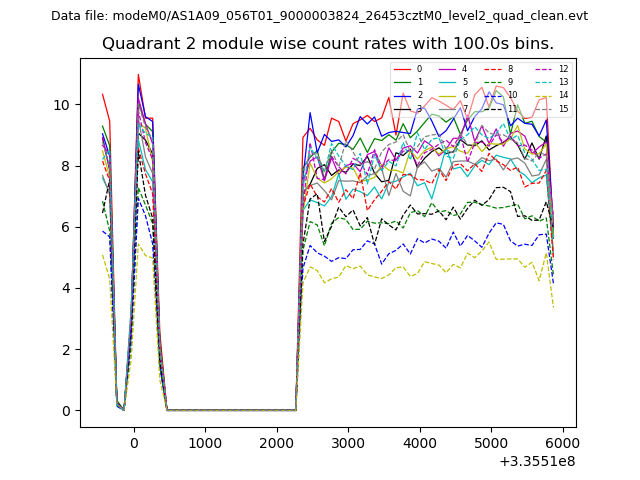
| Module-wise count rates for Quadrant B Data is divided into 100 sec bins |
 |
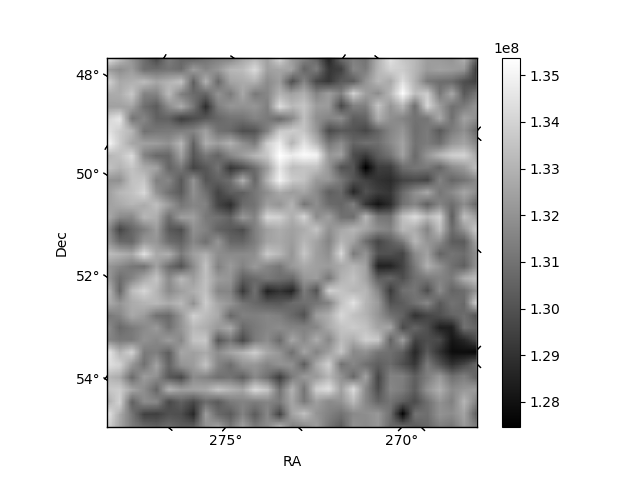 |
| Module-wise count rates for Quadrant C Data is divided into 100 sec bins |
 |
 |
| Module-wise count rates for Quadrant D Data is divided into 100 sec bins |
 |
 |
| Parameter | Plot |
|---|---|
| CZT HV Monitor | 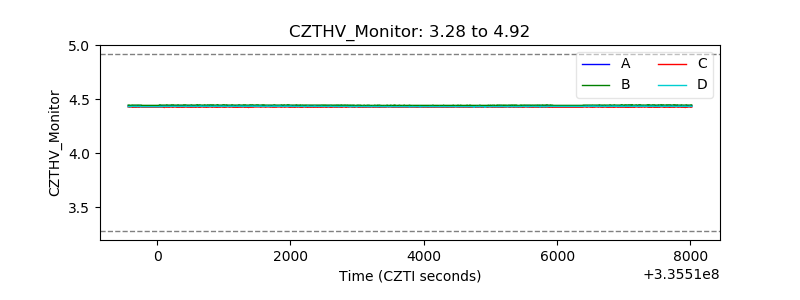 |
| D_VDD | 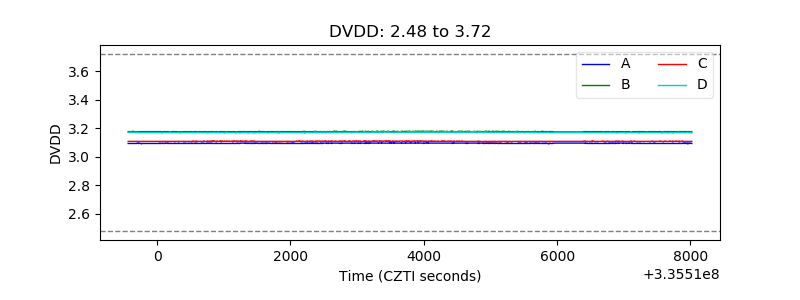 |
| Temperature 1 | 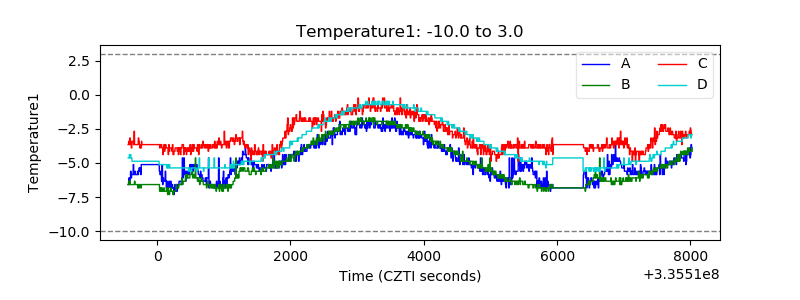 |
| Veto HV Monitor | 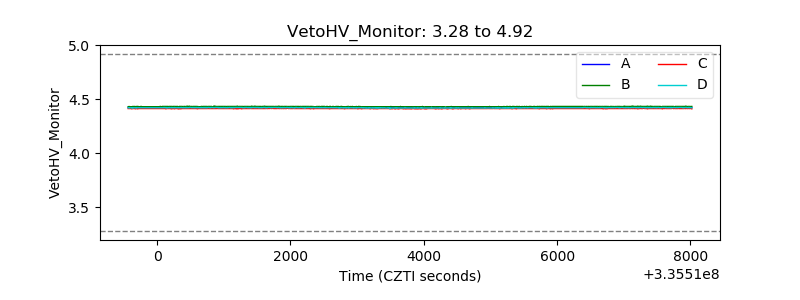 |
| Veto LLD | 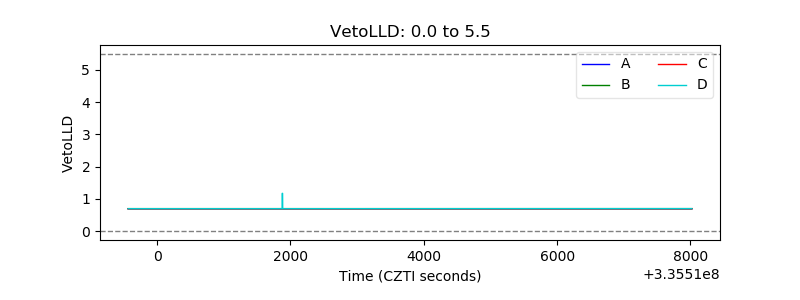 |
| Alpha Counter | 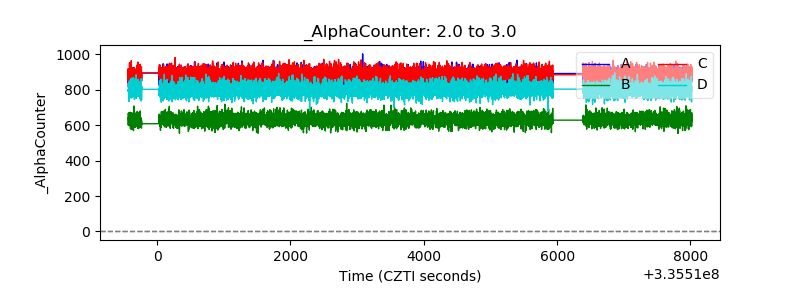 |
| _CPM_Rate | 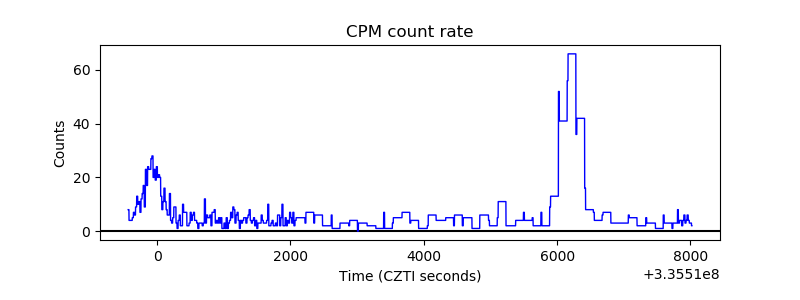 |
| CZT Counter | 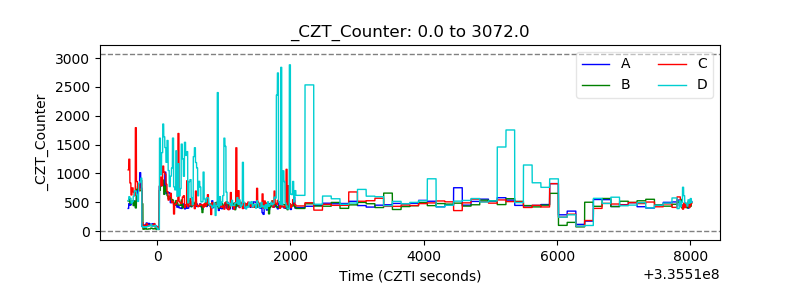 |
| +2.5 Volts monitor | 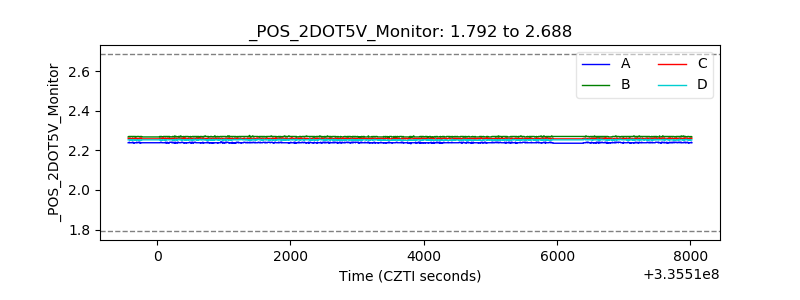 |
| +5 Volts monitor | 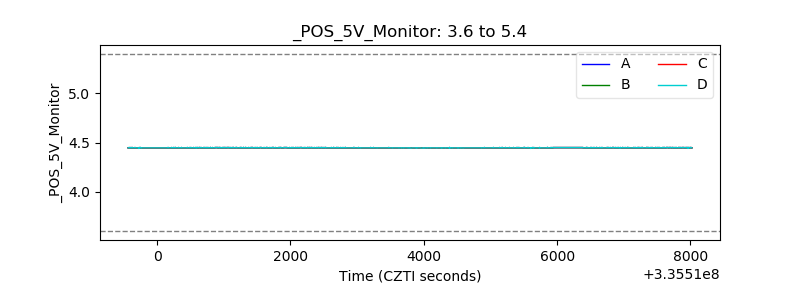 |
| _ROLL_ROT | 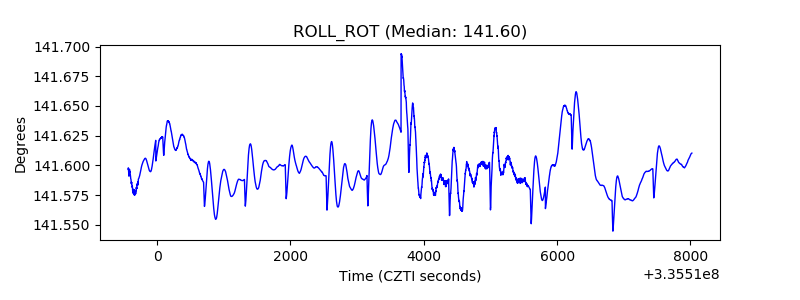 |
| _Roll_DEC |  |
| _Roll_RA | 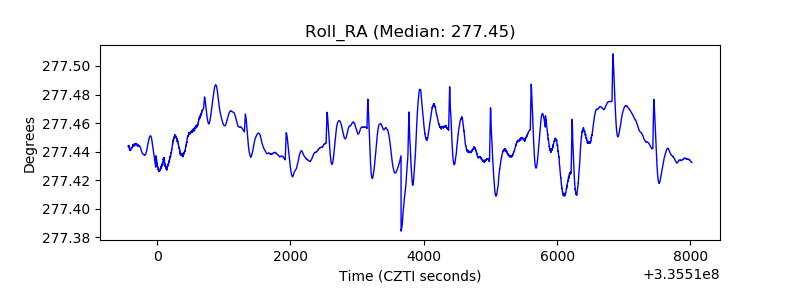 |
| Veto Counter | 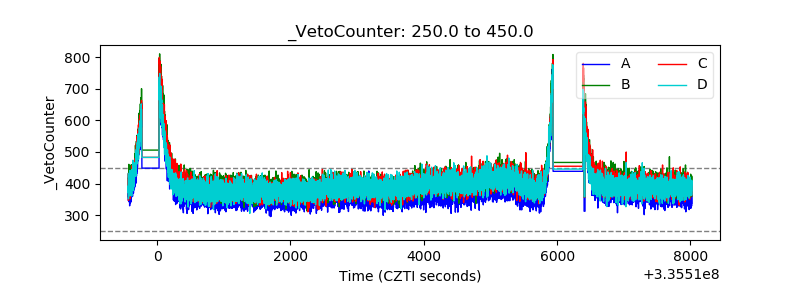 |