| Param | Original file | Final file |
|---|---|---|
| Filename | modeM0/AS1A09_056T01_9000003824_26454cztM0_level2.evt | modeM0/AS1A09_056T01_9000003824_26454cztM0_level2_quad_clean.evt |
| Size (bytes) | 958,152,960 | 164,531,520 |
| Size | 913.8 MB | 156.9 MB |
| Events in quadrant A | 6,022,762 | 1,064,843 |
| Events in quadrant B | 5,957,881 | 1,081,896 |
| Events in quadrant C | 6,314,783 | 1,022,701 |
| Events in quadrant D | 9,882,342 | 954,636 |
| Mode M9 | |||
|---|---|---|---|
| Quadrant | BADHDUFLAG | Total packets | Discarded packets |
| A | 0 | 15 | 0 |
| B | 0 | 15 | 0 |
| C | 0 | 15 | 0 |
| D | 0 | 15 | 0 |
| Mode M0 | |||
|---|---|---|---|
| Quadrant | BADHDUFLAG | Total packets | Discarded packets |
| A | 0 | 25805 | 0 |
| B | 0 | 25488 | 0 |
| C | 0 | 26363 | 0 |
| D | 0 | 37450 | 0 |
| Quadrant | Total seconds | Saturated seconds | Saturation percentage |
|---|---|---|---|
| A | 12414 | 200 | 1.611084% |
| B | 12415 | 153 | 1.232380% |
| C | 12415 | 200 | 1.610954% |
| D | 12414 | 1070 | 8.619301% |
Noise dominated data is calculated using 1-second bins in cleaned event files. If a bin has >2000 counts, and if more than 50% of those come from <1% of pixels, then it is considered to be noise-dominated and hence unusable.
| Quadrant | # 1 sec bins | Bins with >0 counts | Bins with >2000 counts | High rate bins dominated by noise | Noise dominated (total time) | Noise dominated (detector-on time) | Marked lightcurve |
|---|---|---|---|---|---|---|---|
| A | 13929 | 12414 | 41 | 41 | 0.29% | 0.33% | 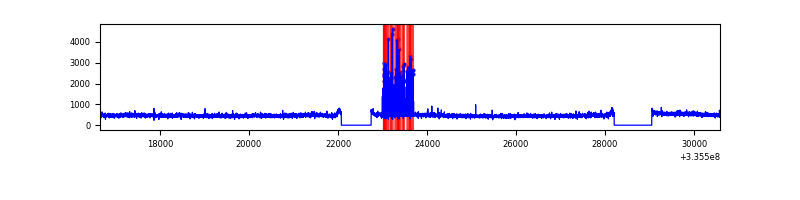 |
| B | 13930 | 12415 | 4 | 4 | 0.03% | 0.03% | 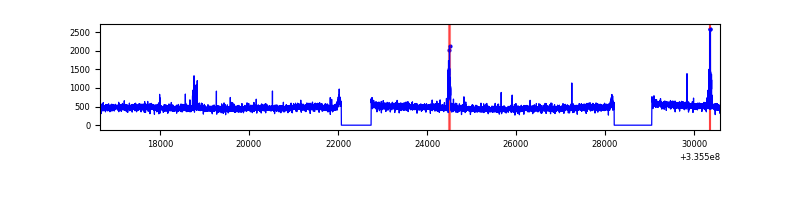 |
| C | 13930 | 12415 | 14 | 14 | 0.10% | 0.11% | 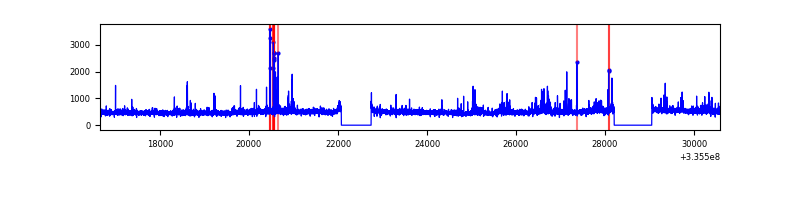 |
| D | 13928 | 12413 | 882 | 882 | 6.33% | 7.11% | 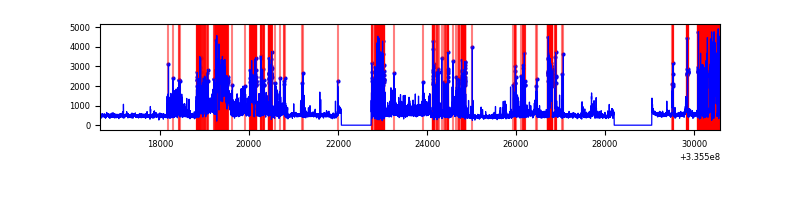 |
Top three noisy pixels from each quadrant. If the there are fewer than three noisy pixels in the level2.evt file, extra rows are filled as -1
| Pixel properties | Quadrant properties | ||||||
|---|---|---|---|---|---|---|---|
| Quadrant | DetID | PixID | Counts | Sigma | Mean | Median | Sigma |
| A | 6 | 16 | 232969 | 776.35 | 1495 | 1463 | 298.2 |
| A | 13 | 254 | 18851 | 58.31 | 1495 | 1463 | 298.2 |
| A | 12 | 189 | 17106 | 52.46 | 1495 | 1463 | 298.2 |
| B | 0 | 190 | 113671 | 395.78 | 1490 | 1447 | 283.6 |
| B | 12 | 111 | 35664 | 120.67 | 1490 | 1447 | 283.6 |
| B | 11 | 111 | 31944 | 107.55 | 1490 | 1447 | 283.6 |
| C | 3 | 233 | 305172 | 905.9 | 1433 | 1436 | 335.3 |
| C | 14 | 238 | 227516 | 674.29 | 1433 | 1436 | 335.3 |
| C | 2 | 16 | 90766 | 266.43 | 1433 | 1436 | 335.3 |
| D | 7 | 80 | 2980139 | 8980.58 | 1393 | 1355 | 331.7 |
| D | 1 | 52 | 1100663 | 3314.25 | 1393 | 1355 | 331.7 |
| D | 12 | 233 | 448879 | 1349.22 | 1393 | 1355 | 331.7 |
Histogram calculated using DETX and DETY for each event in the final _common_clean file
| Quadrant A | 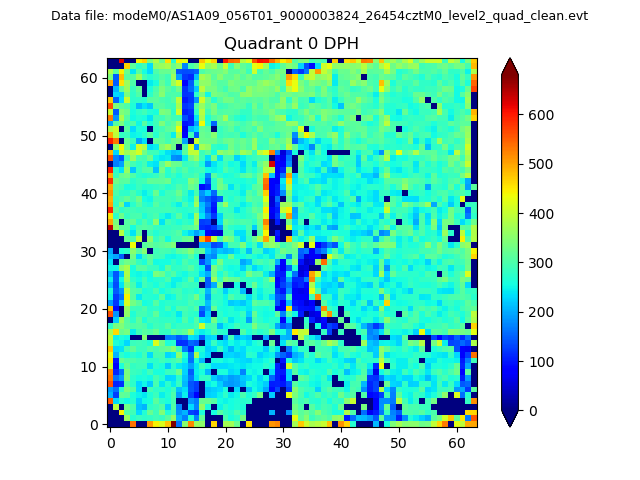 |
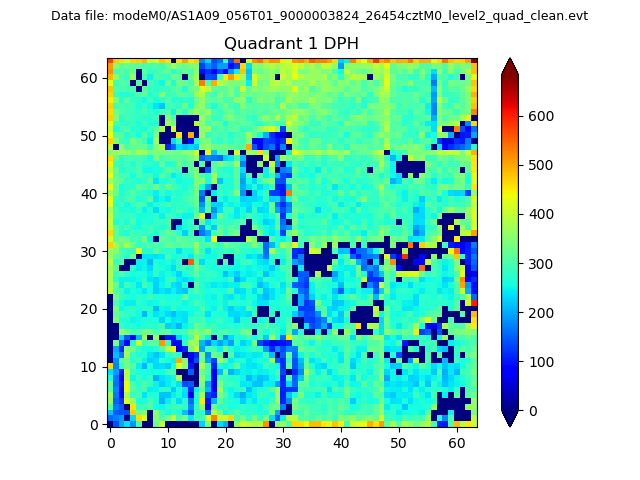 |
Quadrant B |
|---|---|---|---|
| Quadrant D | 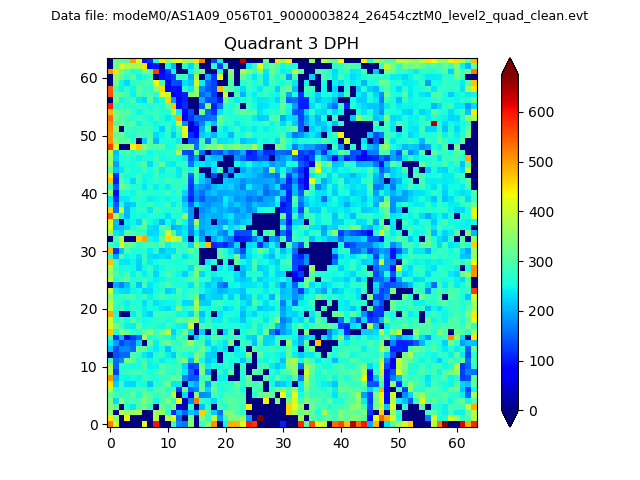 |
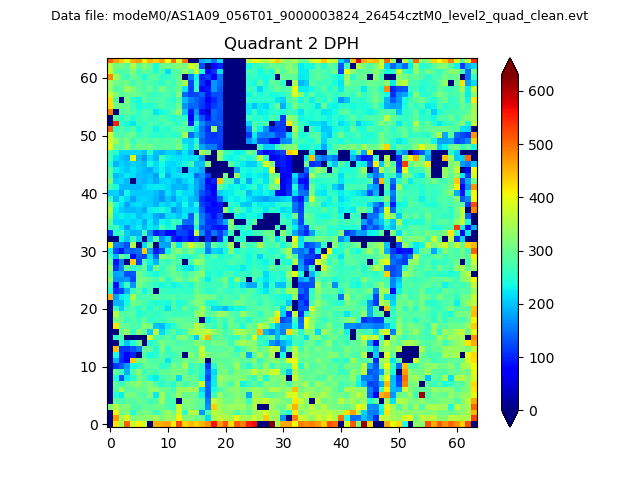 |
Quadrant C |
| Plot type | Count rate plots | Images |
|---|---|---|
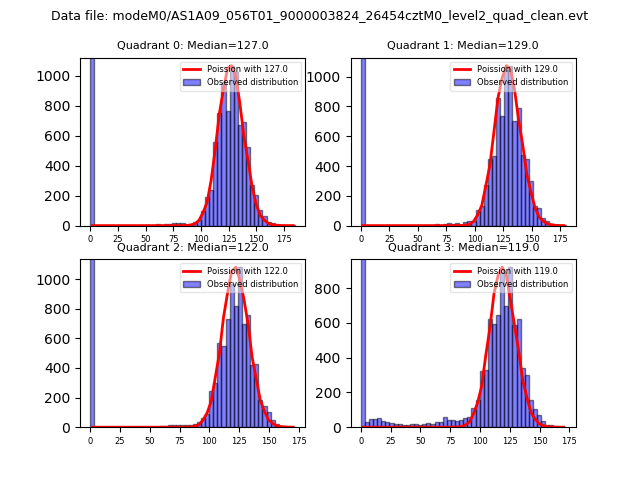
| Comparison with Poisson distribution Blue bars denote a histogram of data divided into 1 sec bins. Red curve is a Poisson curve with rate = median count rate of data. |
 |
 |
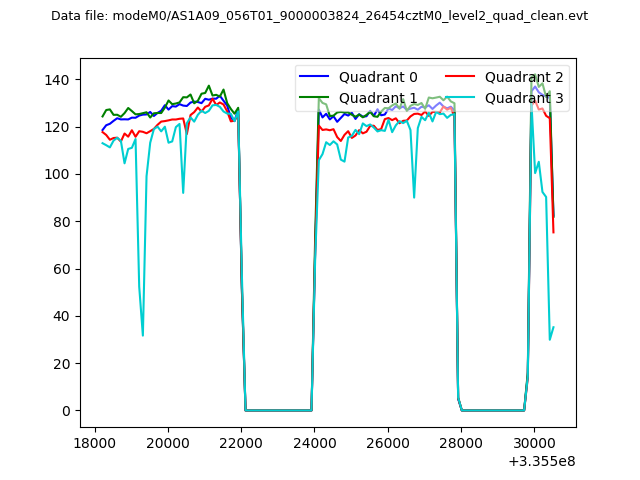
| Quadrant-wise count rates Data is divided into 100 sec bins |
 |
|
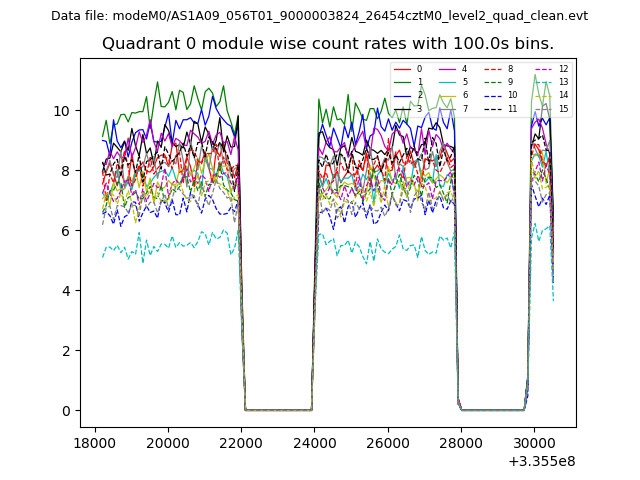
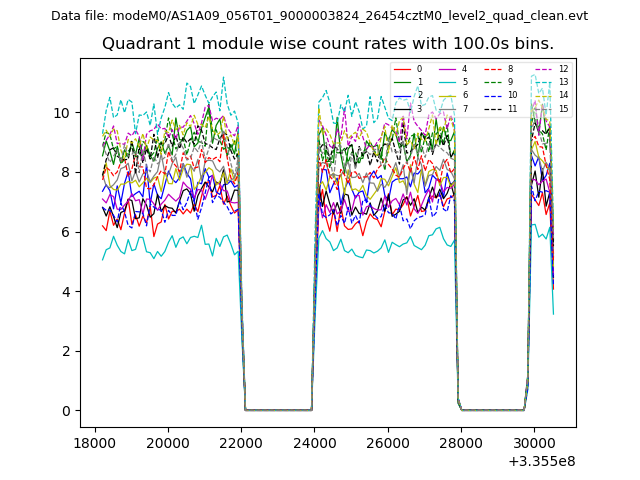
| Module-wise count rates for Quadrant A Data is divided into 100 sec bins |
 |
 |
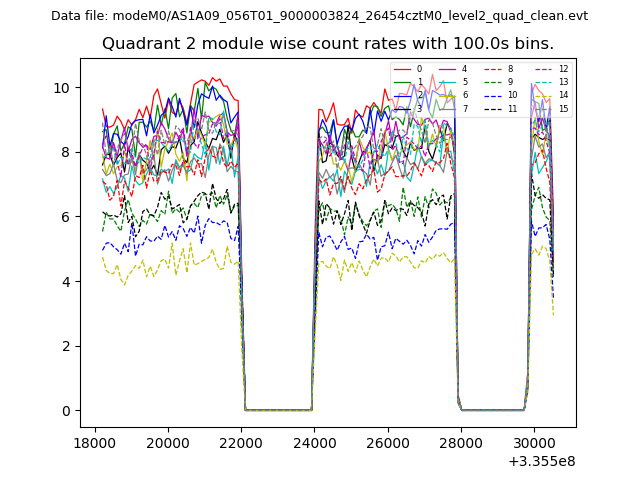
| Module-wise count rates for Quadrant B Data is divided into 100 sec bins |
 |
 |
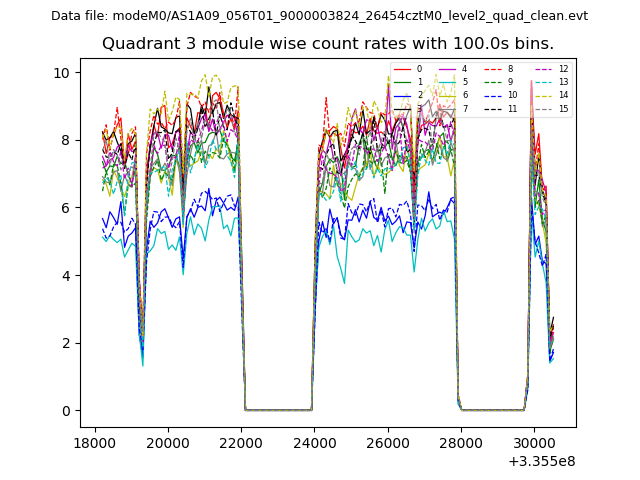
| Module-wise count rates for Quadrant C Data is divided into 100 sec bins |
 |
 |
| Module-wise count rates for Quadrant D Data is divided into 100 sec bins |
 |
 |
| Parameter | Plot |
|---|---|
| CZT HV Monitor | 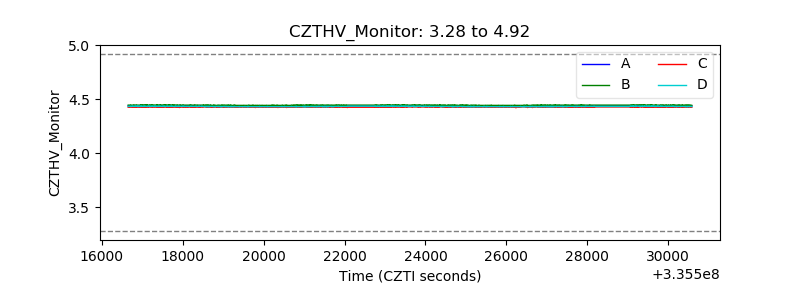 |
| D_VDD | 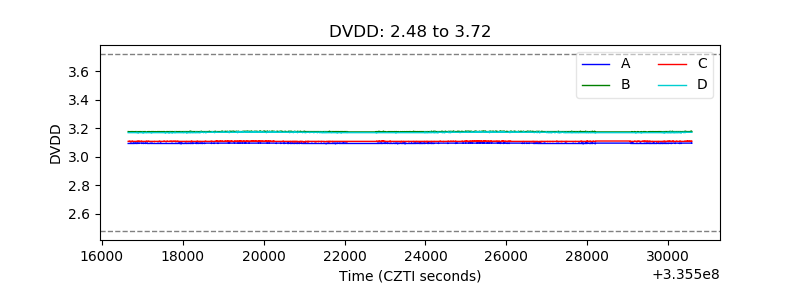 |
| Temperature 1 | 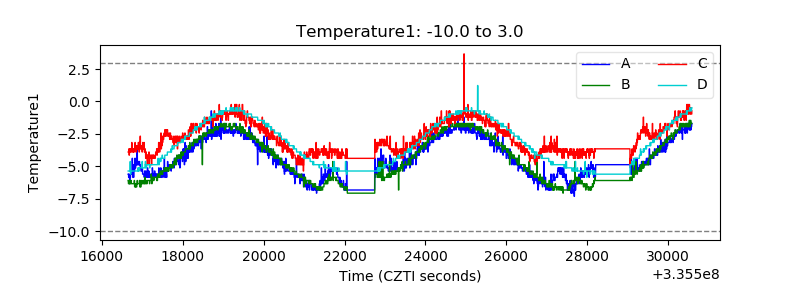 |
| Veto HV Monitor |  |
| Veto LLD |  |
| Alpha Counter | 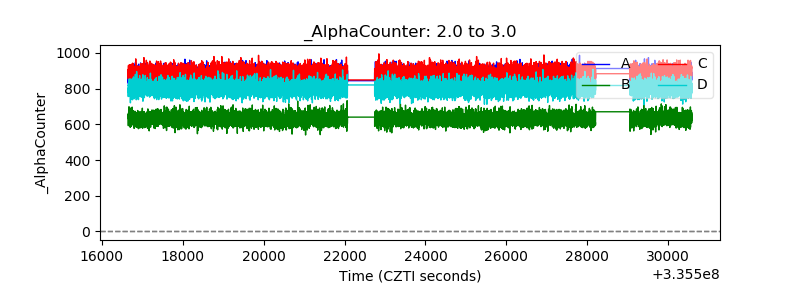 |
| _CPM_Rate | 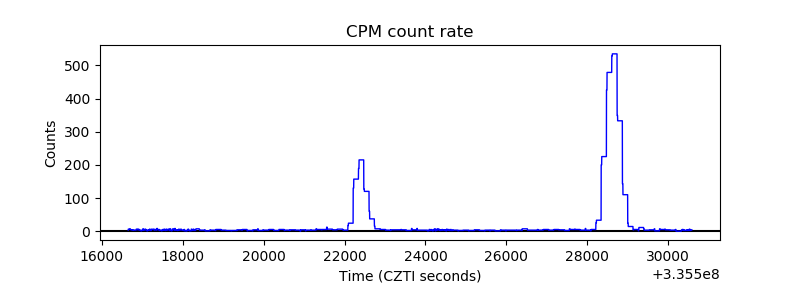 |
| CZT Counter | 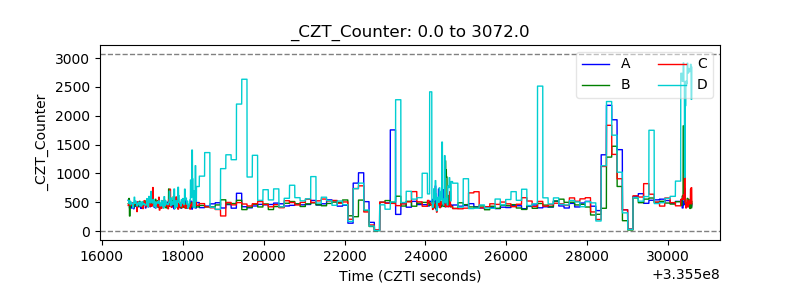 |
| +2.5 Volts monitor | 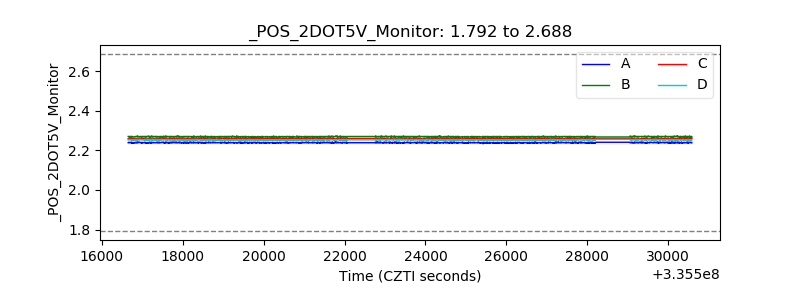 |
| +5 Volts monitor |  |
| _ROLL_ROT | 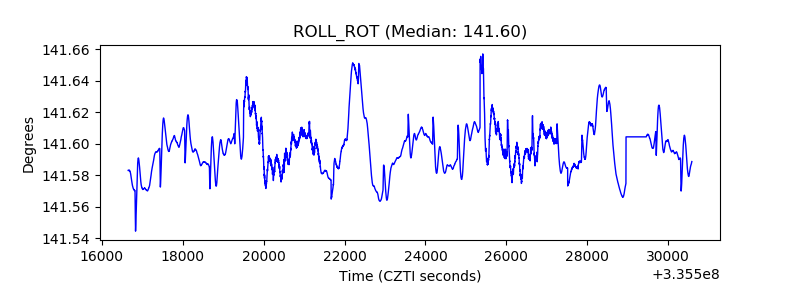 |
| _Roll_DEC | 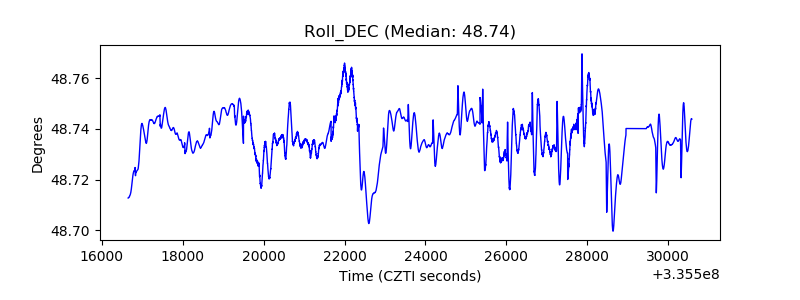 |
| _Roll_RA | 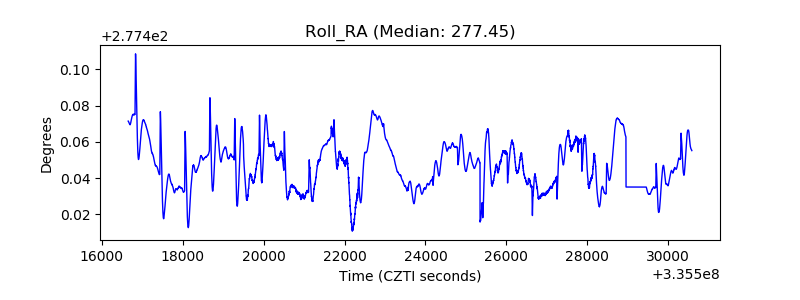 |
| Veto Counter | 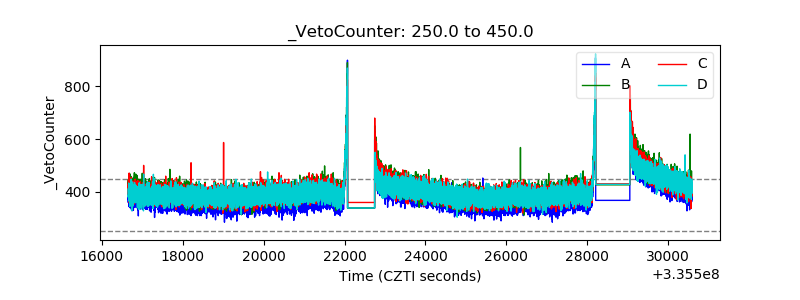 |