| Param | Original file | Final file |
|---|---|---|
| Filename | modeM0/AS1A09_056T01_9000003824_26455cztM0_level2.evt | modeM0/AS1A09_056T01_9000003824_26455cztM0_level2_quad_clean.evt |
| Size (bytes) | 703,077,120 | 92,865,600 |
| Size | 670.5 MB | 88.6 MB |
| Events in quadrant A | 3,388,250 | 662,465 |
| Events in quadrant B | 3,413,946 | 671,951 |
| Events in quadrant C | 3,664,781 | 632,923 |
| Events in quadrant D | 10,366,513 | 371,156 |
| Mode M9 | |||
|---|---|---|---|
| Quadrant | BADHDUFLAG | Total packets | Discarded packets |
| A | 0 | 13 | 0 |
| B | 0 | 14 | 0 |
| C | 0 | 14 | 0 |
| D | 0 | 14 | 0 |
| Mode M0 | |||
|---|---|---|---|
| Quadrant | BADHDUFLAG | Total packets | Discarded packets |
| A | 0 | 14397 | 0 |
| B | 0 | 14498 | 0 |
| C | 0 | 15021 | 0 |
| D | 0 | 35221 | 0 |
| Quadrant | Total seconds | Saturated seconds | Saturation percentage |
|---|---|---|---|
| A | 6781 | 47 | 0.693113% |
| B | 6781 | 57 | 0.840584% |
| C | 6781 | 93 | 1.371479% |
| D | 6781 | 2954 | 43.562896% |
Noise dominated data is calculated using 1-second bins in cleaned event files. If a bin has >2000 counts, and if more than 50% of those come from <1% of pixels, then it is considered to be noise-dominated and hence unusable.
| Quadrant | # 1 sec bins | Bins with >0 counts | Bins with >2000 counts | High rate bins dominated by noise | Noise dominated (total time) | Noise dominated (detector-on time) | Marked lightcurve |
|---|---|---|---|---|---|---|---|
| A | 7811 | 6781 | 1 | 1 | 0.01% | 0.01% | 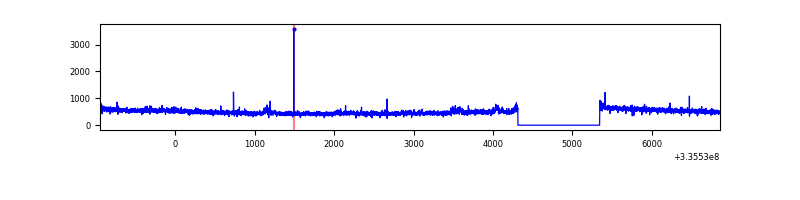 |
| B | 7811 | 6782 | 4 | 4 | 0.05% | 0.06% | 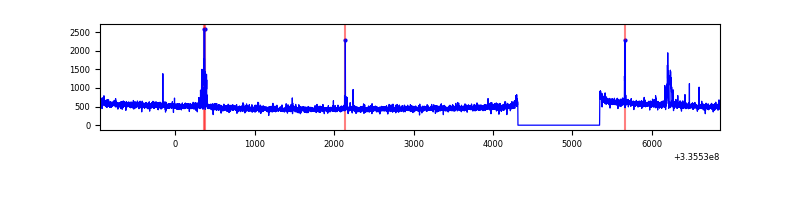 |
| C | 7811 | 6781 | 7 | 7 | 0.09% | 0.10% | 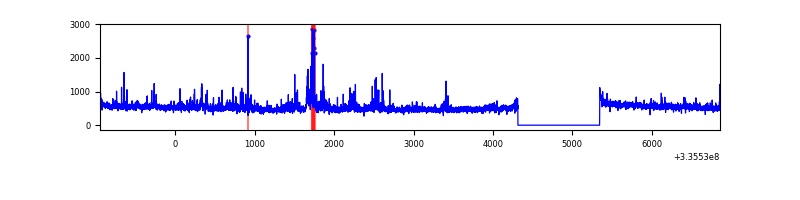 |
| D | 7810 | 6781 | 2826 | 2826 | 36.18% | 41.68% | 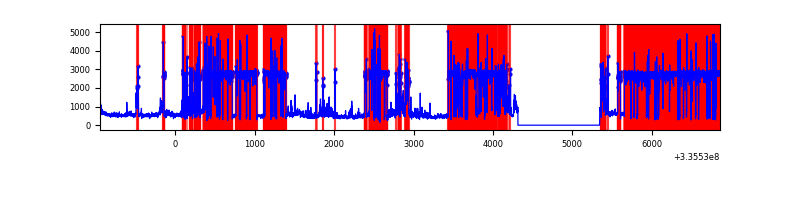 |
Top three noisy pixels from each quadrant. If the there are fewer than three noisy pixels in the level2.evt file, extra rows are filled as -1
| Pixel properties | Quadrant properties | ||||||
|---|---|---|---|---|---|---|---|
| Quadrant | DetID | PixID | Counts | Sigma | Mean | Median | Sigma |
| A | 12 | 189 | 66031 | 381.3 | 857 | 841 | 171.0 |
| A | 6 | 16 | 15642 | 86.57 | 857 | 841 | 171.0 |
| A | 13 | 254 | 9893 | 52.95 | 857 | 841 | 171.0 |
| B | 0 | 190 | 84464 | 522.65 | 846 | 825 | 160.0 |
| B | 12 | 111 | 19403 | 116.09 | 846 | 825 | 160.0 |
| B | 11 | 111 | 17840 | 106.32 | 846 | 825 | 160.0 |
| C | 3 | 233 | 265040 | 1393.37 | 815 | 821 | 189.6 |
| C | 14 | 238 | 132802 | 696.01 | 815 | 821 | 189.6 |
| C | 2 | 16 | 61398 | 319.45 | 815 | 821 | 189.6 |
| D | 1 | 52 | 7501994 | 55081.79 | 573 | 560 | 136.2 |
| D | 7 | 80 | 420367 | 3082.57 | 573 | 560 | 136.2 |
| D | 13 | 168 | 183616 | 1344.15 | 573 | 560 | 136.2 |
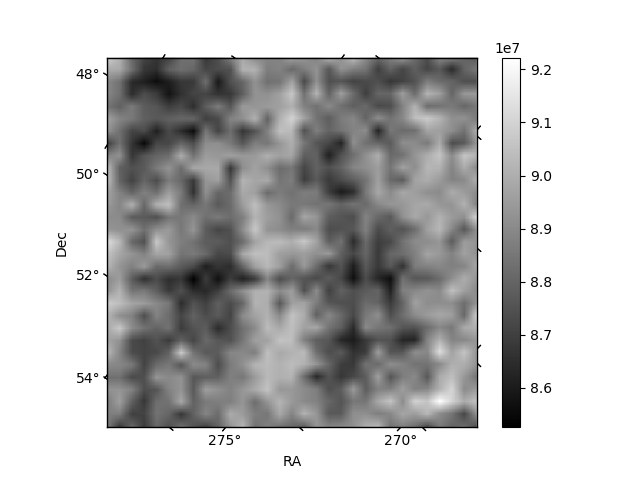
Histogram calculated using DETX and DETY for each event in the final _common_clean file
| Quadrant A | 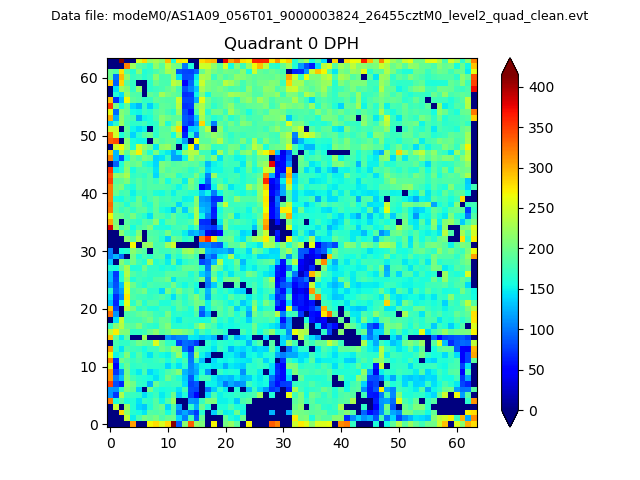 |
 |
Quadrant B |
|---|---|---|---|
| Quadrant D | 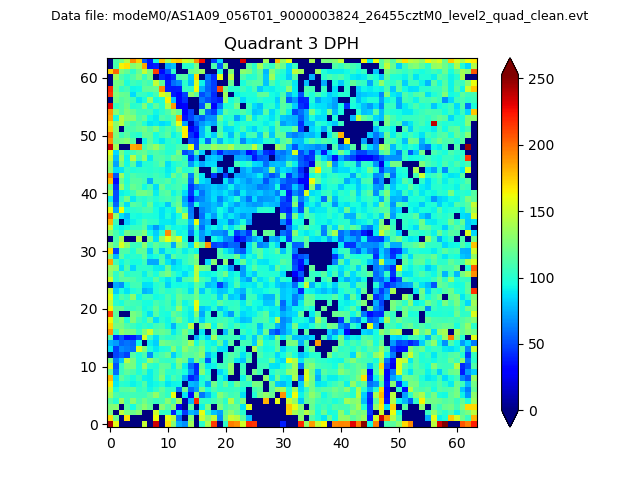 |
 |
Quadrant C |
| Plot type | Count rate plots | Images |
|---|---|---|
| Comparison with Poisson distribution Blue bars denote a histogram of data divided into 1 sec bins. Red curve is a Poisson curve with rate = median count rate of data. |
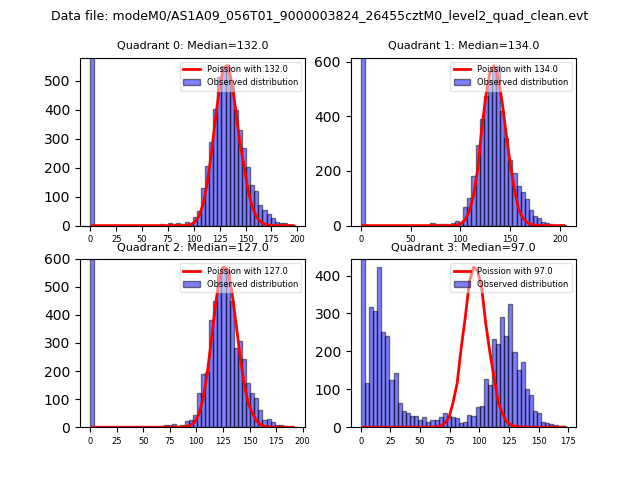 |
 |
| Quadrant-wise count rates Data is divided into 100 sec bins |
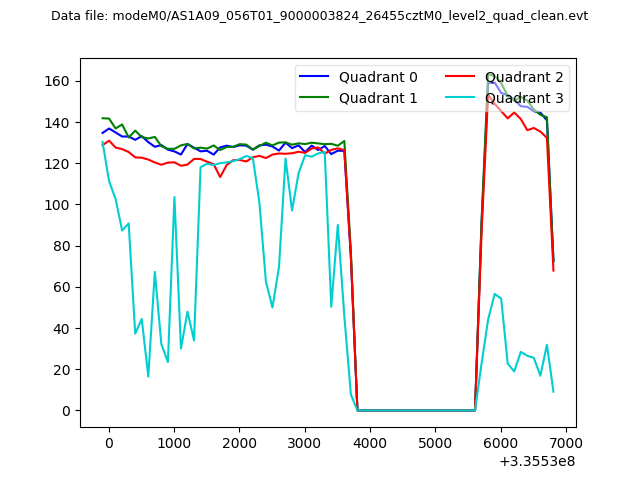 |
|
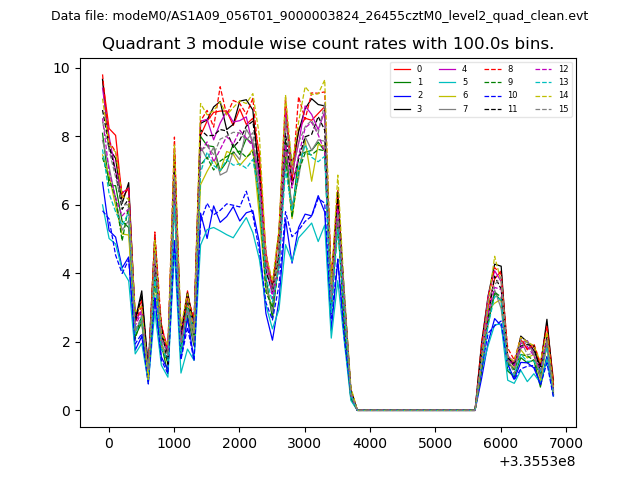
| Module-wise count rates for Quadrant A Data is divided into 100 sec bins |
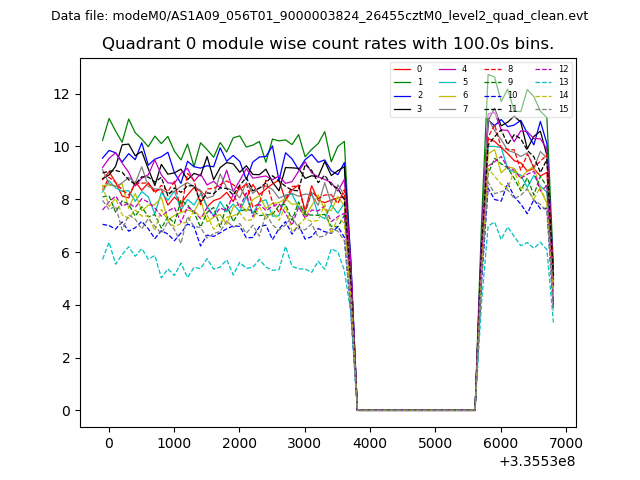 |
 |
| Module-wise count rates for Quadrant B Data is divided into 100 sec bins |
 |
 |
| Module-wise count rates for Quadrant C Data is divided into 100 sec bins |
 |
 |
| Module-wise count rates for Quadrant D Data is divided into 100 sec bins |
 |
 |
| Parameter | Plot |
|---|---|
| CZT HV Monitor | 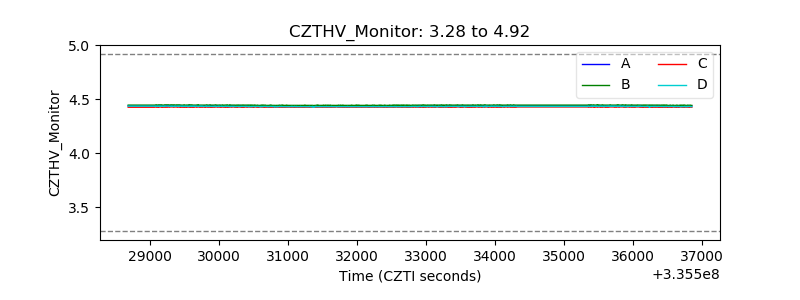 |
| D_VDD | 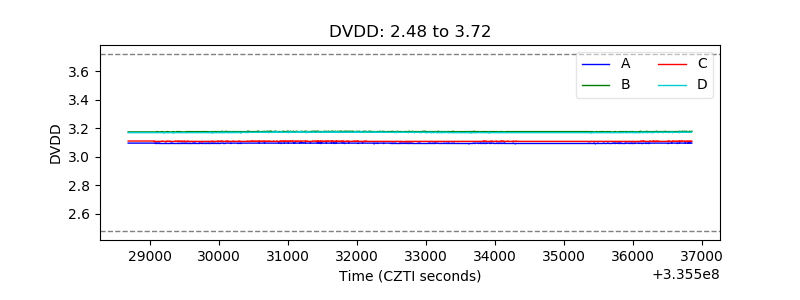 |
| Temperature 1 | 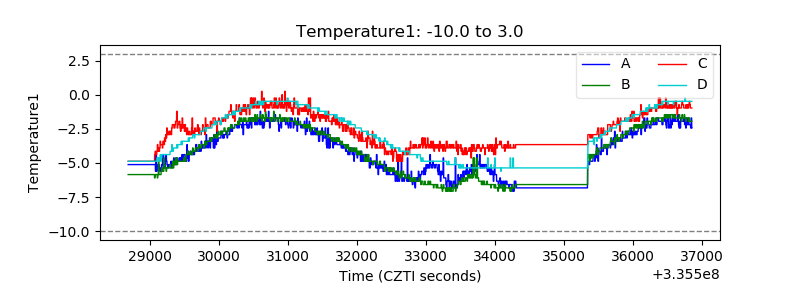 |
| Veto HV Monitor | 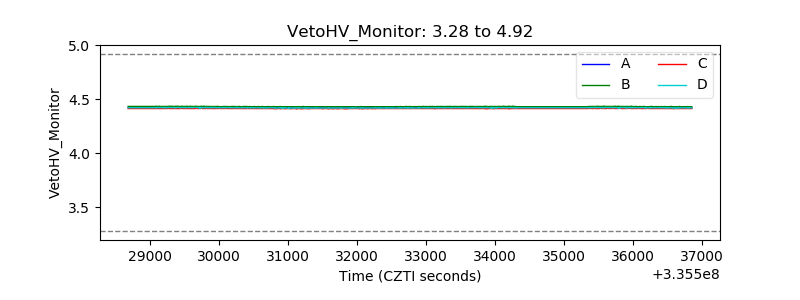 |
| Veto LLD | 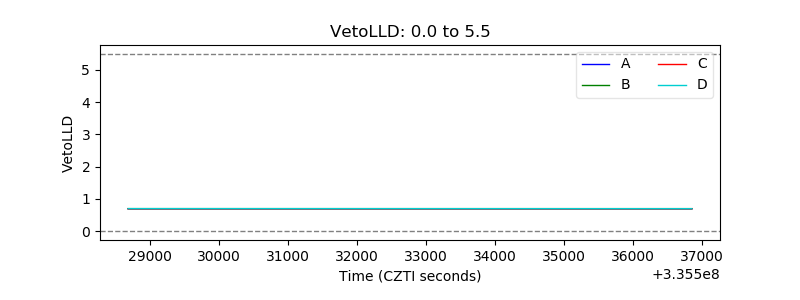 |
| Alpha Counter |  |
| _CPM_Rate | 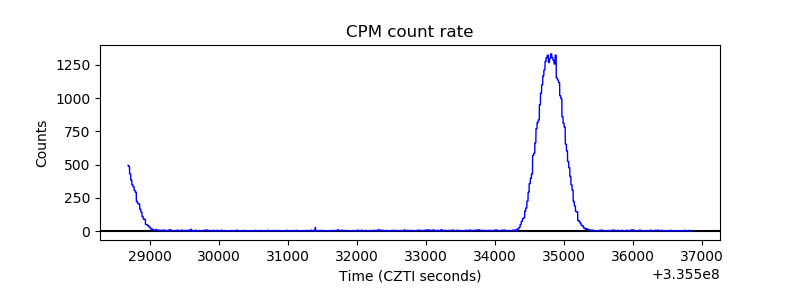 |
| CZT Counter |  |
| +2.5 Volts monitor |  |
| +5 Volts monitor |  |
| _ROLL_ROT | 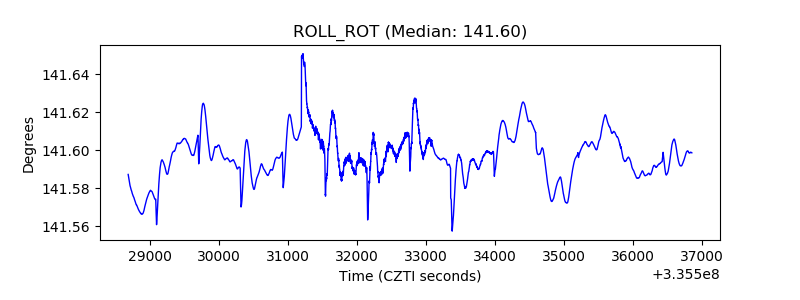 |
| _Roll_DEC | 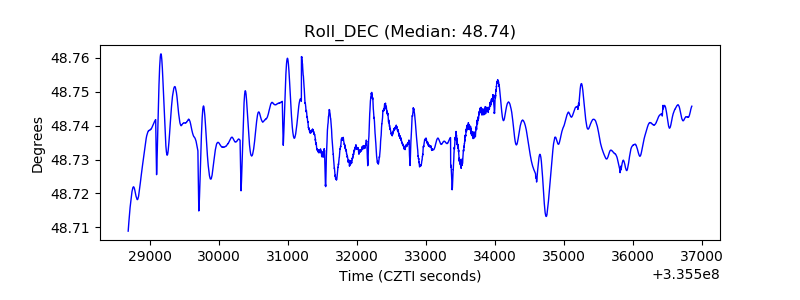 |
| _Roll_RA |  |
| Veto Counter | 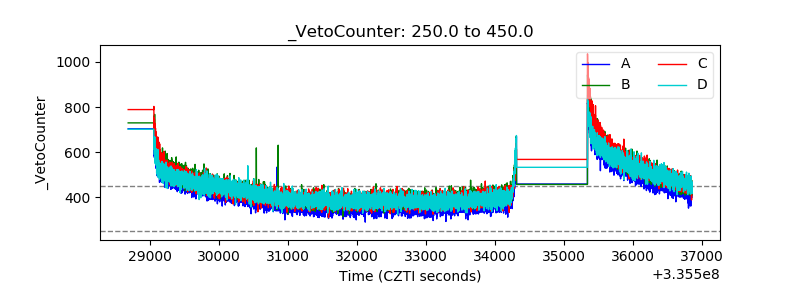 |