| Param | Original file | Final file |
|---|---|---|
| Filename | modeM0/AS1A09_056T01_9000003824_26457cztM0_level2.evt | modeM0/AS1A09_056T01_9000003824_26457cztM0_level2_quad_clean.evt |
| Size (bytes) | 670,204,800 | 98,199,360 |
| Size | 639.2 MB | 93.7 MB |
| Events in quadrant A | 3,130,429 | 743,557 |
| Events in quadrant B | 3,002,834 | 752,774 |
| Events in quadrant C | 3,192,448 | 711,271 |
| Events in quadrant D | 10,570,960 | 351,890 |
| Mode M9 | |||
|---|---|---|---|
| Quadrant | BADHDUFLAG | Total packets | Discarded packets |
| A | 0 | 12 | 0 |
| B | 0 | 12 | 0 |
| C | 0 | 12 | 0 |
| D | 0 | 12 | 0 |
| Mode M0 | |||
|---|---|---|---|
| Quadrant | BADHDUFLAG | Total packets | Discarded packets |
| A | 0 | 13213 | 0 |
| B | 0 | 12792 | 0 |
| C | 0 | 13317 | 0 |
| D | 0 | 35364 | 0 |
| Quadrant | Total seconds | Saturated seconds | Saturation percentage |
|---|---|---|---|
| A | 5911 | 91 | 1.539503% |
| B | 5912 | 36 | 0.608931% |
| C | 5912 | 80 | 1.353180% |
| D | 5911 | 3275 | 55.405177% |
Noise dominated data is calculated using 1-second bins in cleaned event files. If a bin has >2000 counts, and if more than 50% of those come from <1% of pixels, then it is considered to be noise-dominated and hence unusable.
| Quadrant | # 1 sec bins | Bins with >0 counts | Bins with >2000 counts | High rate bins dominated by noise | Noise dominated (total time) | Noise dominated (detector-on time) | Marked lightcurve |
|---|---|---|---|---|---|---|---|
| A | 7081 | 5912 | 44 | 44 | 0.62% | 0.74% |  |
| B | 7082 | 5913 | 1 | 1 | 0.01% | 0.02% | 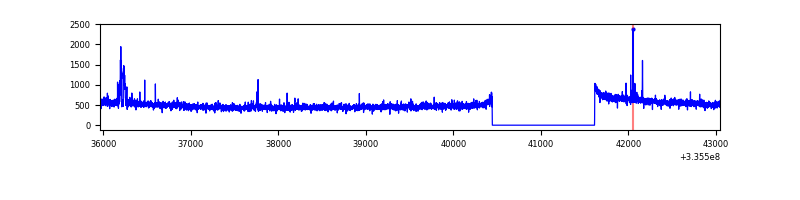 |
| C | 7082 | 5913 | 0 | 0 | 0.00% | 0.00% | 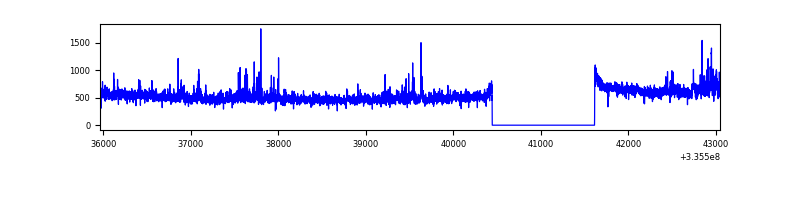 |
| D | 7081 | 5912 | 3194 | 3194 | 45.11% | 54.03% | 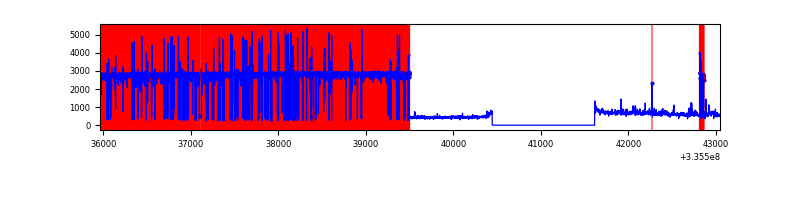 |
Top three noisy pixels from each quadrant. If the there are fewer than three noisy pixels in the level2.evt file, extra rows are filled as -1
| Pixel properties | Quadrant properties | ||||||
|---|---|---|---|---|---|---|---|
| Quadrant | DetID | PixID | Counts | Sigma | Mean | Median | Sigma |
| A | 6 | 16 | 190675 | 1254.2 | 758 | 744 | 151.4 |
| A | 12 | 189 | 13751 | 85.89 | 758 | 744 | 151.4 |
| A | 13 | 254 | 8789 | 53.12 | 758 | 744 | 151.4 |
| B | 0 | 190 | 66947 | 472.3 | 750 | 732 | 140.2 |
| B | 12 | 111 | 16759 | 114.32 | 750 | 732 | 140.2 |
| B | 11 | 111 | 14838 | 100.62 | 750 | 732 | 140.2 |
| C | 3 | 233 | 223305 | 1317.69 | 726 | 729 | 168.9 |
| C | 14 | 238 | 117651 | 692.2 | 726 | 729 | 168.9 |
| C | 14 | 176 | 9082 | 49.45 | 726 | 729 | 168.9 |
| D | 1 | 52 | 8775507 | 81510.79 | 453 | 443 | 107.7 |
| D | 13 | 168 | 24214 | 220.81 | 453 | 443 | 107.7 |
| D | 11 | 176 | 21060 | 191.51 | 453 | 443 | 107.7 |
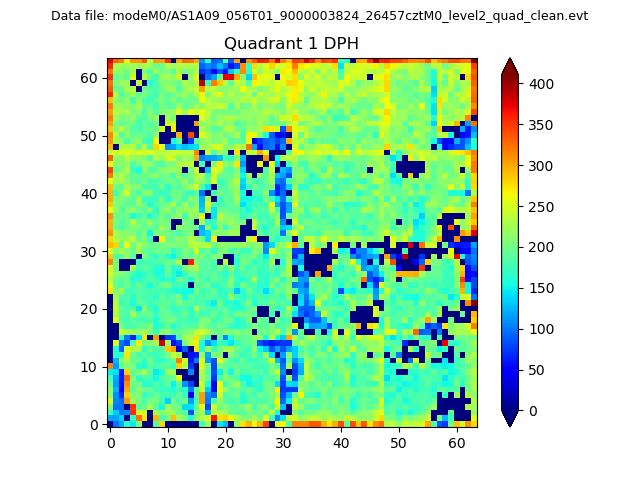
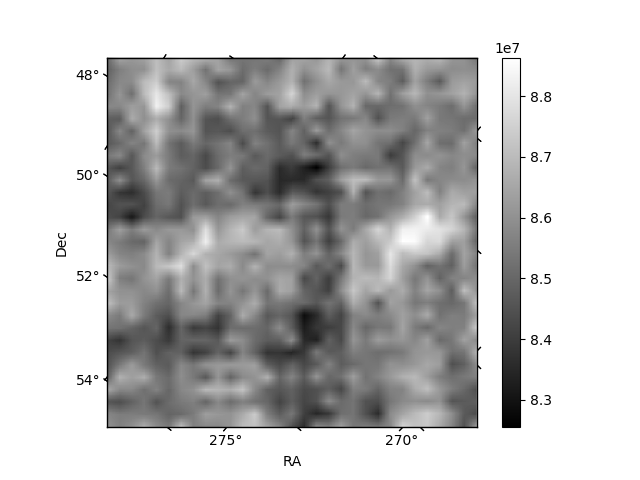
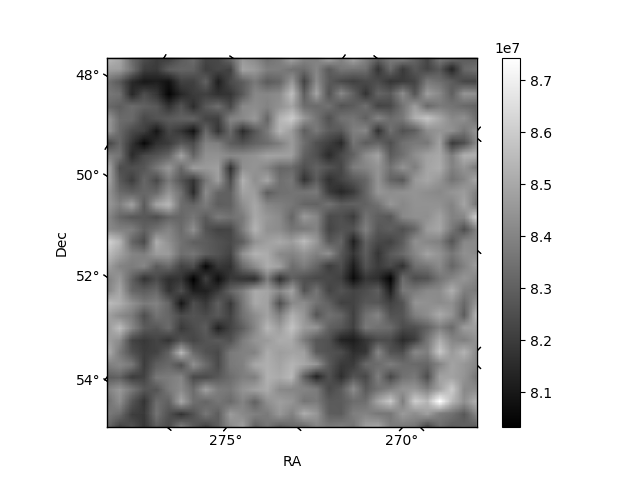
Histogram calculated using DETX and DETY for each event in the final _common_clean file
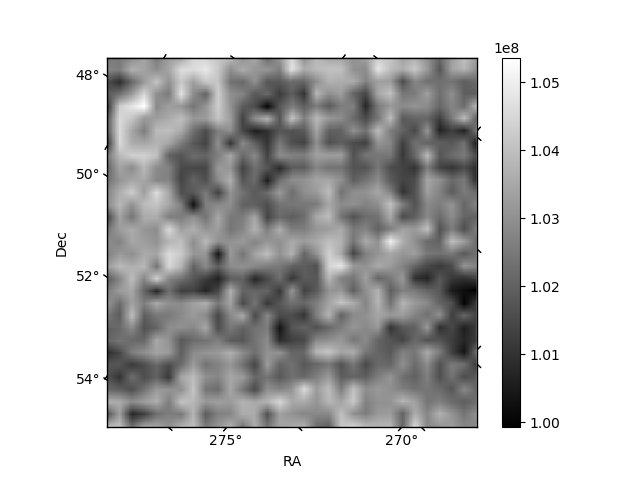
| Quadrant A | 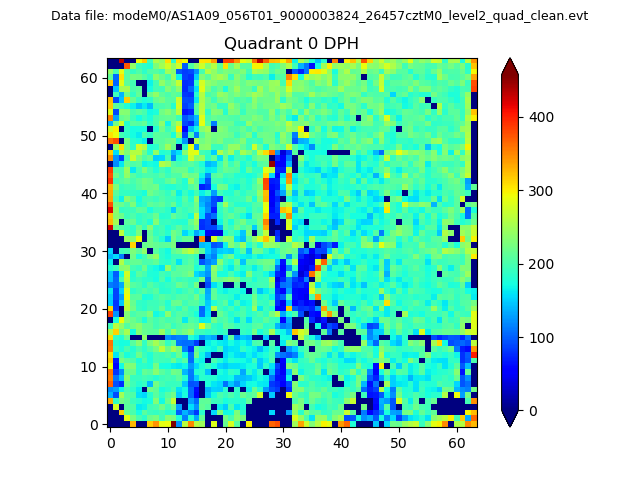 |
 |
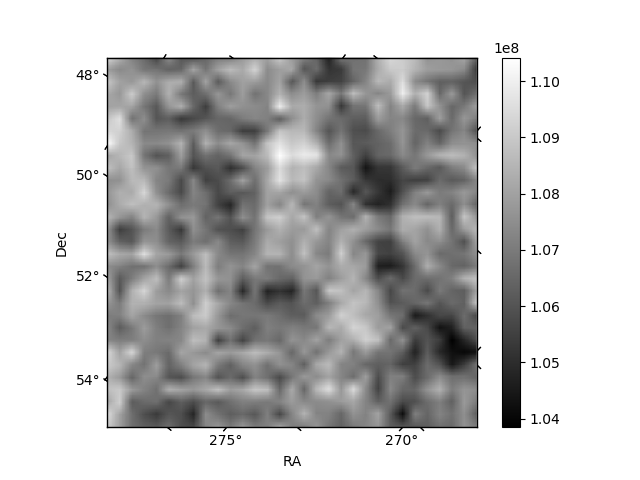
Quadrant B |
|---|---|---|---|
| Quadrant D | 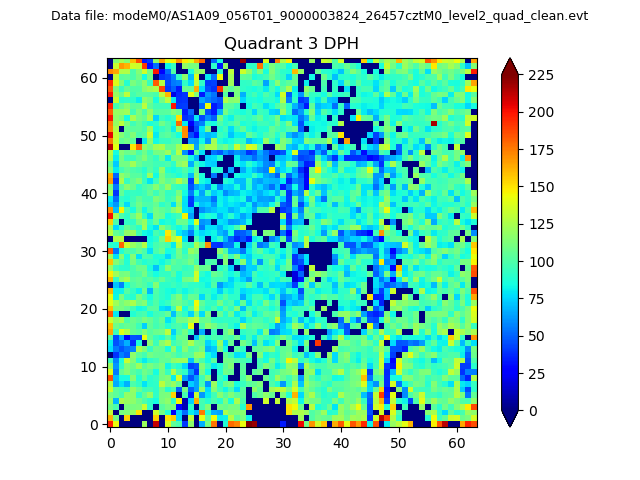 |
 |
Quadrant C |
| Plot type | Count rate plots | Images |
|---|---|---|
| Comparison with Poisson distribution Blue bars denote a histogram of data divided into 1 sec bins. Red curve is a Poisson curve with rate = median count rate of data. |
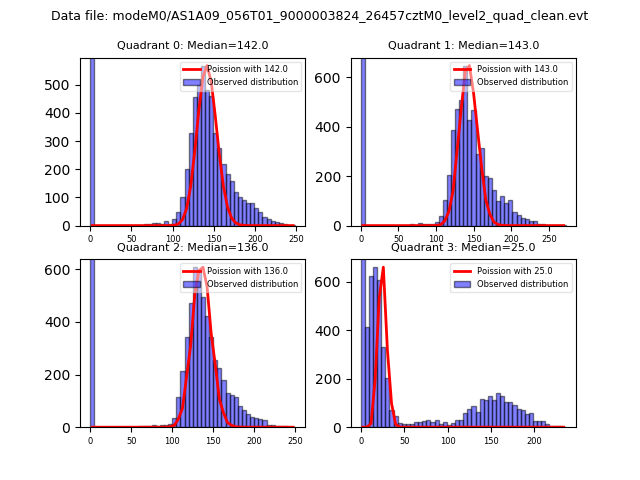 |
 |
| Quadrant-wise count rates Data is divided into 100 sec bins |
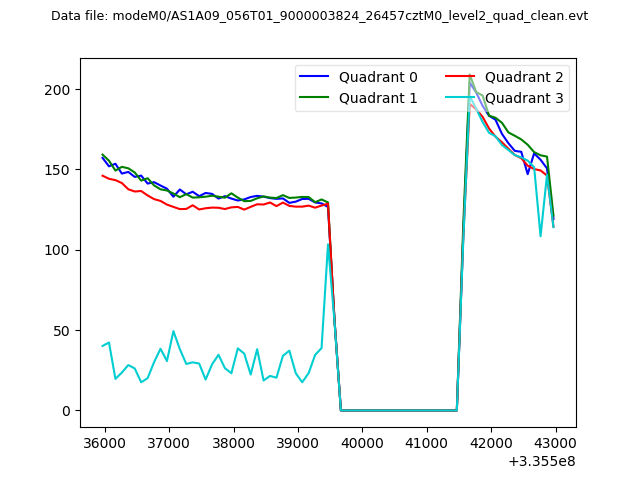 |
|
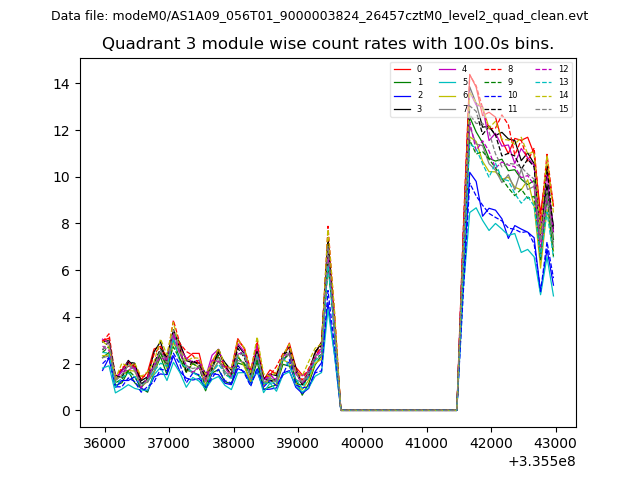
| Module-wise count rates for Quadrant A Data is divided into 100 sec bins |
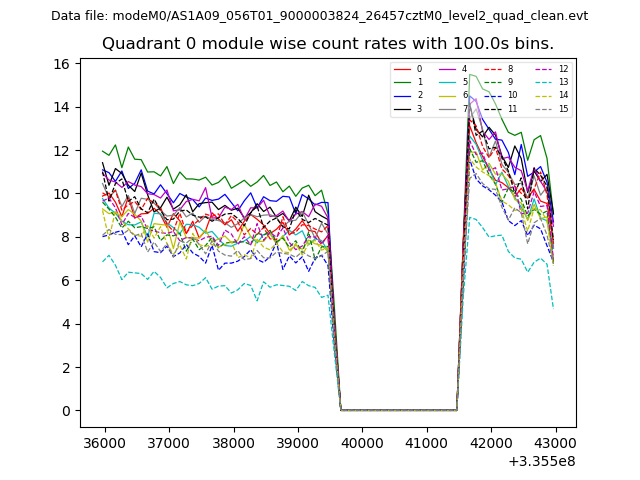 |
 |
| Module-wise count rates for Quadrant B Data is divided into 100 sec bins |
 |
 |
| Module-wise count rates for Quadrant C Data is divided into 100 sec bins |
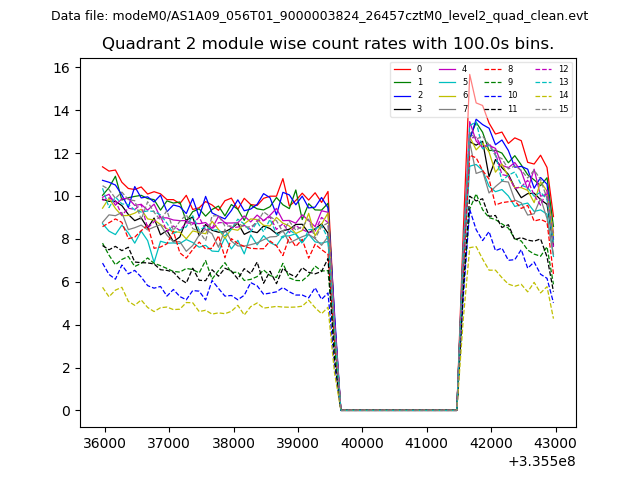 |
 |
| Module-wise count rates for Quadrant D Data is divided into 100 sec bins |
 |
 |
| Parameter | Plot |
|---|---|
| CZT HV Monitor | 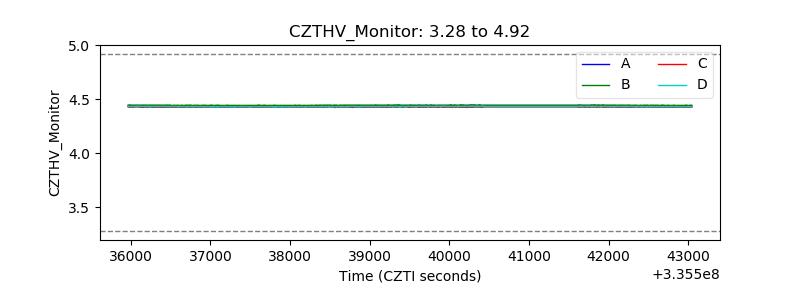 |
| D_VDD | 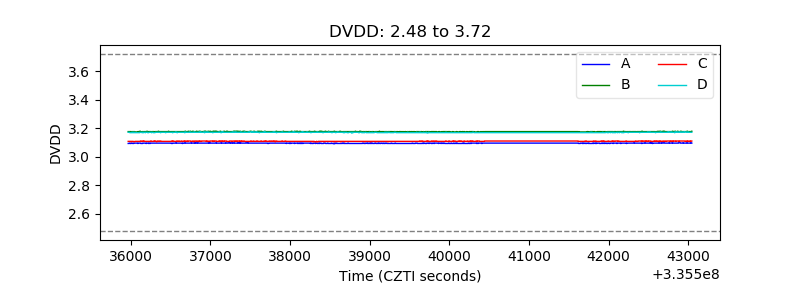 |
| Temperature 1 |  |
| Veto HV Monitor | 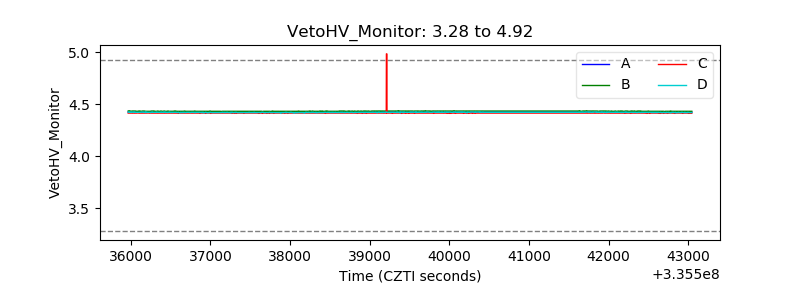 |
| Veto LLD | 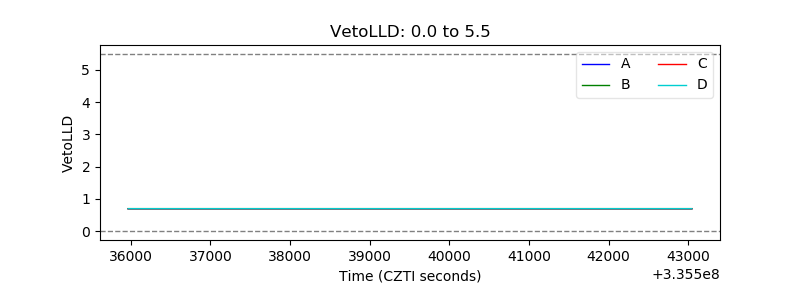 |
| Alpha Counter | 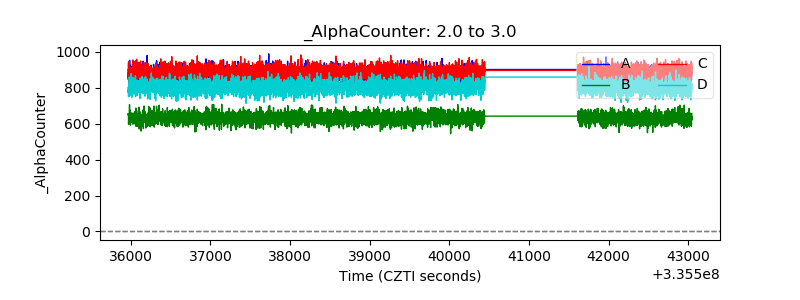 |
| _CPM_Rate | 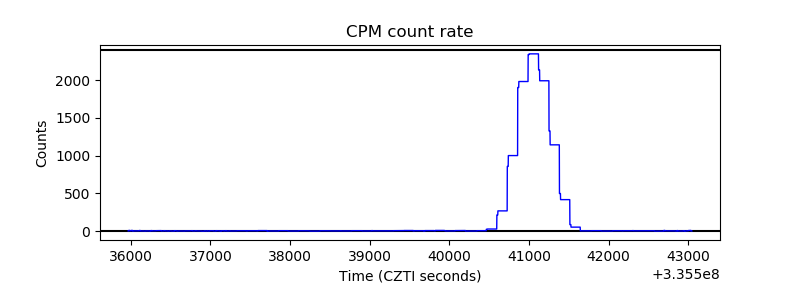 |
| CZT Counter | 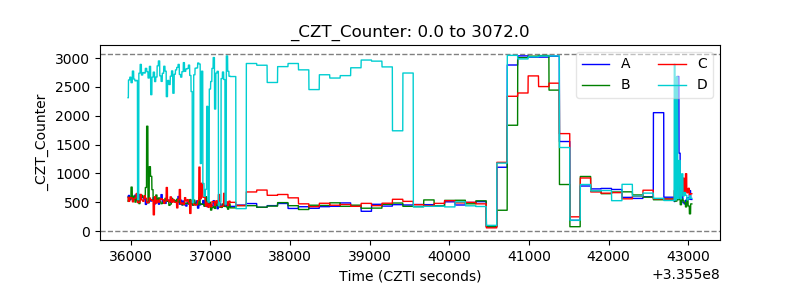 |
| +2.5 Volts monitor | 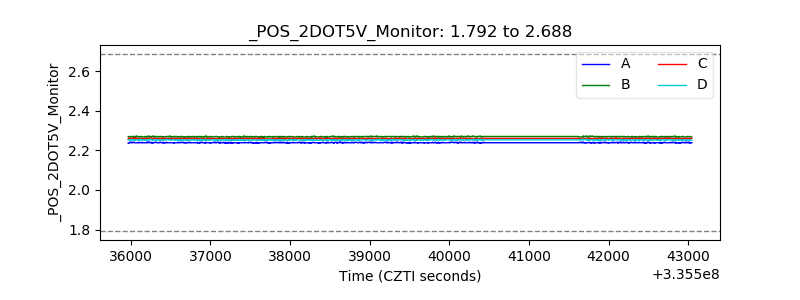 |
| +5 Volts monitor |  |
| _ROLL_ROT | 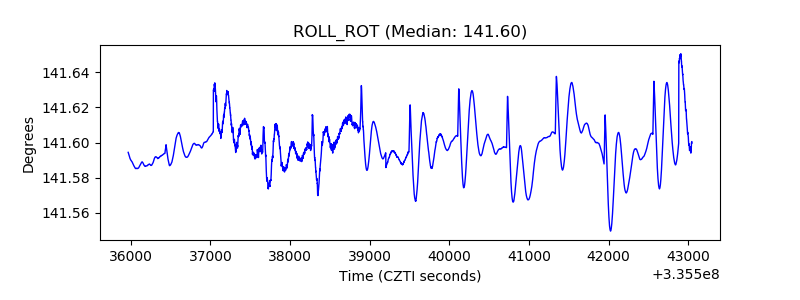 |
| _Roll_DEC | 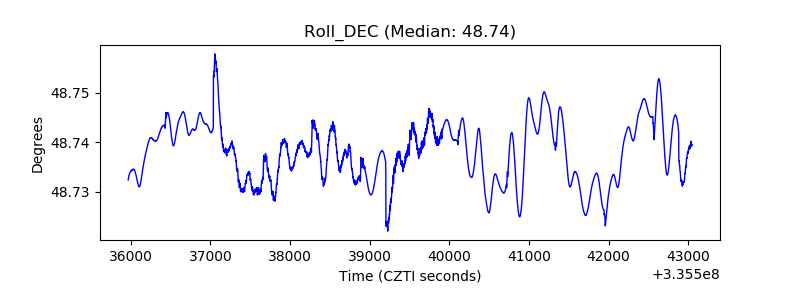 |
| _Roll_RA |  |
| Veto Counter | 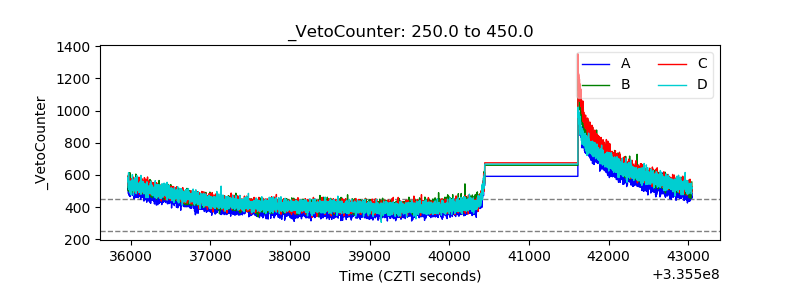 |