| Param | Original file | Final file |
|---|---|---|
| Filename | modeM0/AS1A09_056T01_9000003824_26458cztM0_level2.evt | modeM0/AS1A09_056T01_9000003824_26458cztM0_level2_quad_clean.evt |
| Size (bytes) | 621,676,800 | 112,469,760 |
| Size | 592.9 MB | 107.3 MB |
| Events in quadrant A | 3,454,749 | 806,474 |
| Events in quadrant B | 3,252,419 | 818,695 |
| Events in quadrant C | 3,641,475 | 775,454 |
| Events in quadrant D | 8,059,112 | 572,657 |
| Mode M9 | |||
|---|---|---|---|
| Quadrant | BADHDUFLAG | Total packets | Discarded packets |
| A | 0 | 13 | 0 |
| B | 0 | 13 | 0 |
| C | 0 | 13 | 0 |
| D | 0 | 13 | 0 |
| Mode M0 | |||
|---|---|---|---|
| Quadrant | BADHDUFLAG | Total packets | Discarded packets |
| A | 0 | 14385 | 0 |
| B | 0 | 13733 | 0 |
| C | 0 | 15108 | 0 |
| D | 0 | 28148 | 0 |
| Quadrant | Total seconds | Saturated seconds | Saturation percentage |
|---|---|---|---|
| A | 6195 | 99 | 1.598063% |
| B | 6196 | 43 | 0.693996% |
| C | 6196 | 122 | 1.969012% |
| D | 6196 | 2049 | 33.069722% |
Noise dominated data is calculated using 1-second bins in cleaned event files. If a bin has >2000 counts, and if more than 50% of those come from <1% of pixels, then it is considered to be noise-dominated and hence unusable.
| Quadrant | # 1 sec bins | Bins with >0 counts | Bins with >2000 counts | High rate bins dominated by noise | Noise dominated (total time) | Noise dominated (detector-on time) | Marked lightcurve |
|---|---|---|---|---|---|---|---|
| A | 7485 | 6196 | 44 | 44 | 0.59% | 0.71% | 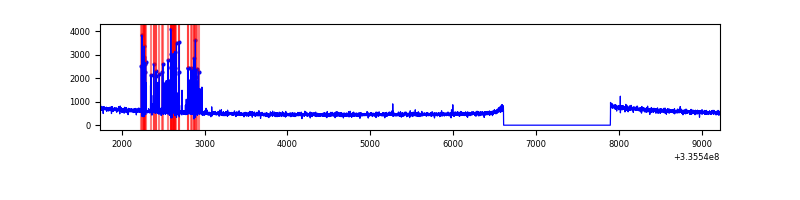 |
| B | 7486 | 6197 | 2 | 2 | 0.03% | 0.03% | 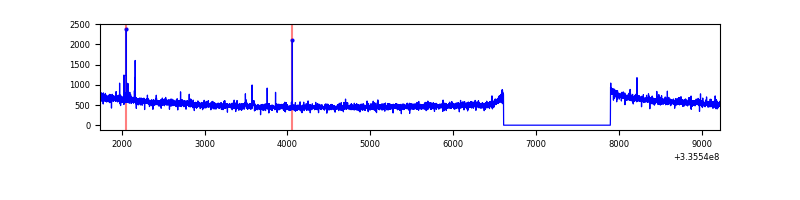 |
| C | 7486 | 6197 | 11 | 11 | 0.15% | 0.18% | 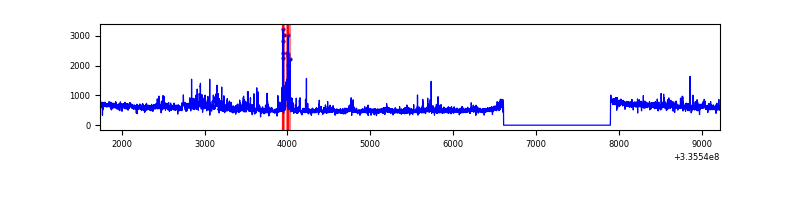 |
| D | 7485 | 6195 | 1928 | 1928 | 25.76% | 31.12% | 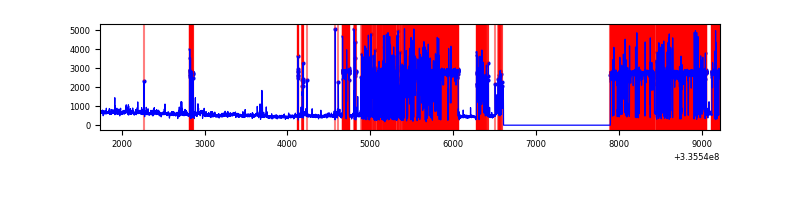 |
Top three noisy pixels from each quadrant. If the there are fewer than three noisy pixels in the level2.evt file, extra rows are filled as -1
| Pixel properties | Quadrant properties | ||||||
|---|---|---|---|---|---|---|---|
| Quadrant | DetID | PixID | Counts | Sigma | Mean | Median | Sigma |
| A | 6 | 16 | 230451 | 1395.43 | 834 | 820 | 164.6 |
| A | 12 | 189 | 10085 | 56.3 | 834 | 820 | 164.6 |
| A | 13 | 254 | 9627 | 53.52 | 834 | 820 | 164.6 |
| B | 0 | 190 | 29505 | 189.69 | 824 | 806 | 151.3 |
| B | 12 | 111 | 17571 | 110.81 | 824 | 806 | 151.3 |
| B | 11 | 111 | 15858 | 99.49 | 824 | 806 | 151.3 |
| C | 3 | 233 | 261048 | 1406.7 | 804 | 812 | 185.0 |
| C | 14 | 238 | 131752 | 707.79 | 804 | 812 | 185.0 |
| C | 2 | 16 | 98519 | 528.15 | 804 | 812 | 185.0 |
| D | 1 | 52 | 5597246 | 38104.93 | 618 | 605 | 146.9 |
| D | 7 | 80 | 34206 | 228.77 | 618 | 605 | 146.9 |
| D | 2 | 234 | 21687 | 143.54 | 618 | 605 | 146.9 |
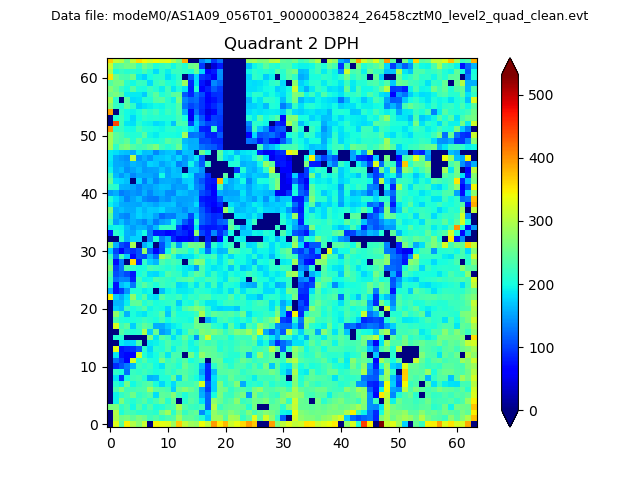
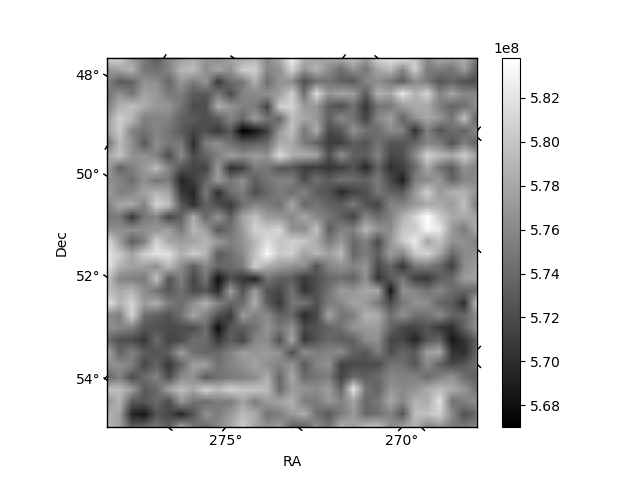
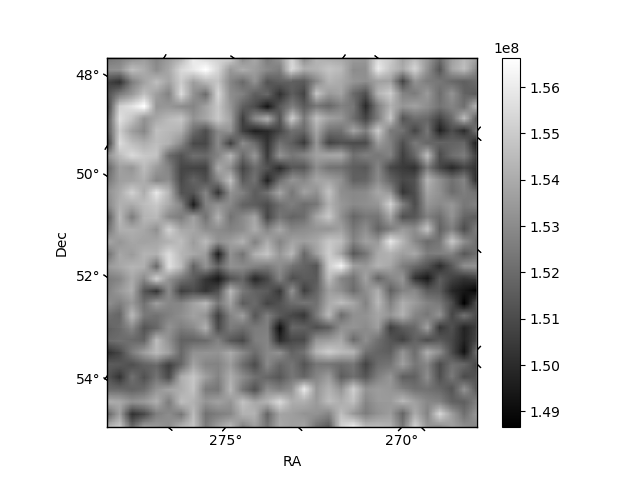
Histogram calculated using DETX and DETY for each event in the final _common_clean file
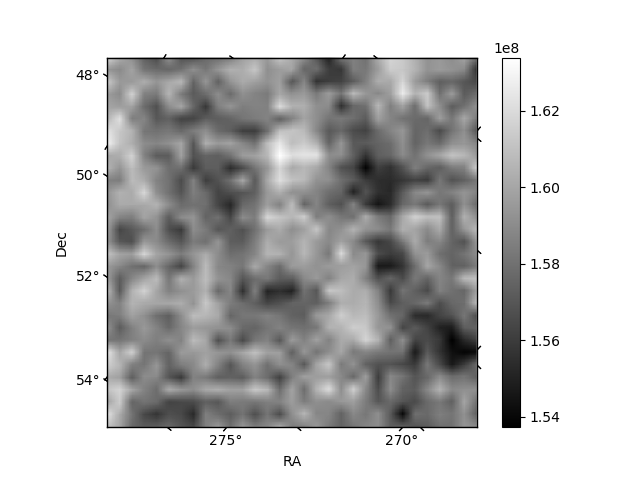
| Quadrant A | 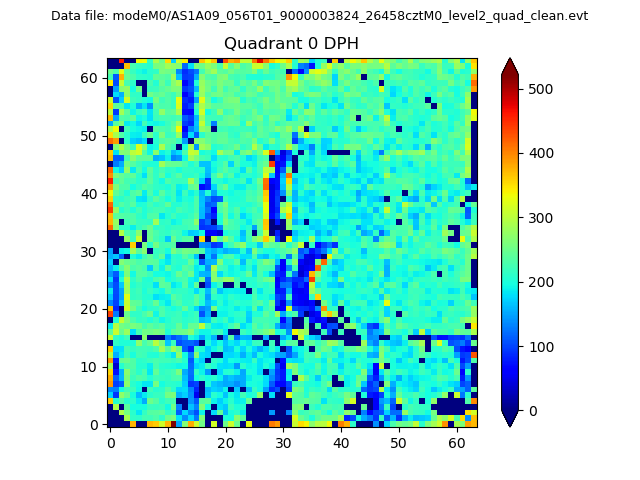 |
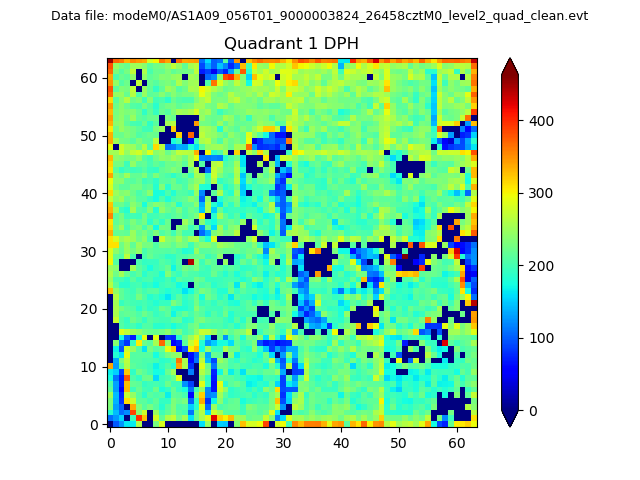 |
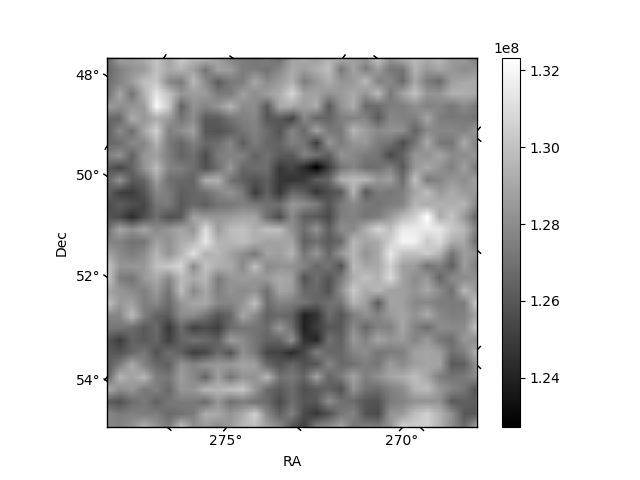
Quadrant B |
|---|---|---|---|
| Quadrant D | 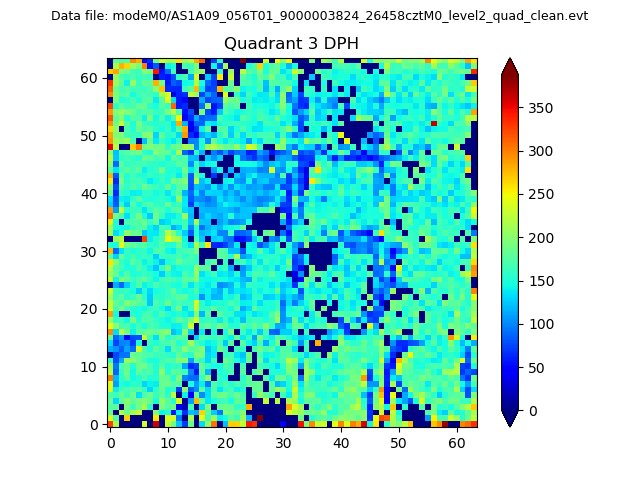 |
 |
Quadrant C |
| Plot type | Count rate plots | Images |
|---|---|---|
| Comparison with Poisson distribution Blue bars denote a histogram of data divided into 1 sec bins. Red curve is a Poisson curve with rate = median count rate of data. |
 |
 |
| Quadrant-wise count rates Data is divided into 100 sec bins |
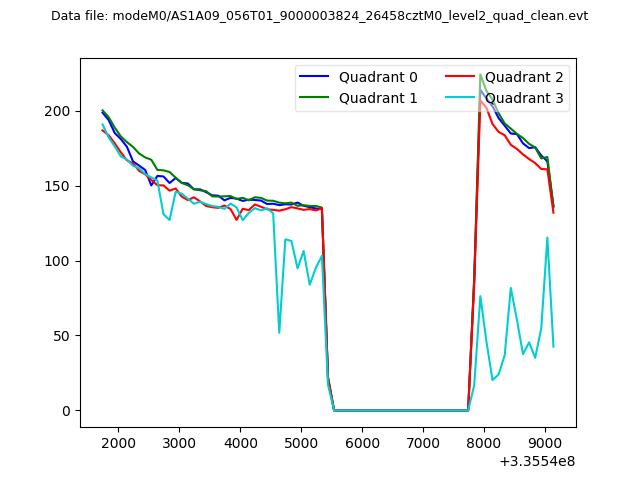 |
|
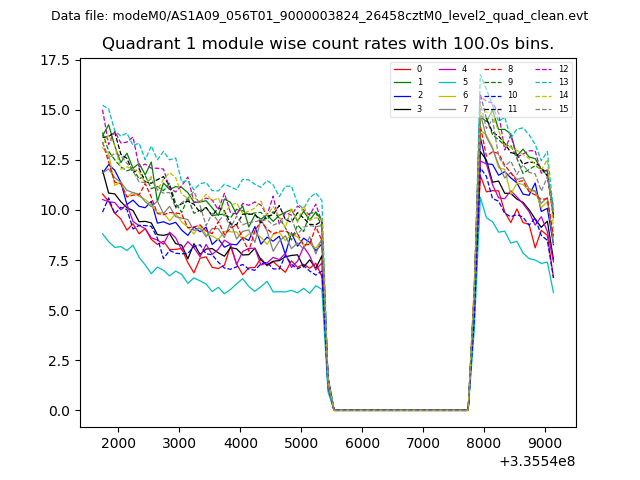
| Module-wise count rates for Quadrant A Data is divided into 100 sec bins |
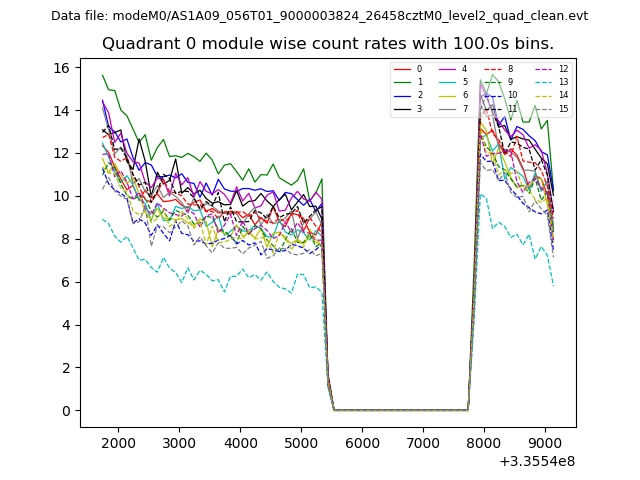 |
 |
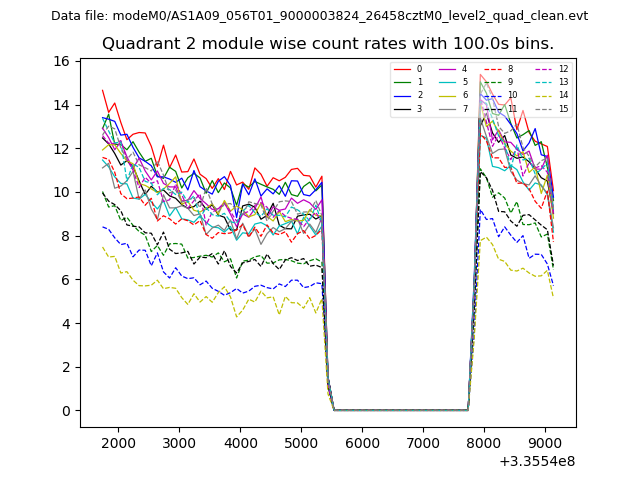
| Module-wise count rates for Quadrant B Data is divided into 100 sec bins |
 |
 |
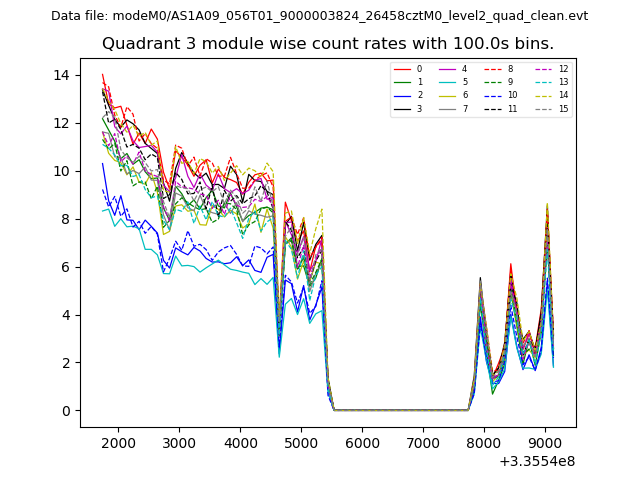
| Module-wise count rates for Quadrant C Data is divided into 100 sec bins |
 |
 |
| Module-wise count rates for Quadrant D Data is divided into 100 sec bins |
 |
 |
| Parameter | Plot |
|---|---|
| CZT HV Monitor | 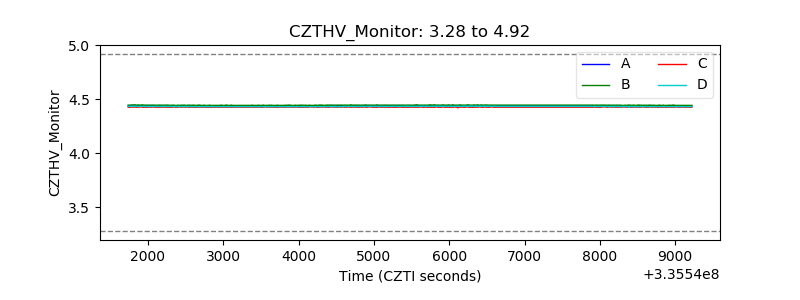 |
| D_VDD | 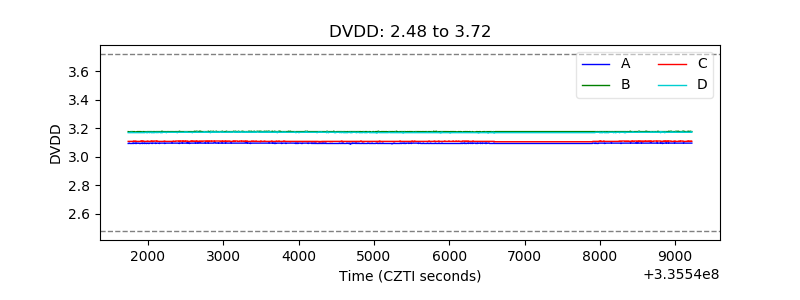 |
| Temperature 1 |  |
| Veto HV Monitor | 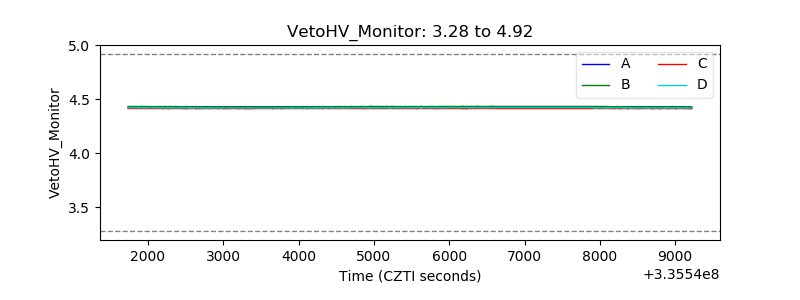 |
| Veto LLD | 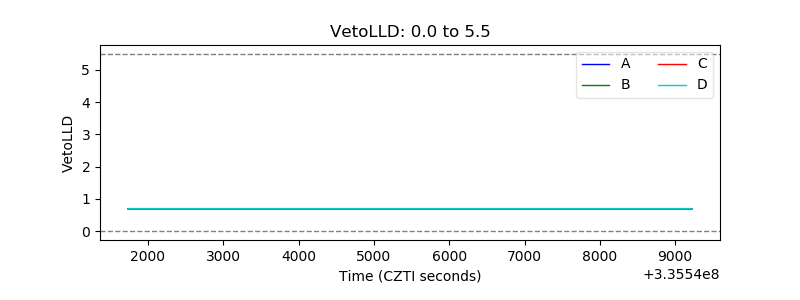 |
| Alpha Counter | 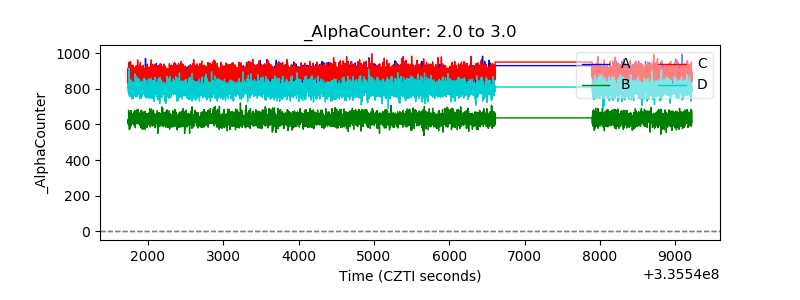 |
| _CPM_Rate | 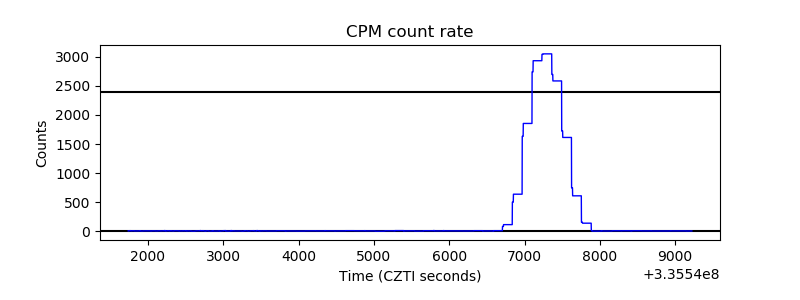 |
| CZT Counter | 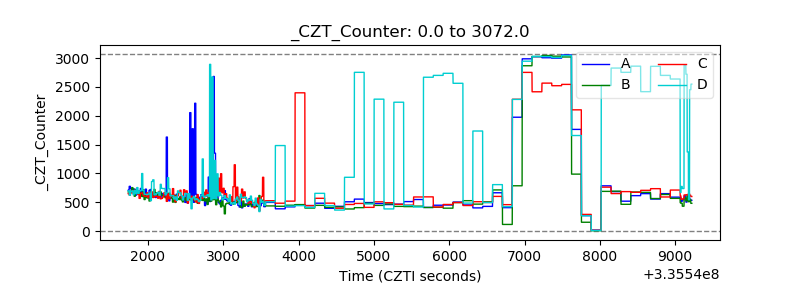 |
| +2.5 Volts monitor |  |
| +5 Volts monitor |  |
| _ROLL_ROT | 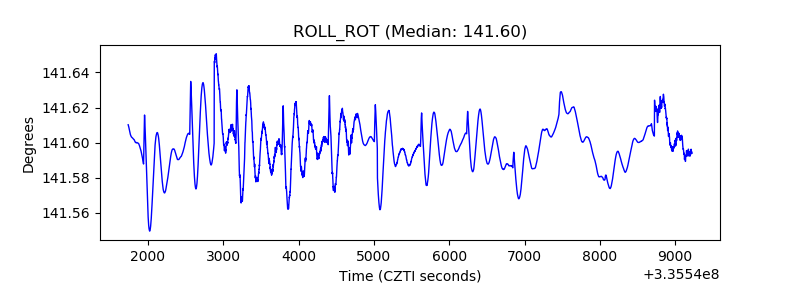 |
| _Roll_DEC | 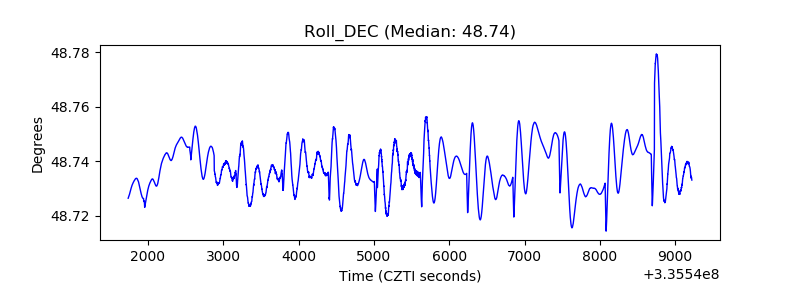 |
| _Roll_RA | 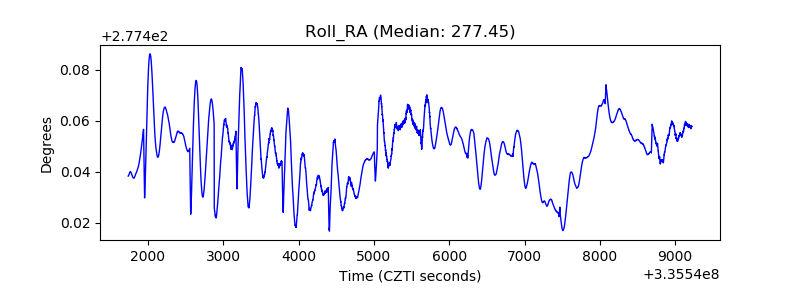 |
| Veto Counter | 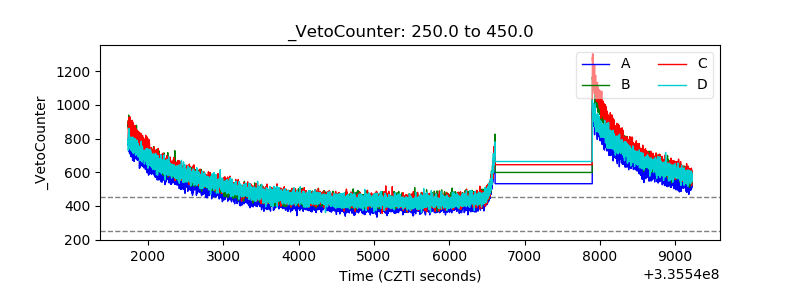 |