| Param | Original file | Final file |
|---|---|---|
| Filename | modeM0/AS1A09_056T01_9000003824_26459cztM0_level2.evt | modeM0/AS1A09_056T01_9000003824_26459cztM0_level2_quad_clean.evt |
| Size (bytes) | 633,692,160 | 108,809,280 |
| Size | 604.3 MB | 103.8 MB |
| Events in quadrant A | 3,326,064 | 795,175 |
| Events in quadrant B | 3,323,081 | 808,102 |
| Events in quadrant C | 3,594,248 | 768,501 |
| Events in quadrant D | 8,528,972 | 490,912 |
| Mode M9 | |||
|---|---|---|---|
| Quadrant | BADHDUFLAG | Total packets | Discarded packets |
| A | 0 | 13 | 0 |
| B | 0 | 14 | 0 |
| C | 0 | 14 | 0 |
| D | 0 | 14 | 0 |
| Mode M0 | |||
|---|---|---|---|
| Quadrant | BADHDUFLAG | Total packets | Discarded packets |
| A | 0 | 13919 | 0 |
| B | 0 | 13821 | 0 |
| C | 0 | 14834 | 0 |
| D | 0 | 29553 | 0 |
| Quadrant | Total seconds | Saturated seconds | Saturation percentage |
|---|---|---|---|
| A | 6186 | 64 | 1.034594% |
| B | 6186 | 64 | 1.034594% |
| C | 6186 | 140 | 2.263175% |
| D | 6186 | 2236 | 36.146136% |
Noise dominated data is calculated using 1-second bins in cleaned event files. If a bin has >2000 counts, and if more than 50% of those come from <1% of pixels, then it is considered to be noise-dominated and hence unusable.
| Quadrant | # 1 sec bins | Bins with >0 counts | Bins with >2000 counts | High rate bins dominated by noise | Noise dominated (total time) | Noise dominated (detector-on time) | Marked lightcurve |
|---|---|---|---|---|---|---|---|
| A | 7531 | 6187 | 0 | 0 | 0.00% | 0.00% | 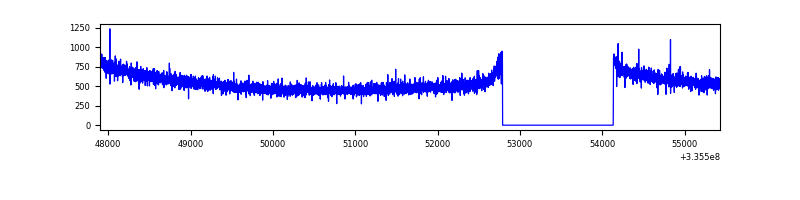 |
| B | 7531 | 6186 | 0 | 0 | 0.00% | 0.00% | 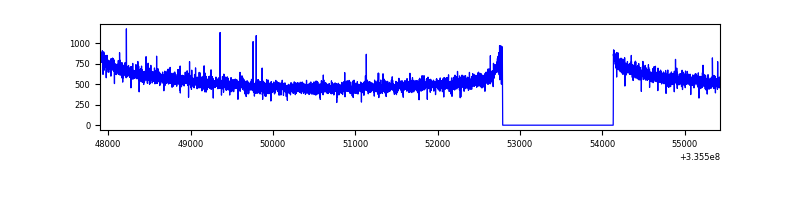 |
| C | 7531 | 6186 | 1 | 1 | 0.01% | 0.02% | 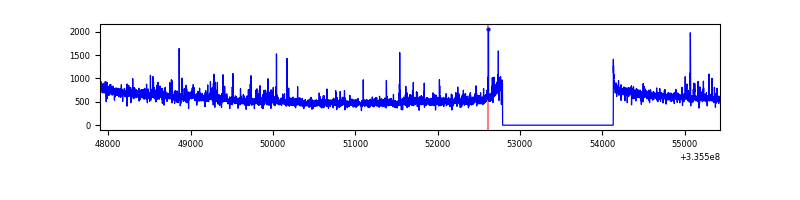 |
| D | 7531 | 6186 | 2079 | 2079 | 27.61% | 33.61% | 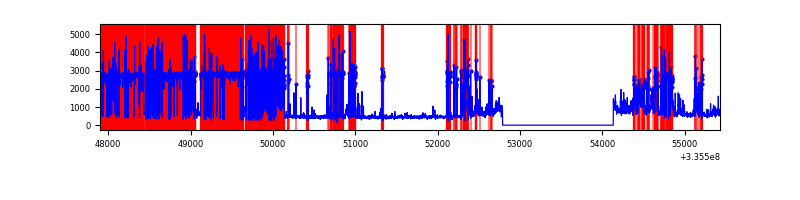 |
Top three noisy pixels from each quadrant. If the there are fewer than three noisy pixels in the level2.evt file, extra rows are filled as -1
| Pixel properties | Quadrant properties | ||||||
|---|---|---|---|---|---|---|---|
| Quadrant | DetID | PixID | Counts | Sigma | Mean | Median | Sigma |
| A | 6 | 16 | 22482 | 128.57 | 855 | 842 | 168.3 |
| A | 13 | 254 | 10466 | 57.18 | 855 | 842 | 168.3 |
| A | 0 | 226 | 7393 | 38.92 | 855 | 842 | 168.3 |
| B | 12 | 111 | 17514 | 107.1 | 848 | 830 | 155.8 |
| B | 11 | 111 | 15630 | 95.0 | 848 | 830 | 155.8 |
| B | 14 | 111 | 13741 | 82.88 | 848 | 830 | 155.8 |
| C | 3 | 233 | 159747 | 832.99 | 830 | 835 | 190.8 |
| C | 14 | 238 | 135985 | 708.44 | 830 | 835 | 190.8 |
| C | 2 | 16 | 48889 | 251.89 | 830 | 835 | 190.8 |
| D | 1 | 52 | 5748021 | 39351.54 | 622 | 607 | 146.1 |
| D | 7 | 80 | 331582 | 2266.13 | 622 | 607 | 146.1 |
| D | 13 | 104 | 29301 | 196.46 | 622 | 607 | 146.1 |
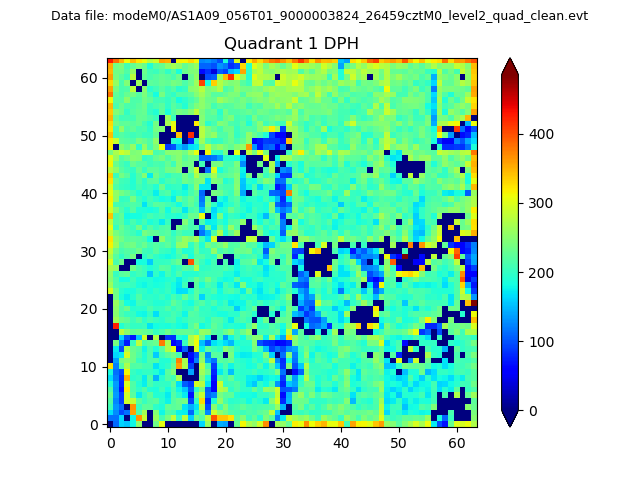
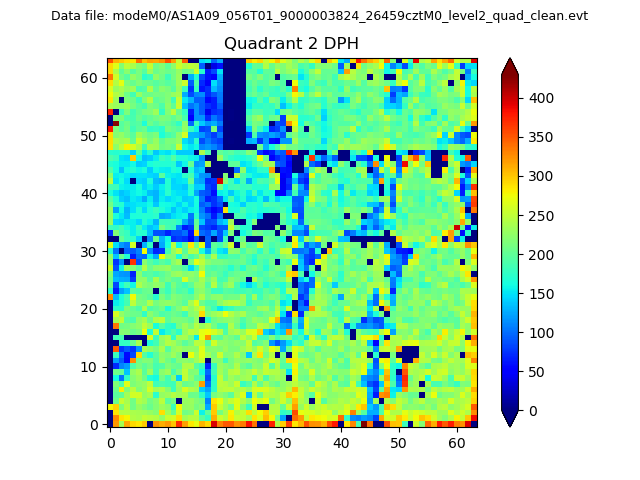
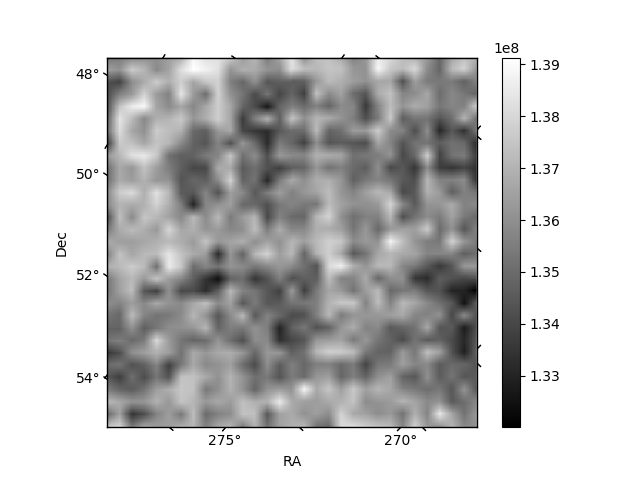
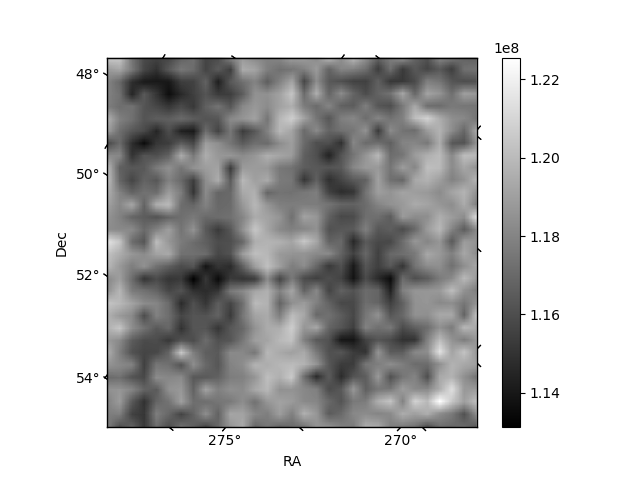
Histogram calculated using DETX and DETY for each event in the final _common_clean file
| Quadrant A |  |
 |
Quadrant B |
|---|---|---|---|
| Quadrant D | 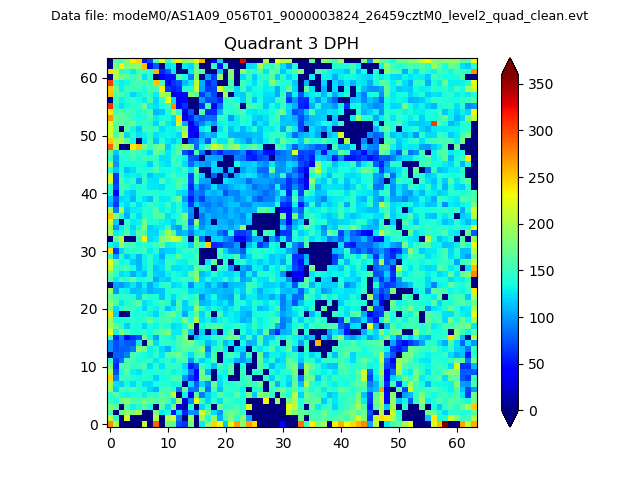 |
 |
Quadrant C |
| Plot type | Count rate plots | Images |
|---|---|---|
| Comparison with Poisson distribution Blue bars denote a histogram of data divided into 1 sec bins. Red curve is a Poisson curve with rate = median count rate of data. |
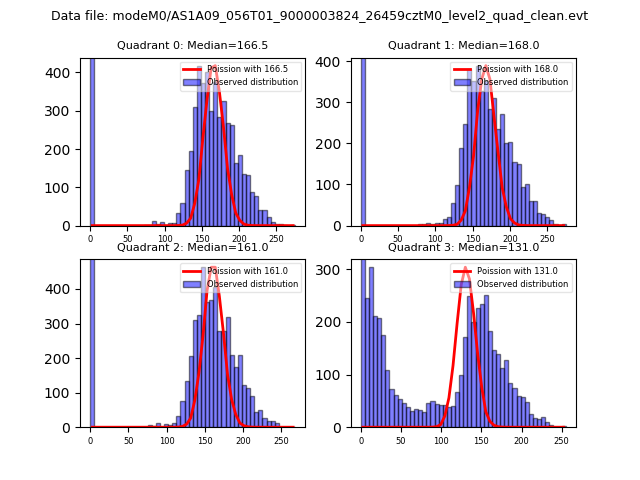 |
 |
| Quadrant-wise count rates Data is divided into 100 sec bins |
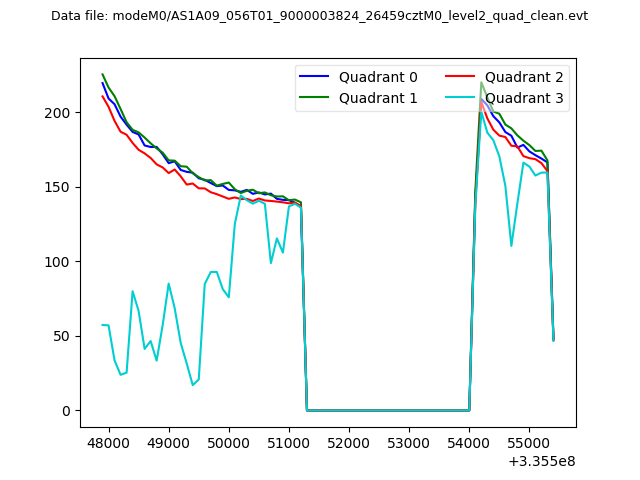 |
|
| Module-wise count rates for Quadrant A Data is divided into 100 sec bins |
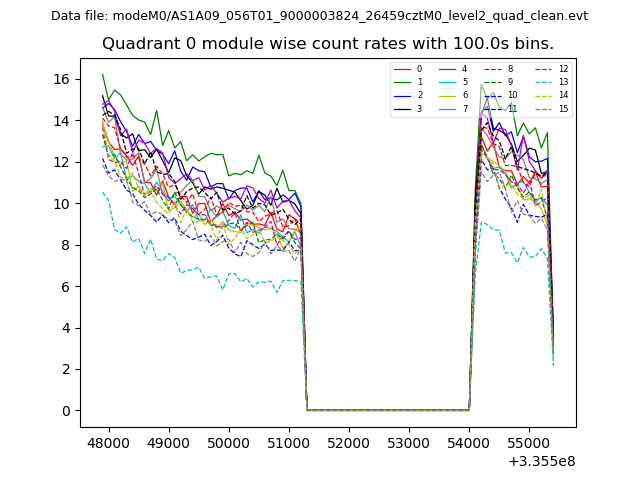 |
 |
| Module-wise count rates for Quadrant B Data is divided into 100 sec bins |
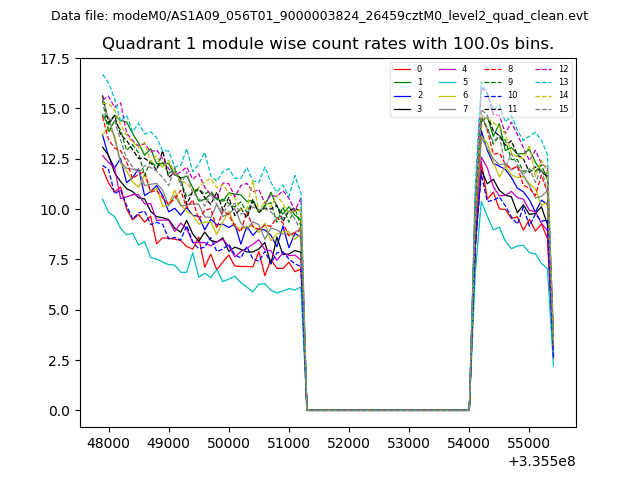 |
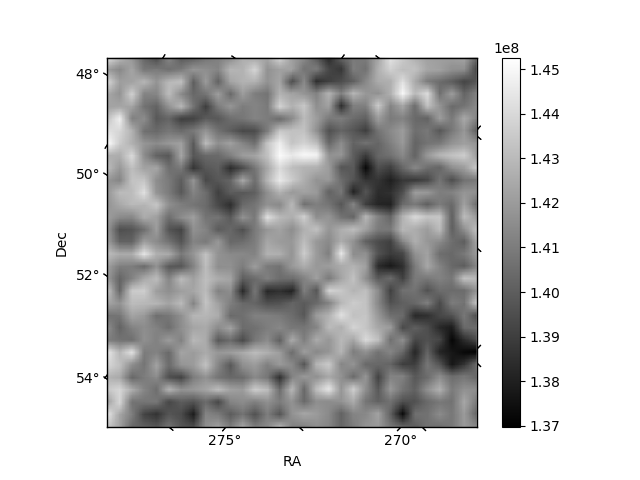 |
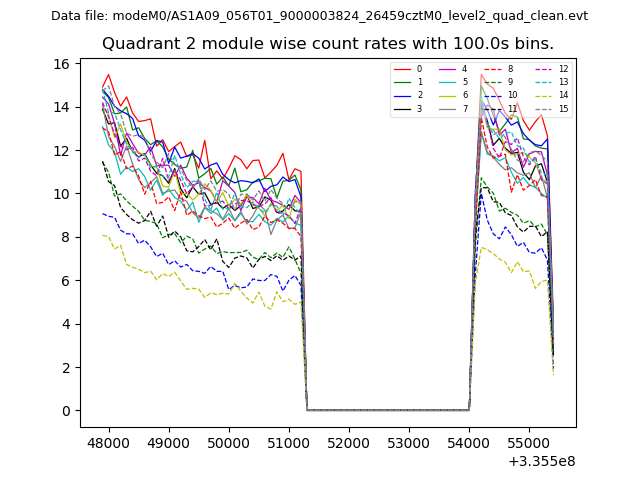
| Module-wise count rates for Quadrant C Data is divided into 100 sec bins |
 |
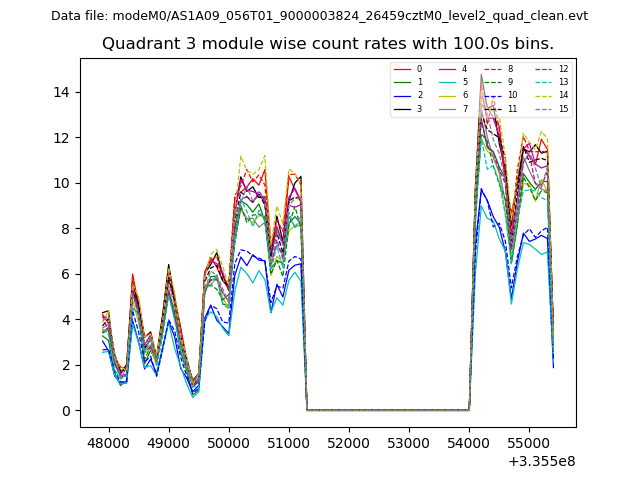
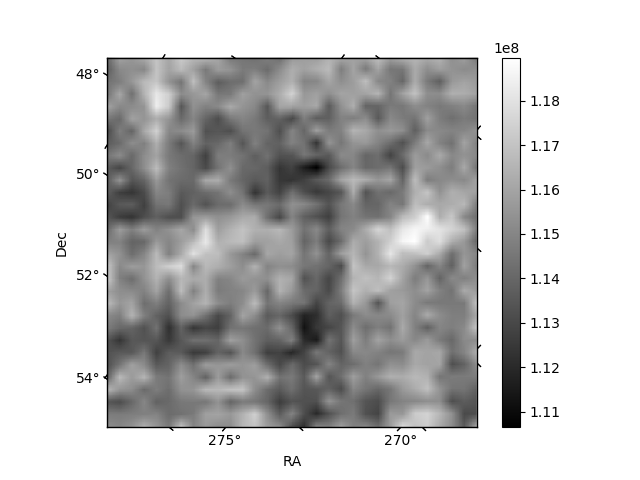 |
| Module-wise count rates for Quadrant D Data is divided into 100 sec bins |
 |
 |
| Parameter | Plot |
|---|---|
| CZT HV Monitor | 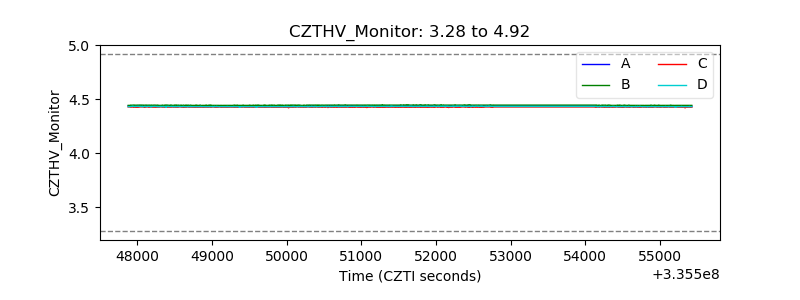 |
| D_VDD | 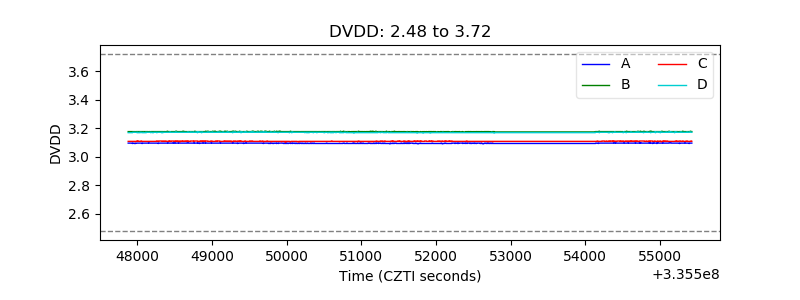 |
| Temperature 1 | 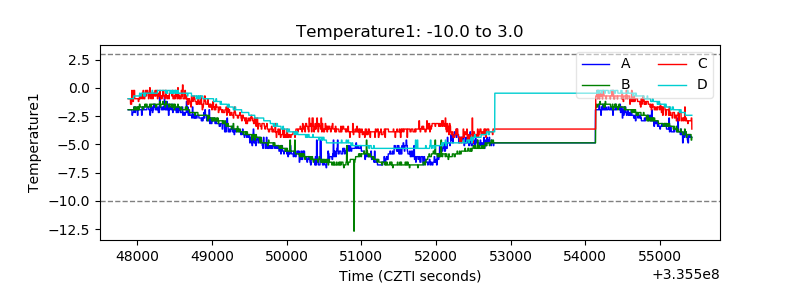 |
| Veto HV Monitor | 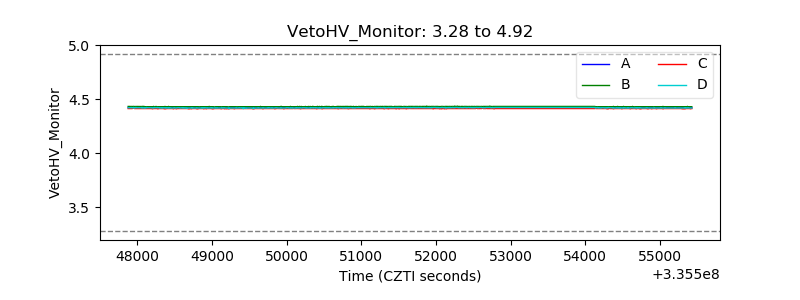 |
| Veto LLD | 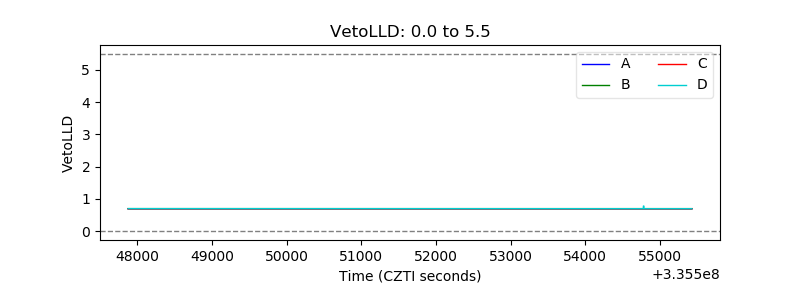 |
| Alpha Counter | 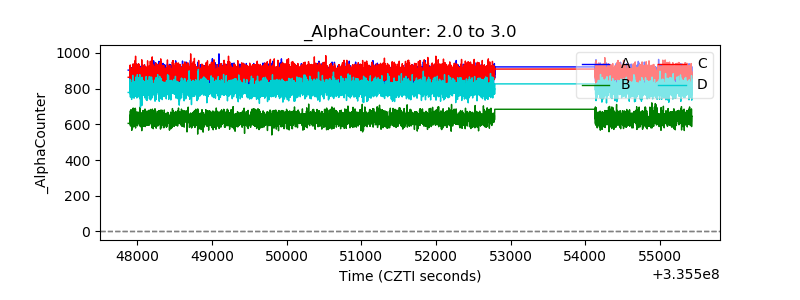 |
| _CPM_Rate | 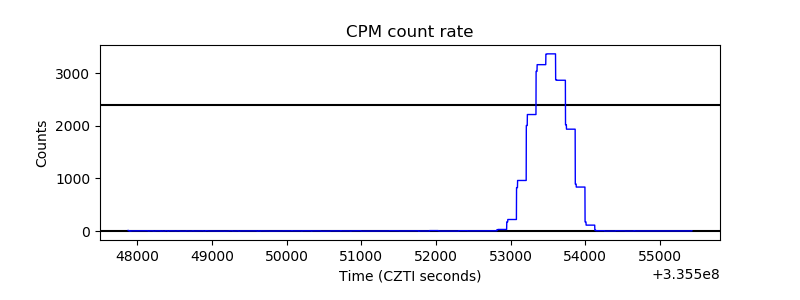 |
| CZT Counter | 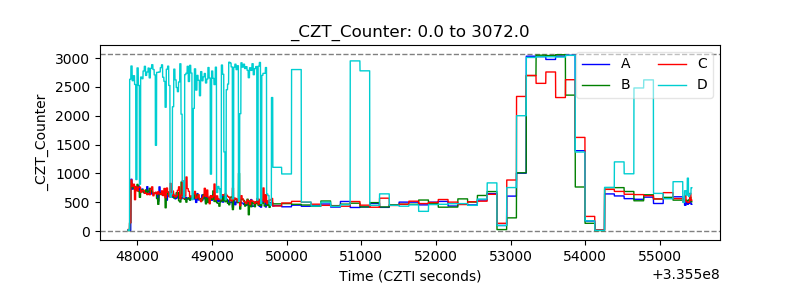 |
| +2.5 Volts monitor |  |
| +5 Volts monitor |  |
| _ROLL_ROT | 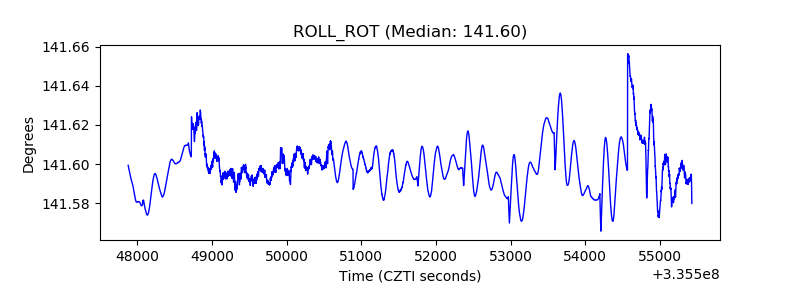 |
| _Roll_DEC | 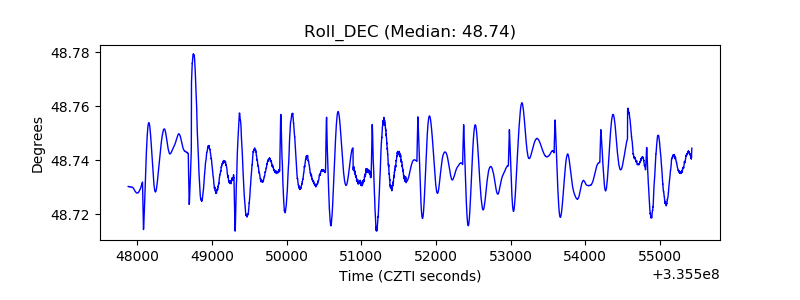 |
| _Roll_RA | 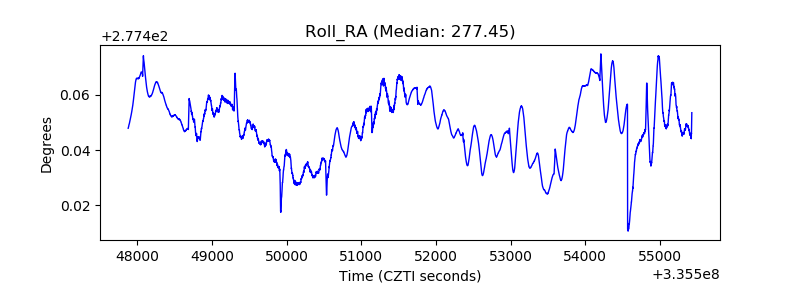 |
| Veto Counter | 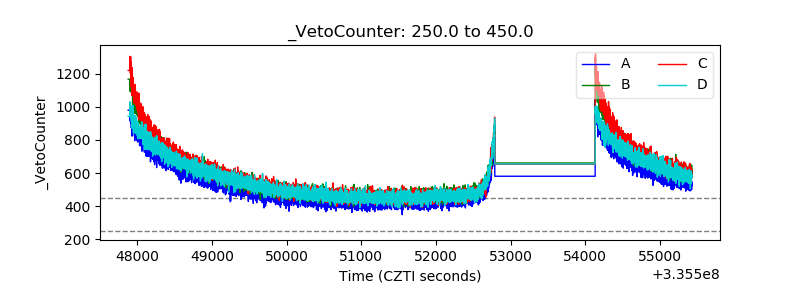 |