| Param | Original file | Final file |
|---|---|---|
| Filename | modeM0/AS1A09_056T01_9000003824_26460cztM0_level2.evt | modeM0/AS1A09_056T01_9000003824_26460cztM0_level2_quad_clean.evt |
| Size (bytes) | 555,203,520 | 105,336,000 |
| Size | 529.5 MB | 100.5 MB |
| Events in quadrant A | 3,238,375 | 717,952 |
| Events in quadrant B | 3,278,202 | 737,434 |
| Events in quadrant C | 3,649,351 | 703,594 |
| Events in quadrant D | 6,231,463 | 601,333 |
| Mode M9 | |||
|---|---|---|---|
| Quadrant | BADHDUFLAG | Total packets | Discarded packets |
| A | 0 | 18 | 0 |
| B | 0 | 19 | 0 |
| C | 0 | 19 | 0 |
| D | 0 | 19 | 0 |
| Mode M0 | |||
|---|---|---|---|
| Quadrant | BADHDUFLAG | Total packets | Discarded packets |
| A | 0 | 13496 | 0 |
| B | 0 | 13524 | 0 |
| C | 0 | 14869 | 0 |
| D | 0 | 22700 | 0 |
| Quadrant | Total seconds | Saturated seconds | Saturation percentage |
|---|---|---|---|
| A | 6149 | 55 | 0.894454% |
| B | 6148 | 63 | 1.024723% |
| C | 6148 | 157 | 2.553676% |
| D | 6148 | 1076 | 17.501627% |
Noise dominated data is calculated using 1-second bins in cleaned event files. If a bin has >2000 counts, and if more than 50% of those come from <1% of pixels, then it is considered to be noise-dominated and hence unusable.
| Quadrant | # 1 sec bins | Bins with >0 counts | Bins with >2000 counts | High rate bins dominated by noise | Noise dominated (total time) | Noise dominated (detector-on time) | Marked lightcurve |
|---|---|---|---|---|---|---|---|
| A | 7529 | 6150 | 0 | 0 | 0.00% | 0.00% | 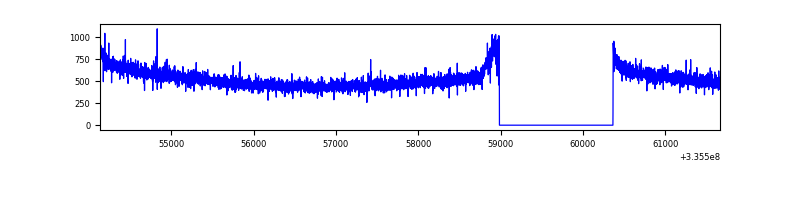 |
| B | 7528 | 6149 | 0 | 0 | 0.00% | 0.00% | 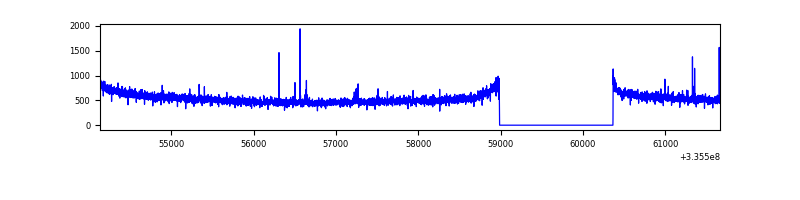 |
| C | 7528 | 6148 | 16 | 16 | 0.21% | 0.26% | 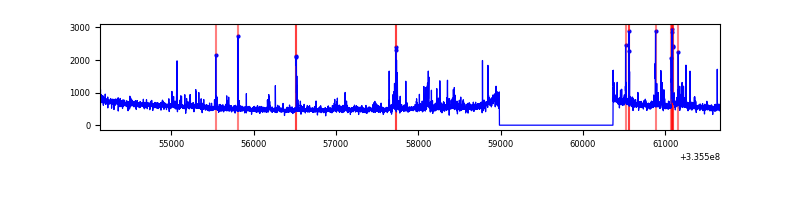 |
| D | 7527 | 6148 | 940 | 940 | 12.49% | 15.29% | 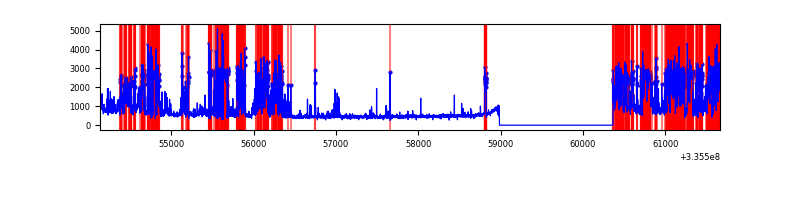 |
Top three noisy pixels from each quadrant. If the there are fewer than three noisy pixels in the level2.evt file, extra rows are filled as -1
| Pixel properties | Quadrant properties | ||||||
|---|---|---|---|---|---|---|---|
| Quadrant | DetID | PixID | Counts | Sigma | Mean | Median | Sigma |
| A | 12 | 189 | 14614 | 84.22 | 834 | 822 | 163.8 |
| A | 13 | 254 | 10488 | 59.02 | 834 | 822 | 163.8 |
| A | 0 | 226 | 7217 | 39.05 | 834 | 822 | 163.8 |
| B | 12 | 111 | 17541 | 111.18 | 833 | 817 | 150.4 |
| B | 11 | 111 | 15402 | 96.96 | 833 | 817 | 150.4 |
| B | 0 | 245 | 14775 | 92.79 | 833 | 817 | 150.4 |
| C | 2 | 16 | 193764 | 1023.6 | 818 | 827 | 188.5 |
| C | 14 | 238 | 132348 | 697.77 | 818 | 827 | 188.5 |
| C | 3 | 233 | 124658 | 656.97 | 818 | 827 | 188.5 |
| D | 1 | 52 | 1698796 | 9501.74 | 758 | 738 | 178.7 |
| D | 7 | 80 | 957308 | 5352.63 | 758 | 738 | 178.7 |
| D | 12 | 233 | 655777 | 3665.37 | 758 | 738 | 178.7 |
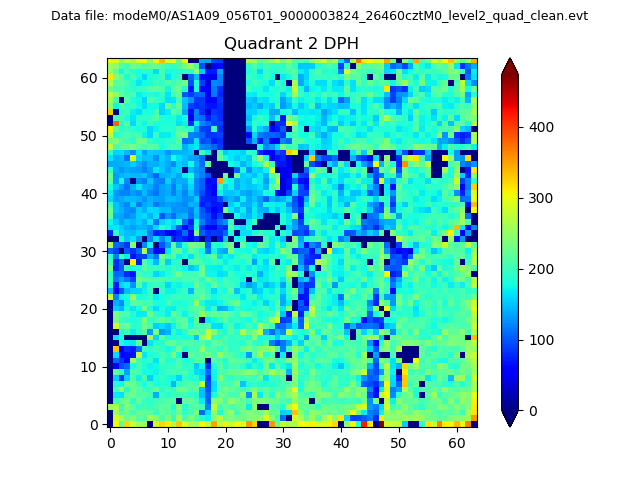
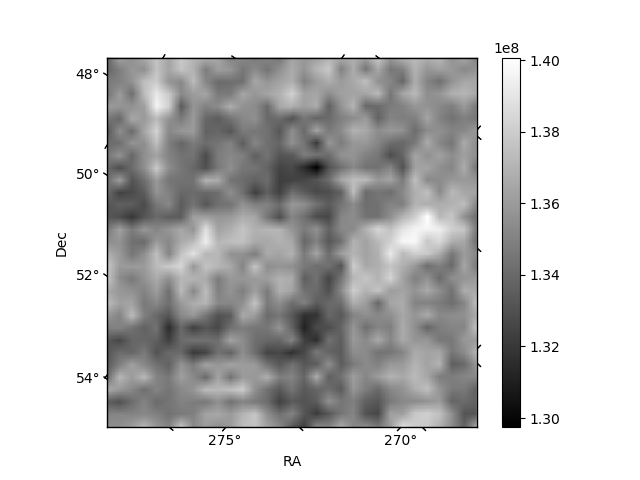
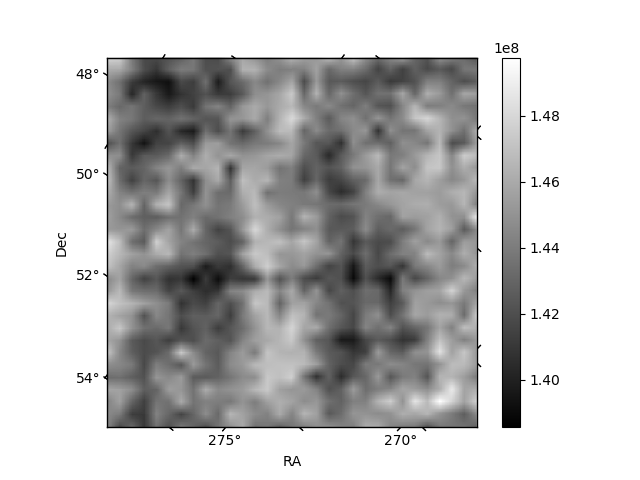
Histogram calculated using DETX and DETY for each event in the final _common_clean file
| Quadrant A | 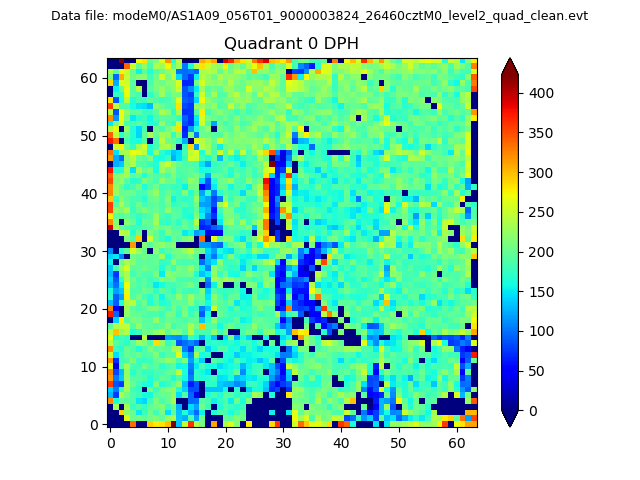 |
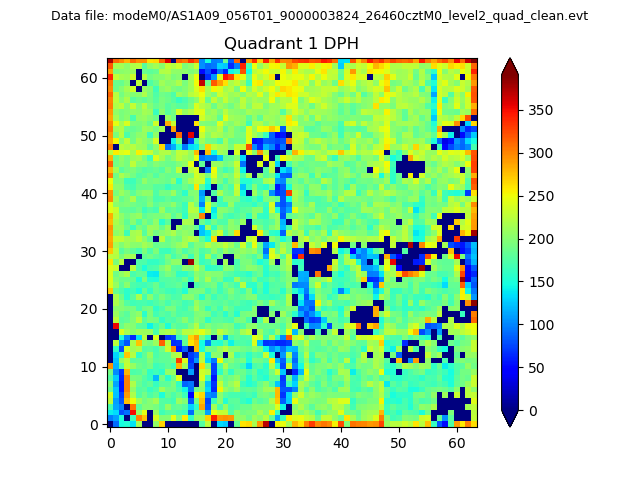 |
Quadrant B |
|---|---|---|---|
| Quadrant D | 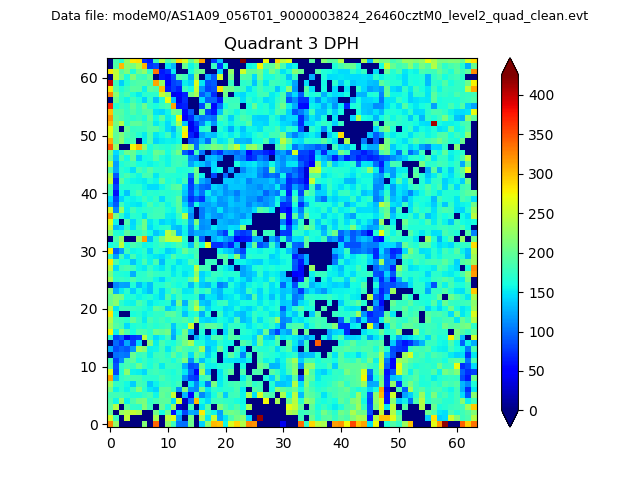 |
 |
Quadrant C |
| Plot type | Count rate plots | Images |
|---|---|---|
| Comparison with Poisson distribution Blue bars denote a histogram of data divided into 1 sec bins. Red curve is a Poisson curve with rate = median count rate of data. |
 |
 |
| Quadrant-wise count rates Data is divided into 100 sec bins |
 |
|
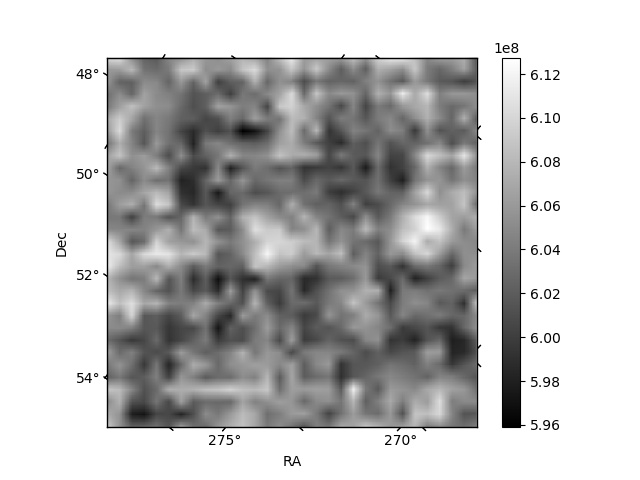
| Module-wise count rates for Quadrant A Data is divided into 100 sec bins |
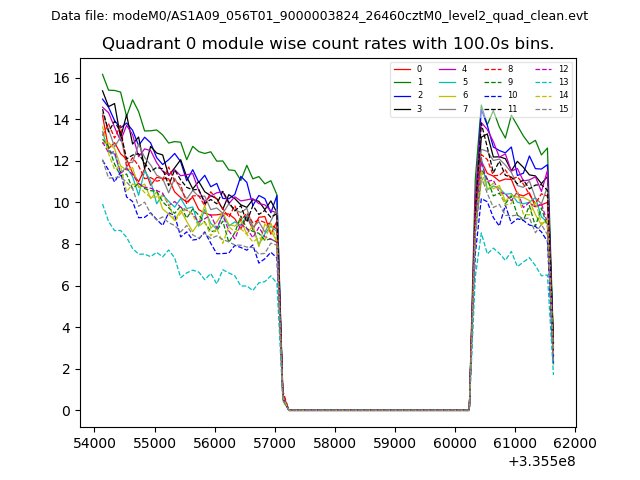 |
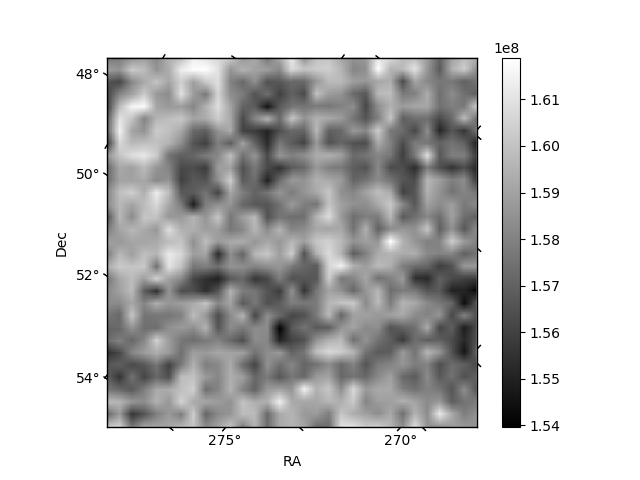 |
| Module-wise count rates for Quadrant B Data is divided into 100 sec bins |
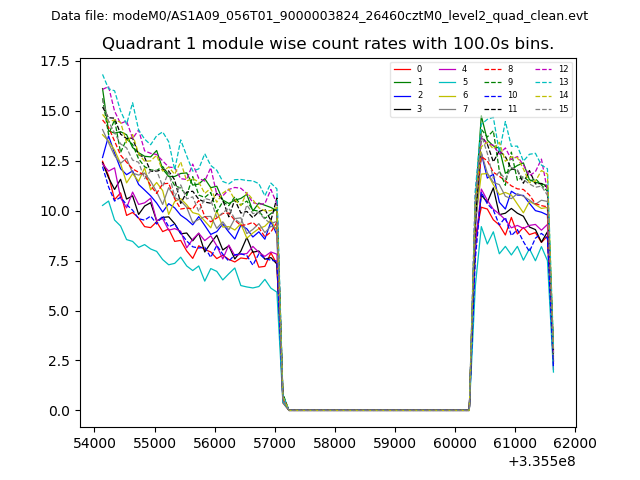 |
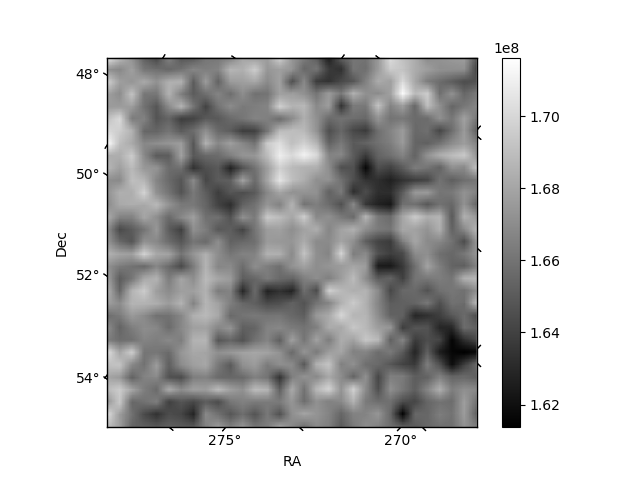 |
| Module-wise count rates for Quadrant C Data is divided into 100 sec bins |
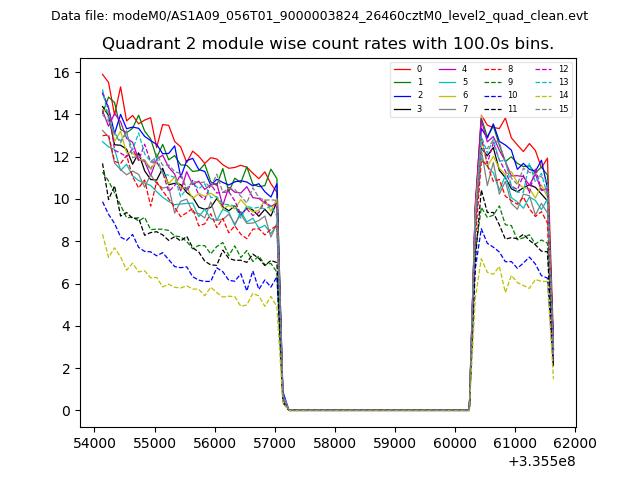 |
 |
| Module-wise count rates for Quadrant D Data is divided into 100 sec bins |
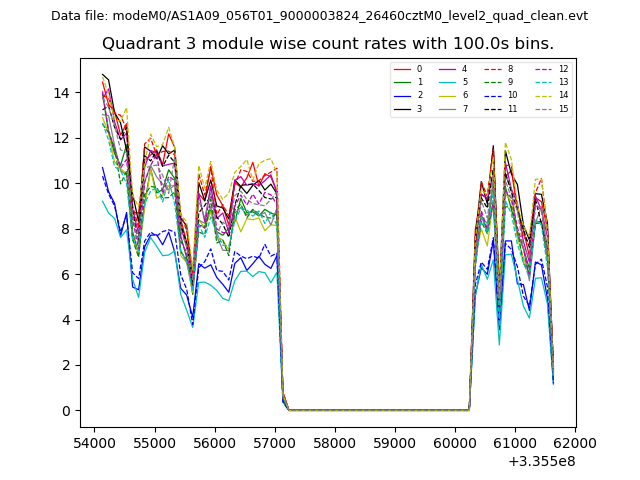 |
 |
| Parameter | Plot |
|---|---|
| CZT HV Monitor | 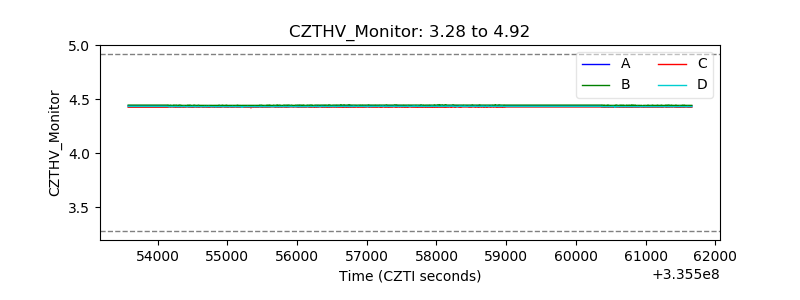 |
| D_VDD | 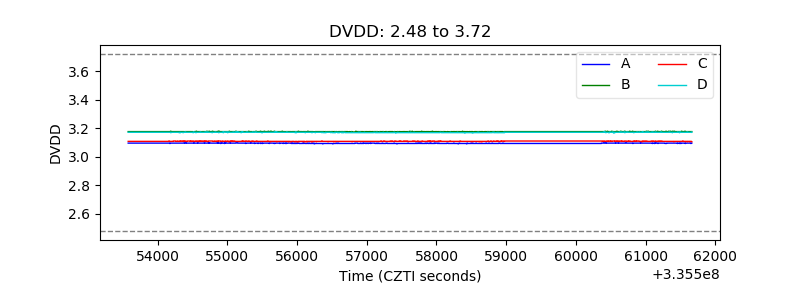 |
| Temperature 1 | 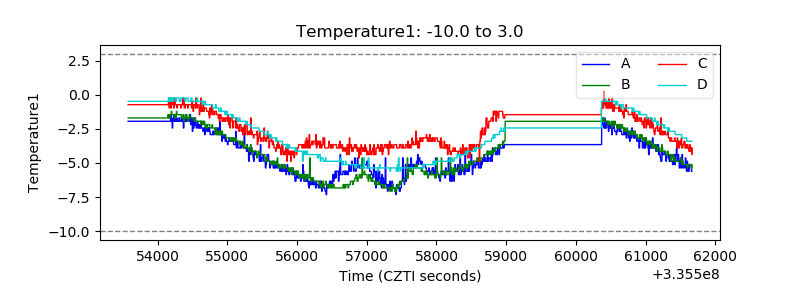 |
| Veto HV Monitor | 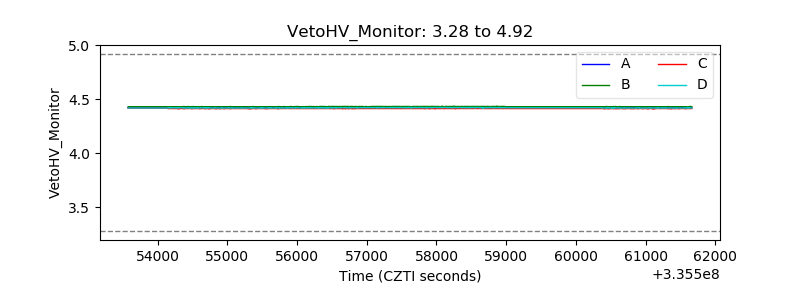 |
| Veto LLD | 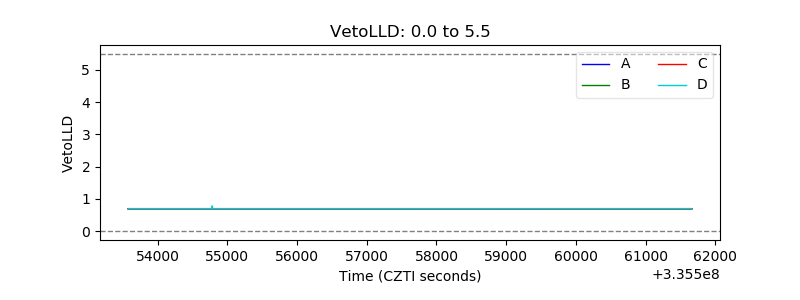 |
| Alpha Counter | 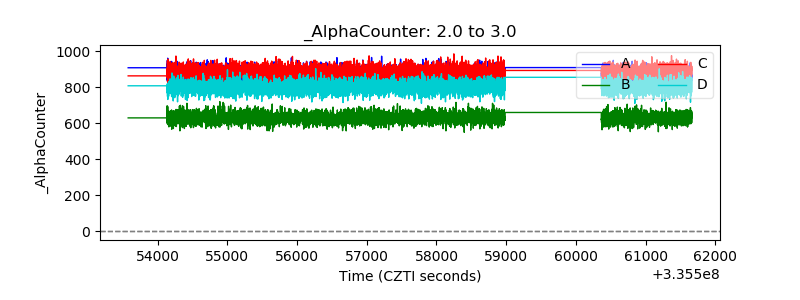 |
| _CPM_Rate |  |
| CZT Counter | 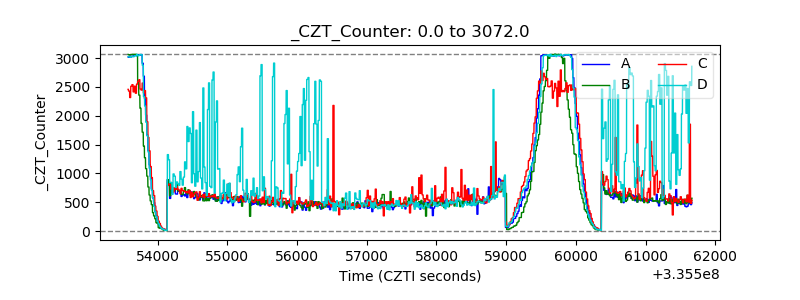 |
| +2.5 Volts monitor |  |
| +5 Volts monitor |  |
| _ROLL_ROT | 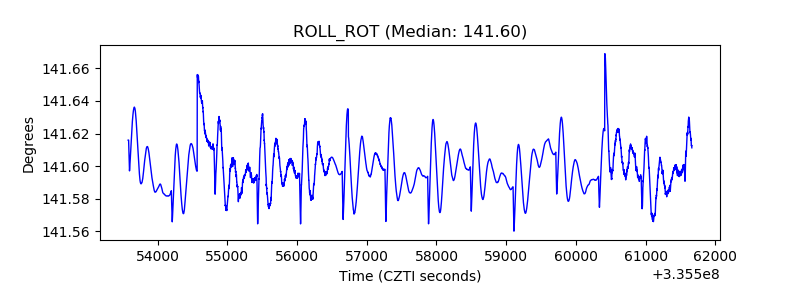 |
| _Roll_DEC | 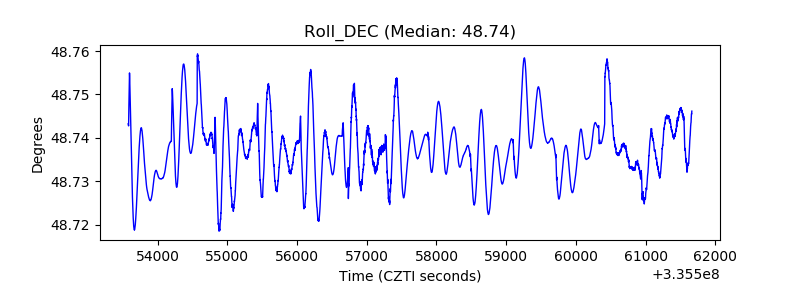 |
| _Roll_RA | 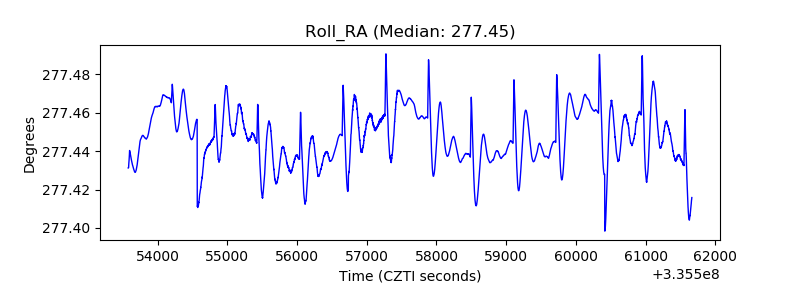 |
| Veto Counter | 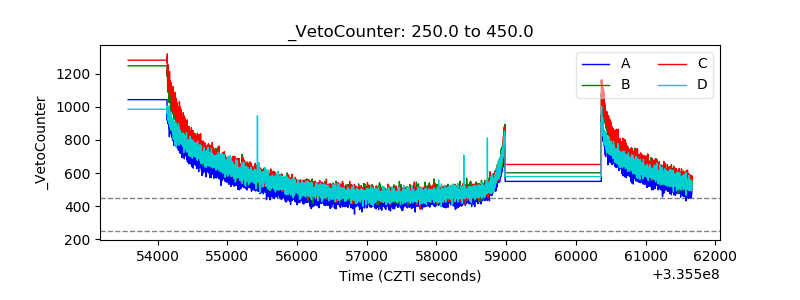 |