| Param | Original file | Final file |
|---|---|---|
| Filename | modeM0/AS1A09_056T01_9000003824_26461cztM0_level2.evt | modeM0/AS1A09_056T01_9000003824_26461cztM0_level2_quad_clean.evt |
| Size (bytes) | 242,827,200 | 52,369,920 |
| Size | 231.6 MB | 49.9 MB |
| Events in quadrant A | 1,182,188 | 373,207 |
| Events in quadrant B | 1,227,831 | 383,318 |
| Events in quadrant C | 1,393,719 | 365,141 |
| Events in quadrant D | 3,390,564 | 296,081 |
| Mode M9 | |||
|---|---|---|---|
| Quadrant | BADHDUFLAG | Total packets | Discarded packets |
| A | 0 | 7 | 0 |
| B | 0 | 8 | 0 |
| C | 0 | 8 | 0 |
| D | 0 | 8 | 0 |
| Mode M0 | |||
|---|---|---|---|
| Quadrant | BADHDUFLAG | Total packets | Discarded packets |
| A | 0 | 4985 | 0 |
| B | 0 | 5083 | 0 |
| C | 0 | 5679 | 0 |
| D | 0 | 11724 | 0 |
| Quadrant | Total seconds | Saturated seconds | Saturation percentage |
|---|---|---|---|
| A | 2321 | 3 | 0.129255% |
| B | 2321 | 6 | 0.258509% |
| C | 2321 | 44 | 1.895735% |
| D | 2321 | 752 | 32.399828% |
Noise dominated data is calculated using 1-second bins in cleaned event files. If a bin has >2000 counts, and if more than 50% of those come from <1% of pixels, then it is considered to be noise-dominated and hence unusable.
| Quadrant | # 1 sec bins | Bins with >0 counts | Bins with >2000 counts | High rate bins dominated by noise | Noise dominated (total time) | Noise dominated (detector-on time) | Marked lightcurve |
|---|---|---|---|---|---|---|---|
| A | 2321 | 2321 | 0 | 0 | 0.00% | 0.00% | 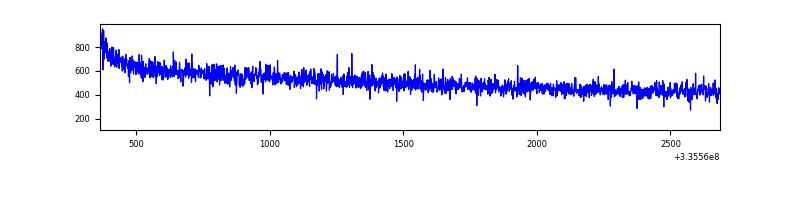 |
| B | 2321 | 2321 | 2 | 2 | 0.09% | 0.09% | 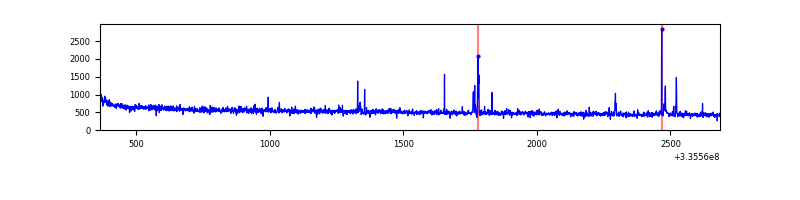 |
| C | 2321 | 2321 | 11 | 11 | 0.47% | 0.47% | 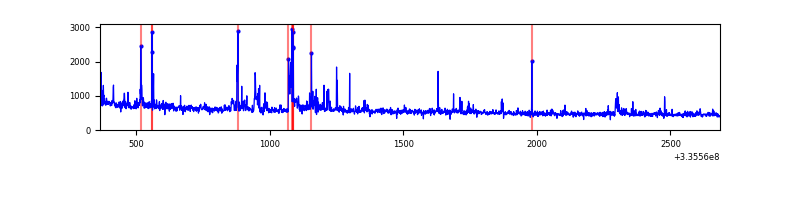 |
| D | 2321 | 2321 | 685 | 685 | 29.51% | 29.51% | 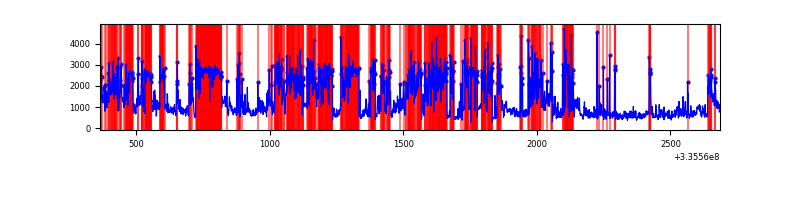 |
Top three noisy pixels from each quadrant. If the there are fewer than three noisy pixels in the level2.evt file, extra rows are filled as -1
| Pixel properties | Quadrant properties | ||||||
|---|---|---|---|---|---|---|---|
| Quadrant | DetID | PixID | Counts | Sigma | Mean | Median | Sigma |
| A | 13 | 254 | 3978 | 60.14 | 305 | 301 | 61.1 |
| A | 0 | 226 | 2575 | 37.19 | 305 | 301 | 61.1 |
| A | 3 | 137 | 2509 | 36.11 | 305 | 301 | 61.1 |
| B | 0 | 245 | 13039 | 224.76 | 306 | 300 | 56.7 |
| B | 0 | 244 | 9386 | 160.31 | 306 | 300 | 56.7 |
| B | 5 | 172 | 8053 | 136.79 | 306 | 300 | 56.7 |
| C | 2 | 16 | 94441 | 1324.68 | 302 | 305 | 71.1 |
| C | 3 | 233 | 67690 | 948.24 | 302 | 305 | 71.1 |
| C | 14 | 238 | 48445 | 677.43 | 302 | 305 | 71.1 |
| D | 1 | 52 | 1476405 | 23774.62 | 259 | 253 | 62.1 |
| D | 7 | 80 | 460684 | 7415.61 | 259 | 253 | 62.1 |
| D | 12 | 233 | 453143 | 7294.16 | 259 | 253 | 62.1 |
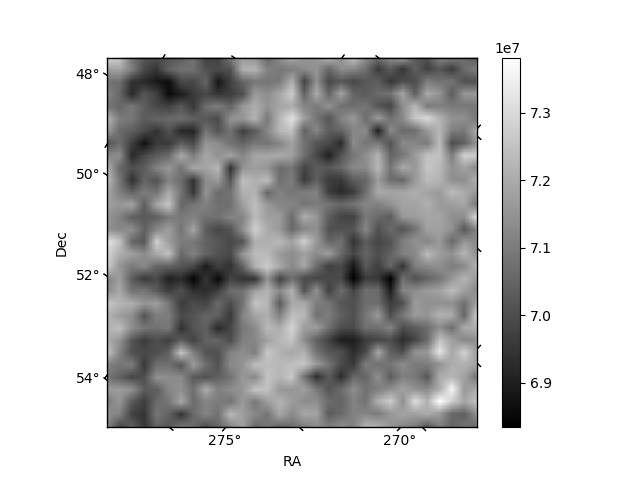
Histogram calculated using DETX and DETY for each event in the final _common_clean file
| Quadrant A | 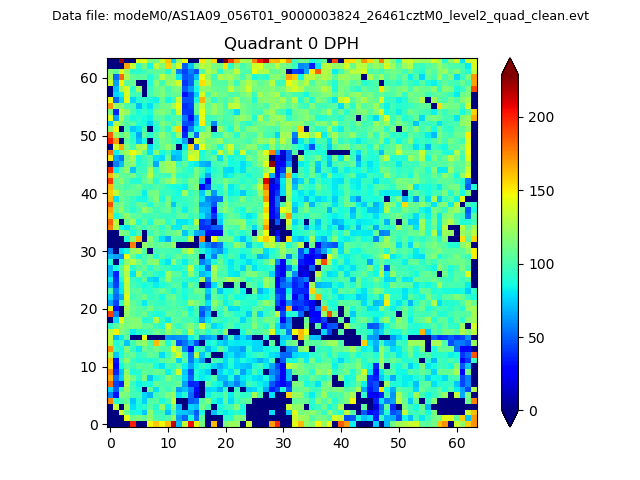 |
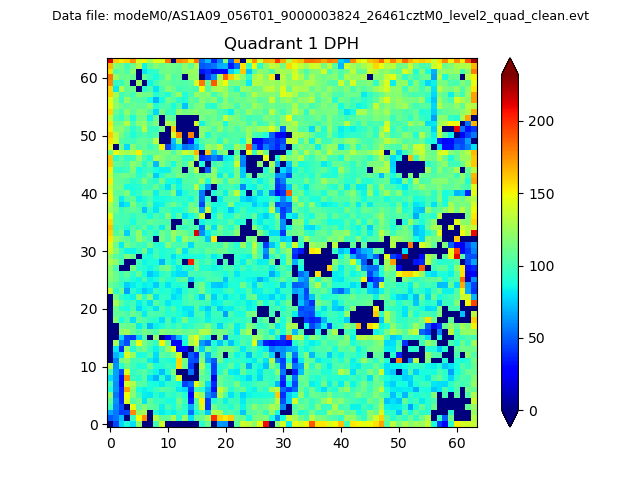 |
Quadrant B |
|---|---|---|---|
| Quadrant D |  |
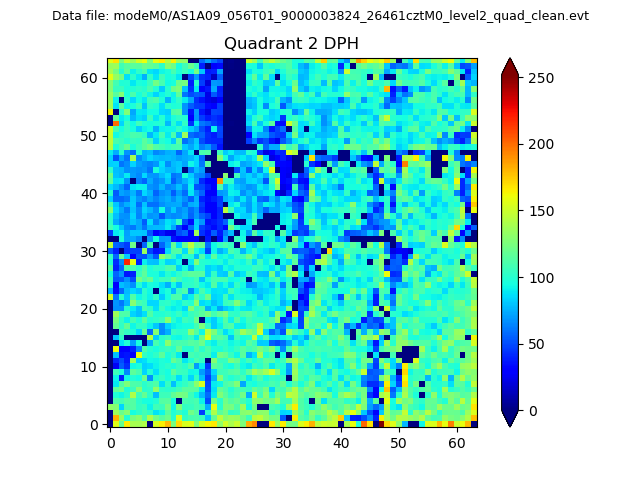 |
Quadrant C |
| Plot type | Count rate plots | Images |
|---|---|---|
| Comparison with Poisson distribution Blue bars denote a histogram of data divided into 1 sec bins. Red curve is a Poisson curve with rate = median count rate of data. |
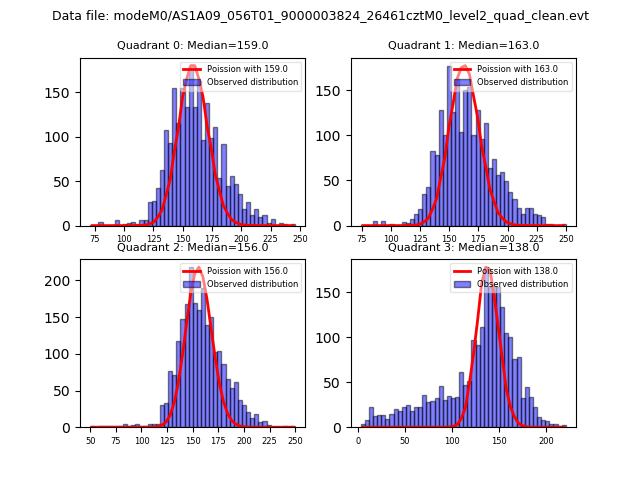 |
 |
| Quadrant-wise count rates Data is divided into 100 sec bins |
 |
|
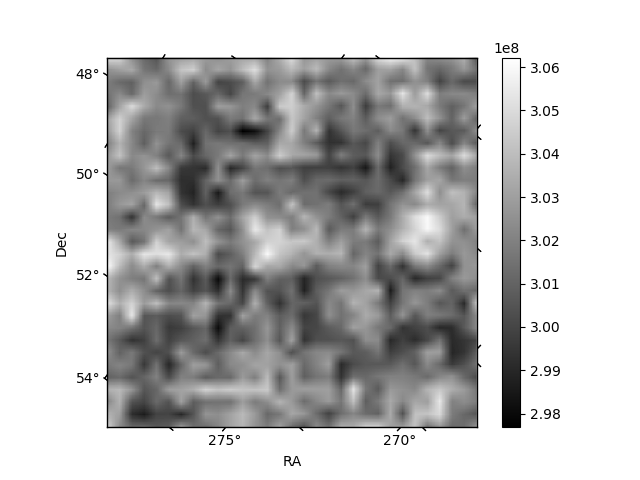
| Module-wise count rates for Quadrant A Data is divided into 100 sec bins |
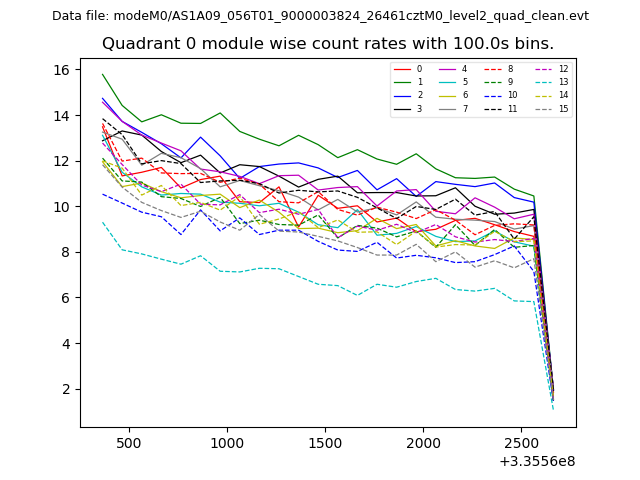 |
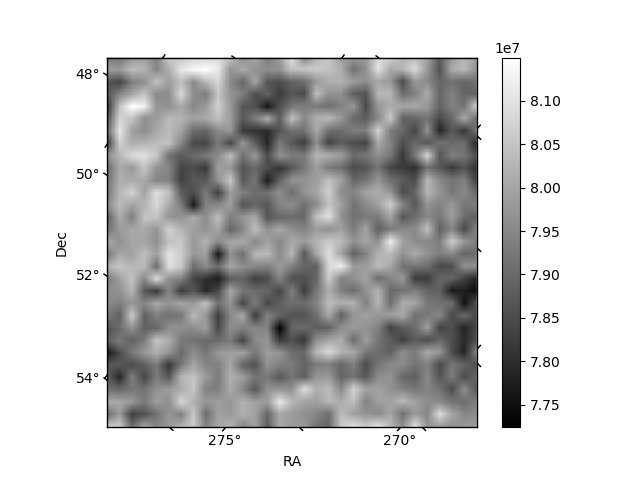 |
| Module-wise count rates for Quadrant B Data is divided into 100 sec bins |
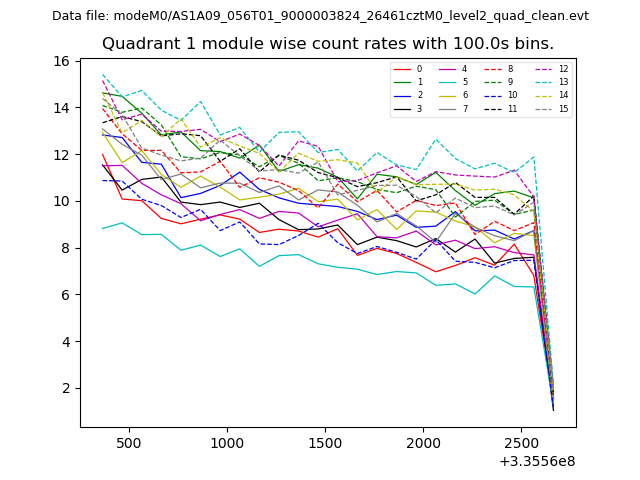 |
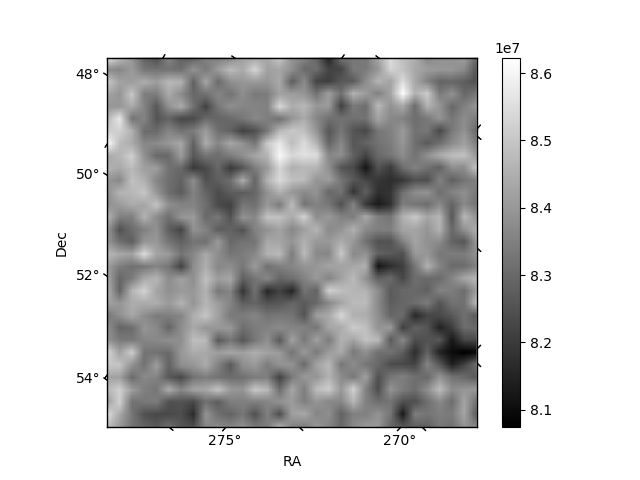 |
| Module-wise count rates for Quadrant C Data is divided into 100 sec bins |
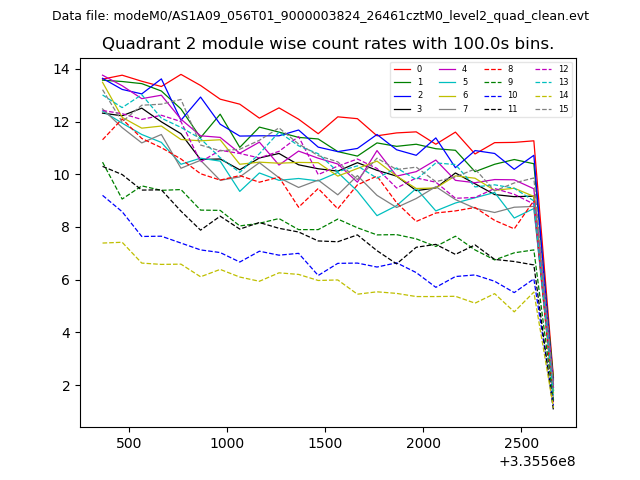 |
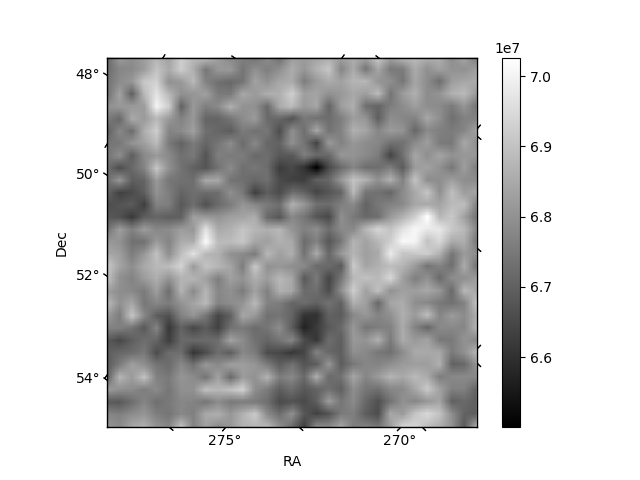 |
| Module-wise count rates for Quadrant D Data is divided into 100 sec bins |
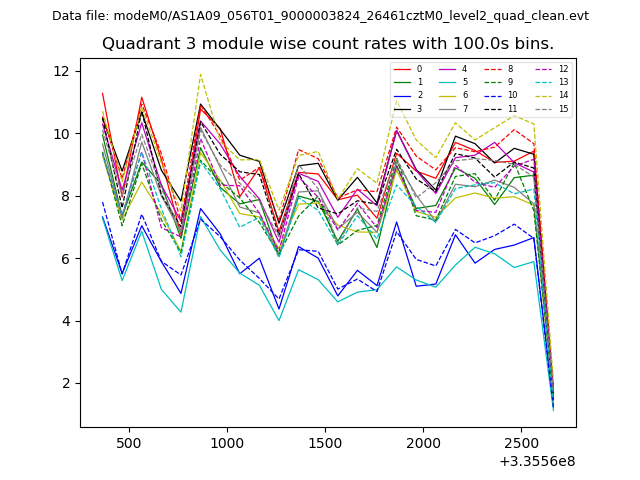 |
 |
| Parameter | Plot |
|---|---|
| CZT HV Monitor | 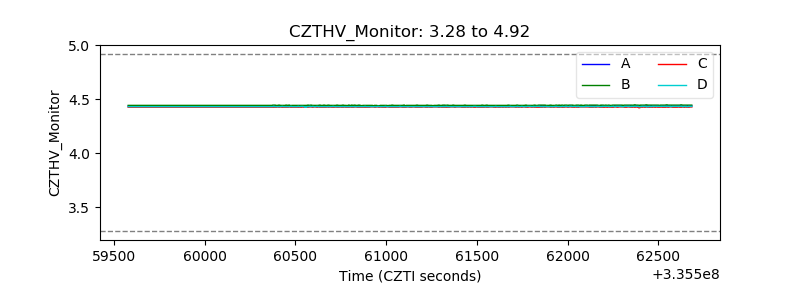 |
| D_VDD | 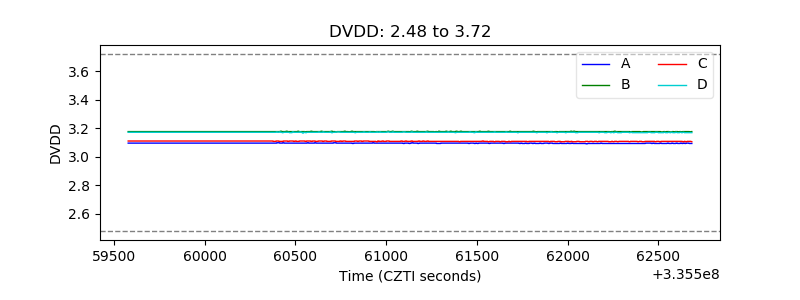 |
| Temperature 1 | 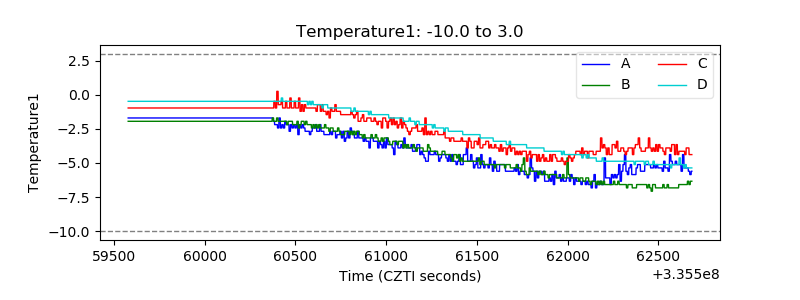 |
| Veto HV Monitor | 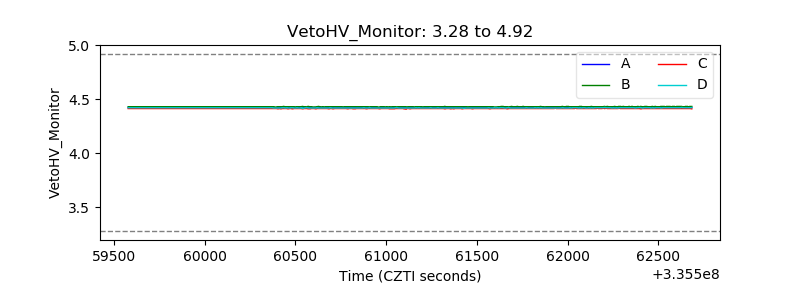 |
| Veto LLD | 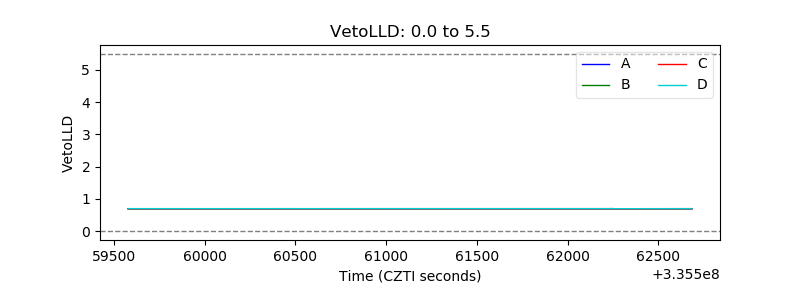 |
| Alpha Counter | 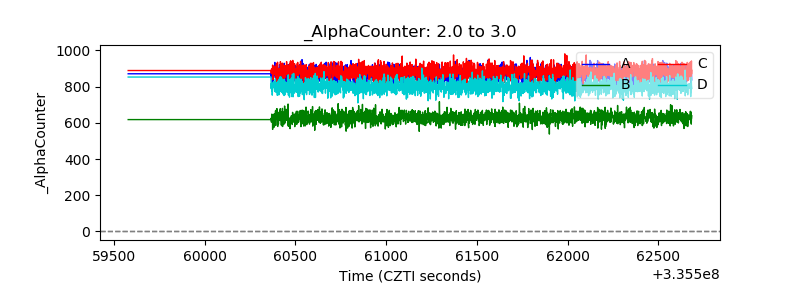 |
| _CPM_Rate |  |
| CZT Counter | 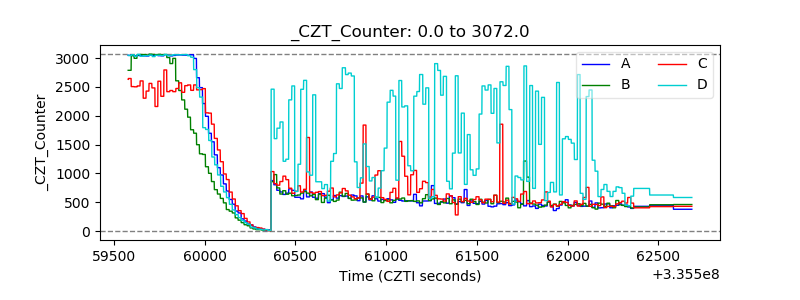 |
| +2.5 Volts monitor | 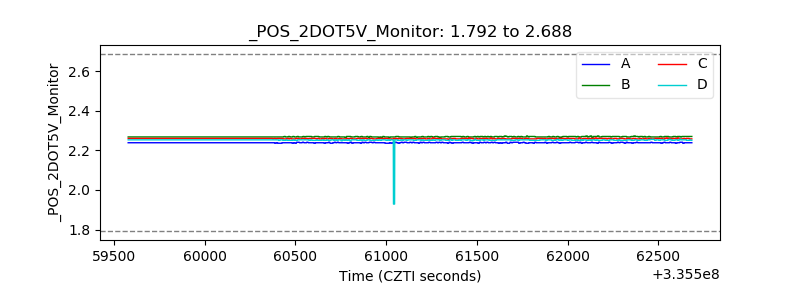 |
| +5 Volts monitor |  |
| _ROLL_ROT | 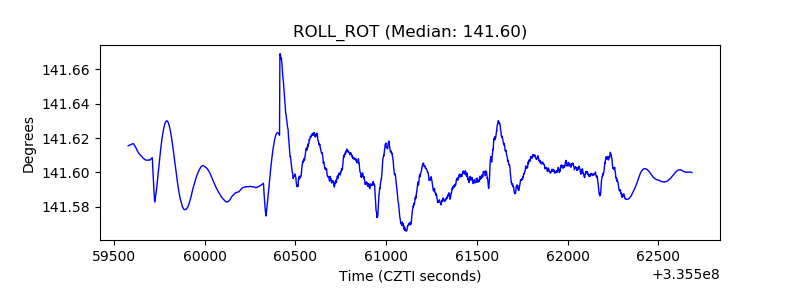 |
| _Roll_DEC | 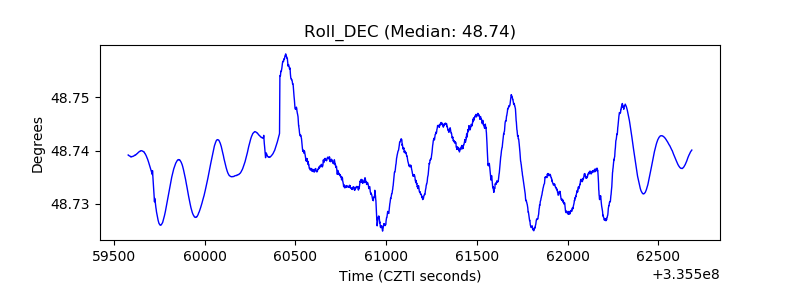 |
| _Roll_RA | 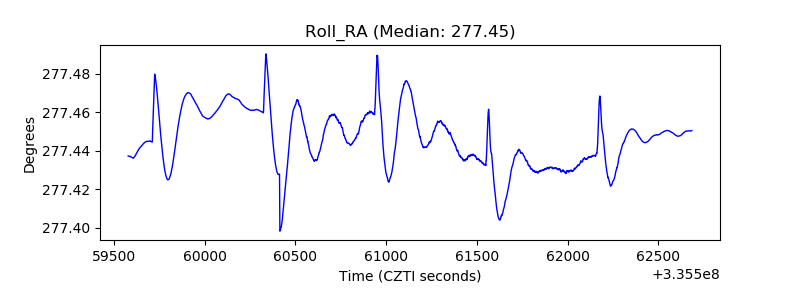 |
| Veto Counter | 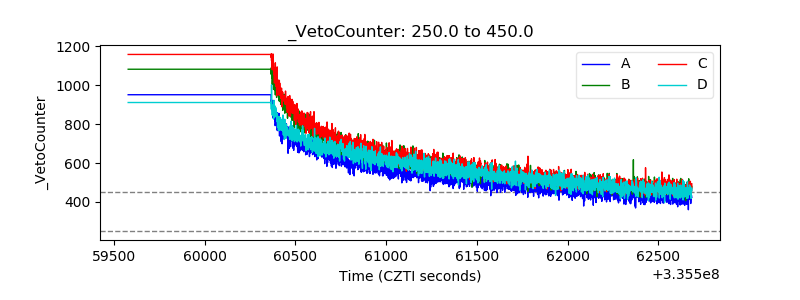 |