| Param | Original file | Final file |
|---|---|---|
| Filename | modeM0/AS1A09_056T01_9000003824_26627cztM0_level2.evt | modeM0/AS1A09_056T01_9000003824_26627cztM0_level2_quad_clean.evt |
| Size (bytes) | 288,138,240 | 51,168,960 |
| Size | 274.8 MB | 48.8 MB |
| Events in quadrant A | 1,868,132 | 340,177 |
| Events in quadrant B | 2,066,565 | 324,389 |
| Events in quadrant C | 1,831,511 | 331,719 |
| Events in quadrant D | 2,698,448 | 283,272 |
| Mode M9 | |||
|---|---|---|---|
| Quadrant | BADHDUFLAG | Total packets | Discarded packets |
| A | 0 | 10 | 8 |
| B | 0 | 10 | 7 |
| C | 0 | 11 | 11 |
| D | 0 | 11 | 7 |
| Mode M0 | |||
|---|---|---|---|
| Quadrant | BADHDUFLAG | Total packets | Discarded packets |
| A | 0 | 7920 | 0 |
| B | 0 | 8347 | 0 |
| C | 0 | 7709 | 0 |
| D | 0 | 10246 | 0 |
| Quadrant | Total seconds | Saturated seconds | Saturation percentage |
|---|---|---|---|
| A | 3732 | 31 | 0.830654% |
| B | 3504 | 23 | 0.656393% |
| C | 3739 | 17 | 0.454667% |
| D | 3378 | 287 | 8.496152% |
Noise dominated data is calculated using 1-second bins in cleaned event files. If a bin has >2000 counts, and if more than 50% of those come from <1% of pixels, then it is considered to be noise-dominated and hence unusable.
| Quadrant | # 1 sec bins | Bins with >0 counts | Bins with >2000 counts | High rate bins dominated by noise | Noise dominated (total time) | Noise dominated (detector-on time) | Marked lightcurve |
|---|---|---|---|---|---|---|---|
| A | 7732 | 4523 | 18 | 18 | 0.23% | 0.40% | 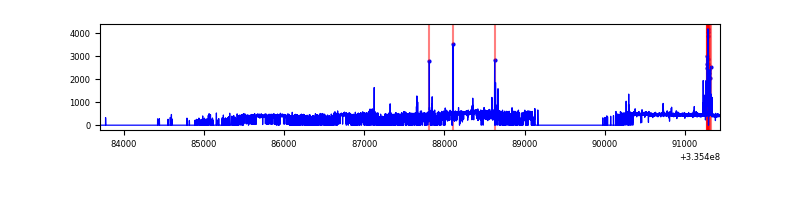 |
| B | 7662 | 4251 | 6 | 6 | 0.08% | 0.14% | 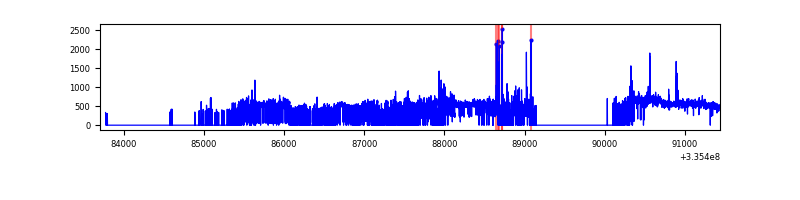 |
| C | 7728 | 4518 | 0 | 0 | 0.00% | 0.00% | 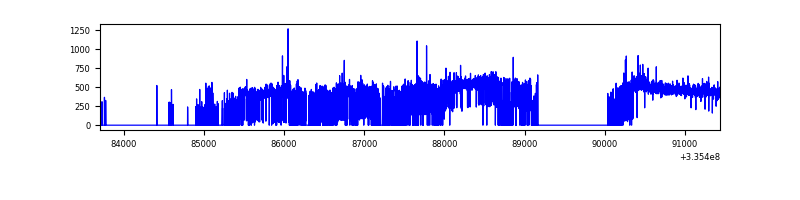 |
| D | 7007 | 4140 | 193 | 193 | 2.75% | 4.66% | 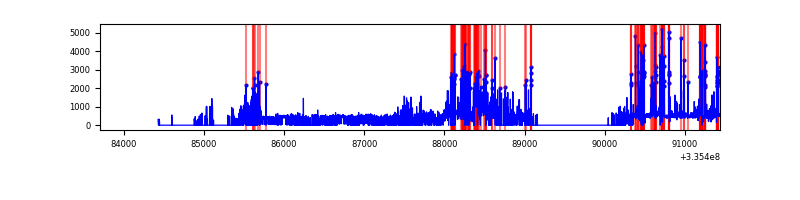 |
Top three noisy pixels from each quadrant. If the there are fewer than three noisy pixels in the level2.evt file, extra rows are filled as -1
| Pixel properties | Quadrant properties | ||||||
|---|---|---|---|---|---|---|---|
| Quadrant | DetID | PixID | Counts | Sigma | Mean | Median | Sigma |
| A | 0 | 13 | 116748 | 1269.57 | 452 | 445 | 91.6 |
| A | 13 | 254 | 5569 | 55.93 | 452 | 445 | 91.6 |
| A | 5 | 168 | 4203 | 41.02 | 452 | 445 | 91.6 |
| B | 0 | 189 | 335985 | 4074.46 | 422 | 412 | 82.4 |
| B | 10 | 245 | 70467 | 850.59 | 422 | 412 | 82.4 |
| B | 12 | 111 | 9497 | 110.31 | 422 | 412 | 82.4 |
| C | 14 | 238 | 71436 | 694.1 | 435 | 439 | 102.3 |
| C | 3 | 233 | 38253 | 369.69 | 435 | 439 | 102.3 |
| C | 15 | 208 | 11471 | 107.85 | 435 | 439 | 102.3 |
| D | 1 | 52 | 756267 | 8127.1 | 376 | 366 | 93.0 |
| D | 7 | 80 | 408492 | 4387.98 | 376 | 366 | 93.0 |
| D | 12 | 16 | 63976 | 683.91 | 376 | 366 | 93.0 |
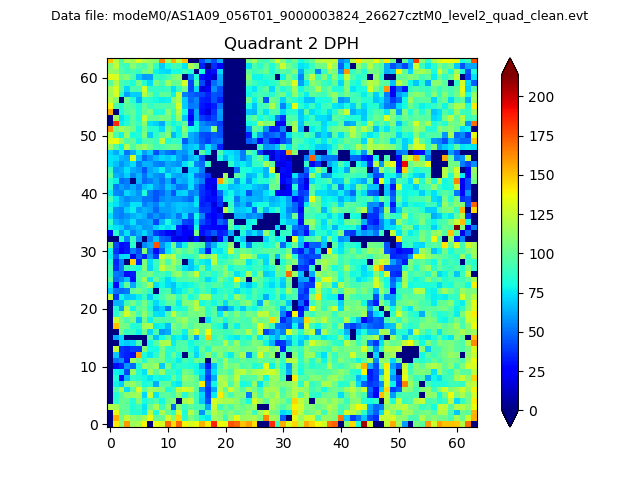
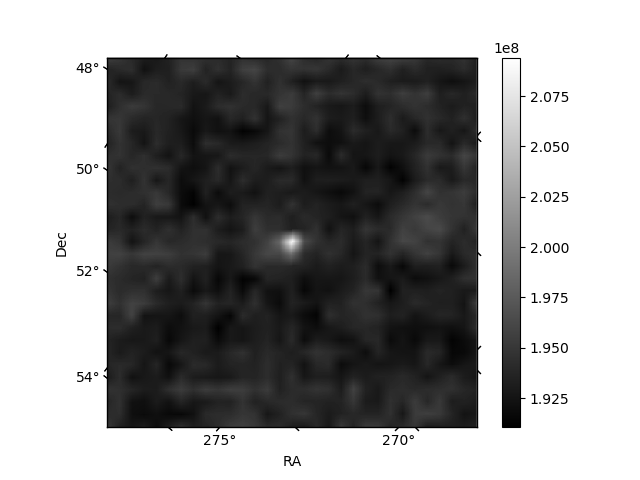
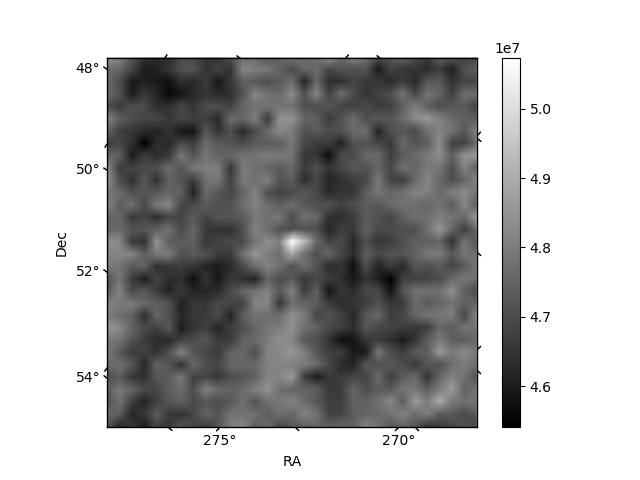
Histogram calculated using DETX and DETY for each event in the final _common_clean file
| Quadrant A | 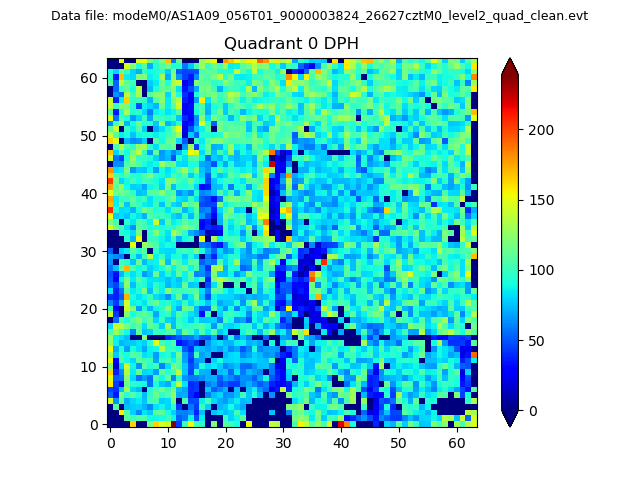 |
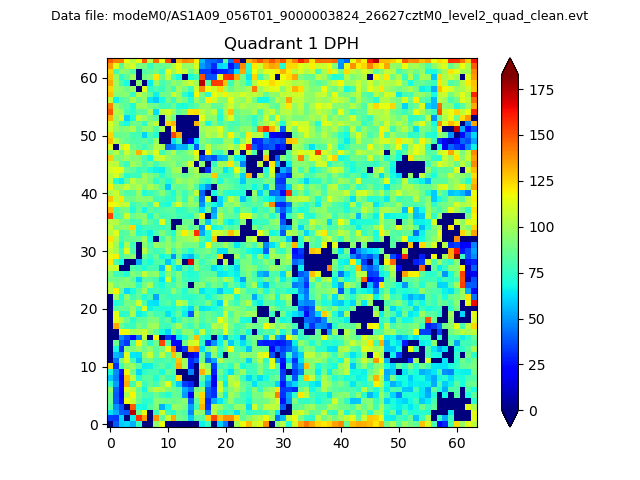 |
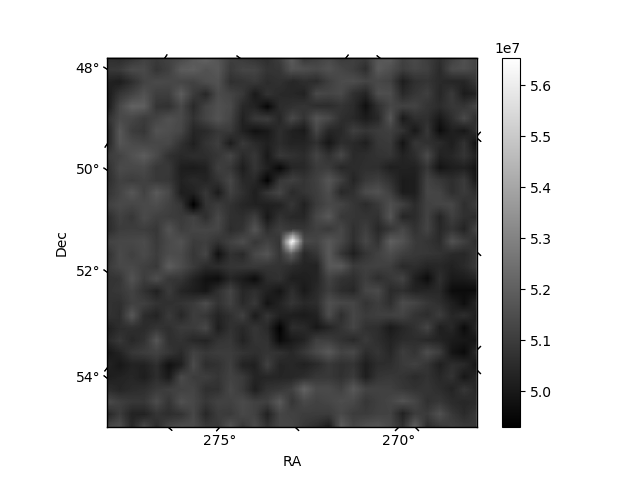
Quadrant B |
|---|---|---|---|
| Quadrant D | 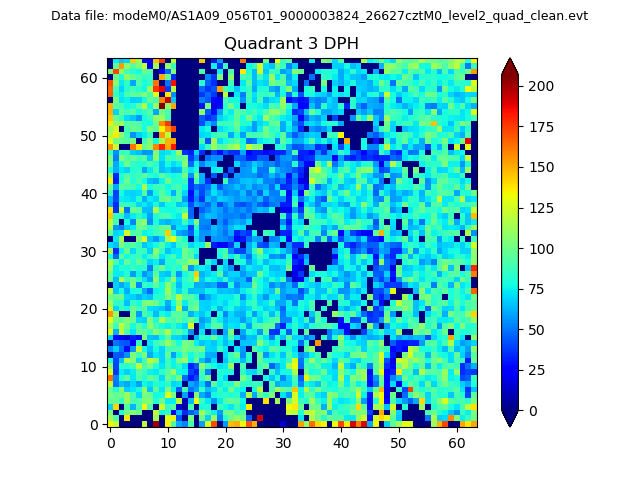 |
 |
Quadrant C |
| Plot type | Count rate plots | Images |
|---|---|---|
| Comparison with Poisson distribution Blue bars denote a histogram of data divided into 1 sec bins. Red curve is a Poisson curve with rate = median count rate of data. |
 |
 |
| Quadrant-wise count rates Data is divided into 100 sec bins |
 |
|
| Module-wise count rates for Quadrant A Data is divided into 100 sec bins |
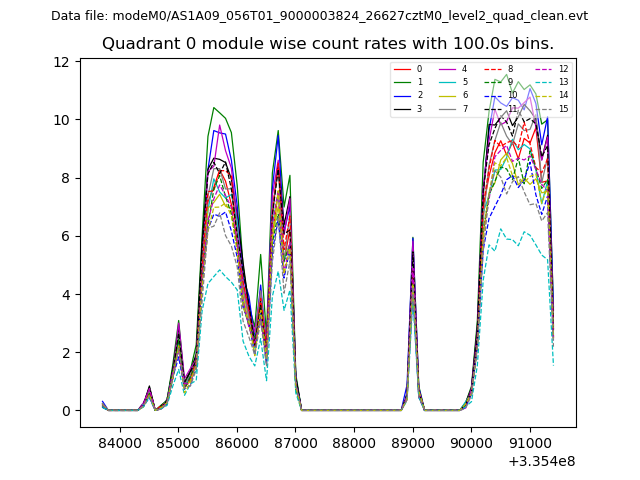 |
 |
| Module-wise count rates for Quadrant B Data is divided into 100 sec bins |
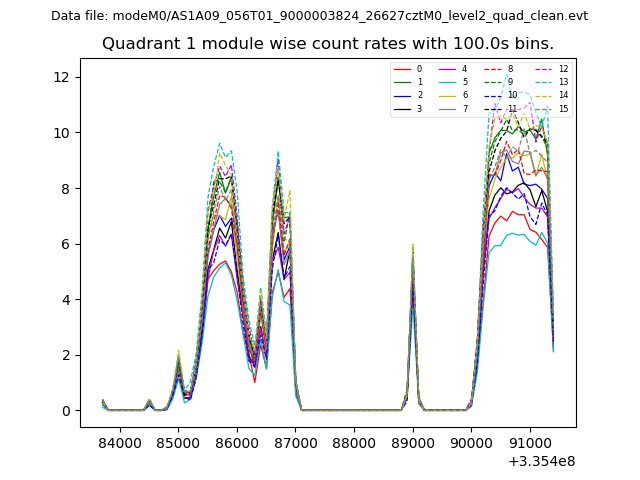 |
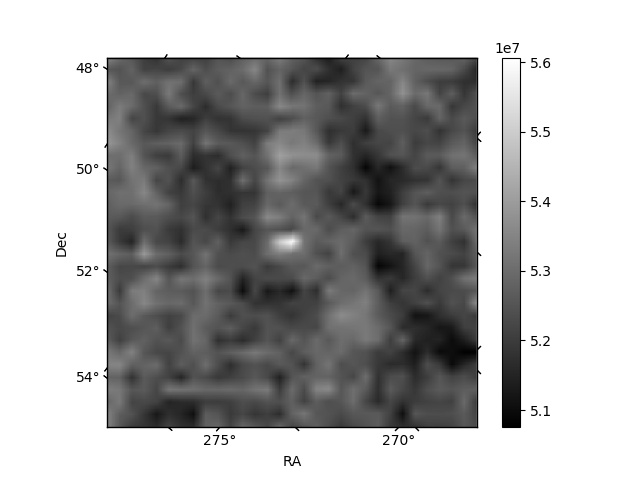 |
| Module-wise count rates for Quadrant C Data is divided into 100 sec bins |
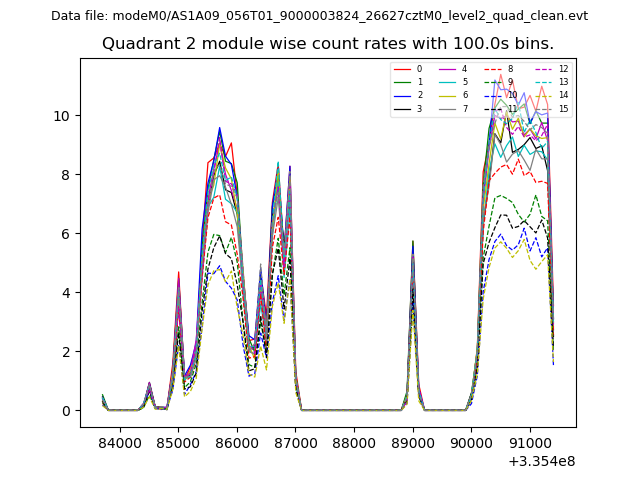 |
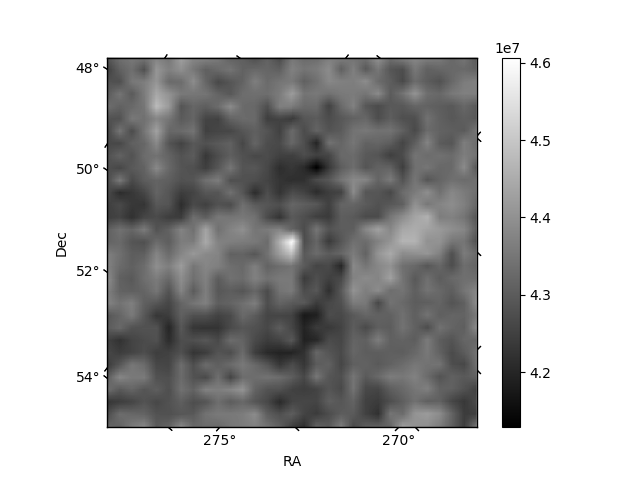 |
| Module-wise count rates for Quadrant D Data is divided into 100 sec bins |
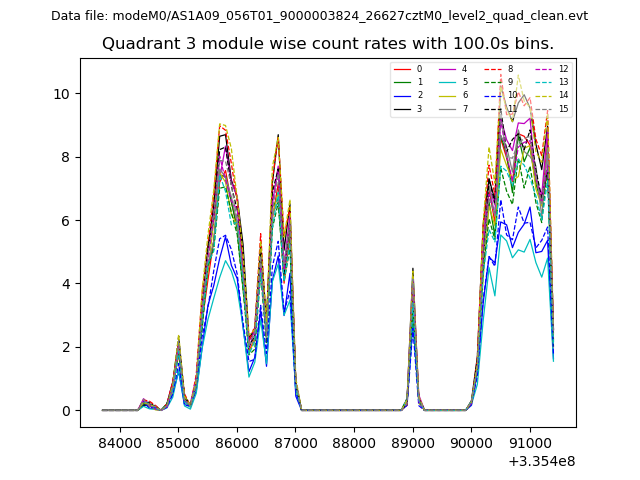 |
 |
| Parameter | Plot |
|---|---|
| CZT HV Monitor | 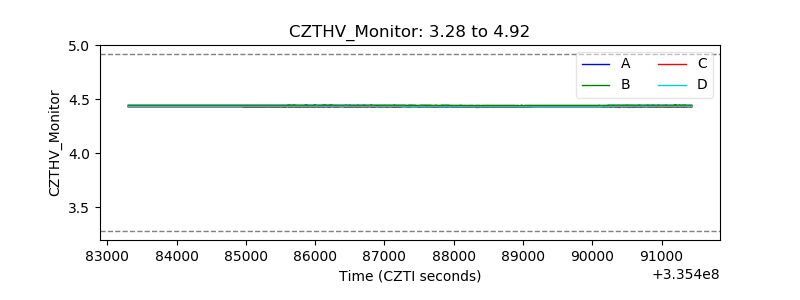 |
| D_VDD | 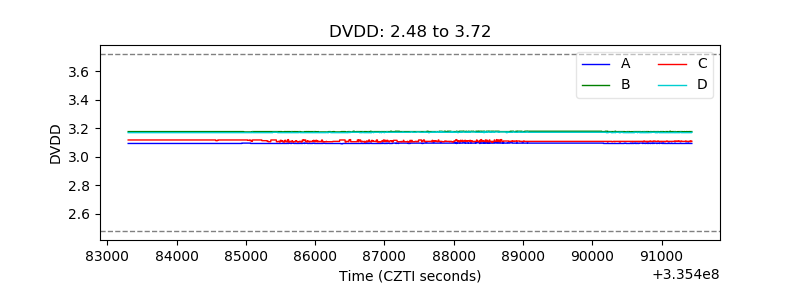 |
| Temperature 1 | 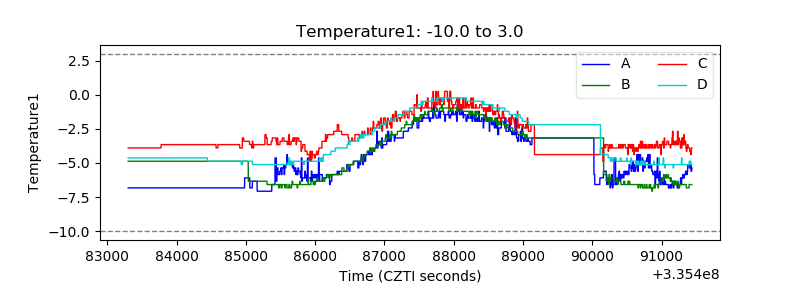 |
| Veto HV Monitor | 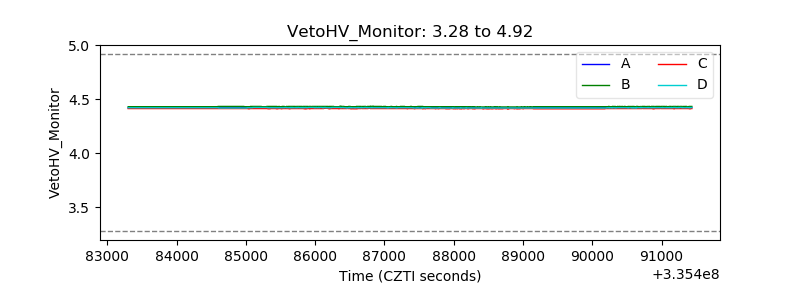 |
| Veto LLD | 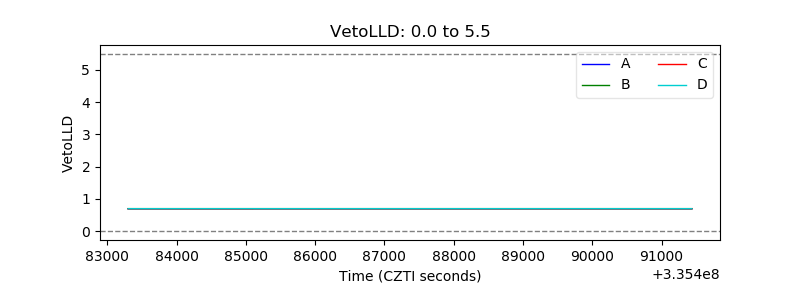 |
| Alpha Counter | 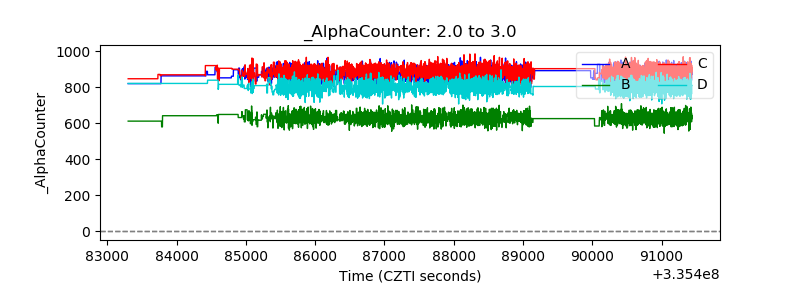 |
| _CPM_Rate | 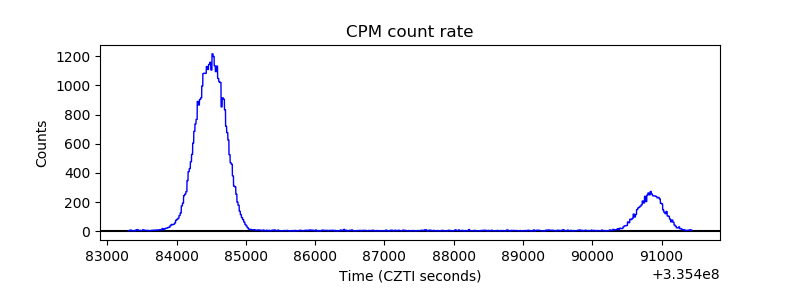 |
| CZT Counter | 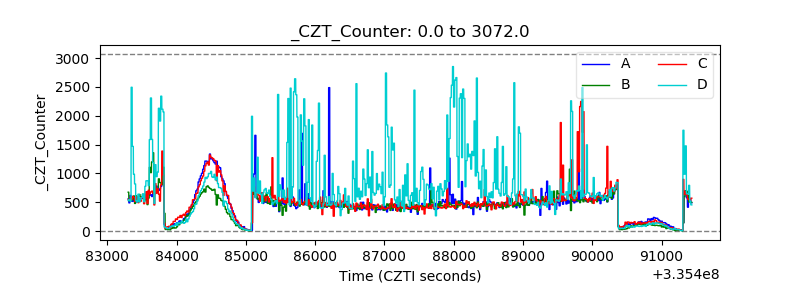 |
| +2.5 Volts monitor |  |
| +5 Volts monitor |  |
| _ROLL_ROT | 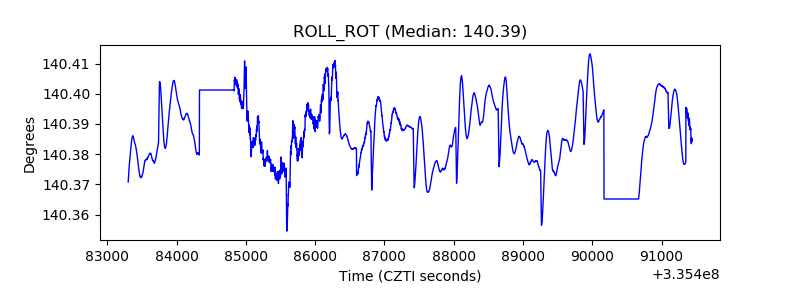 |
| _Roll_DEC | 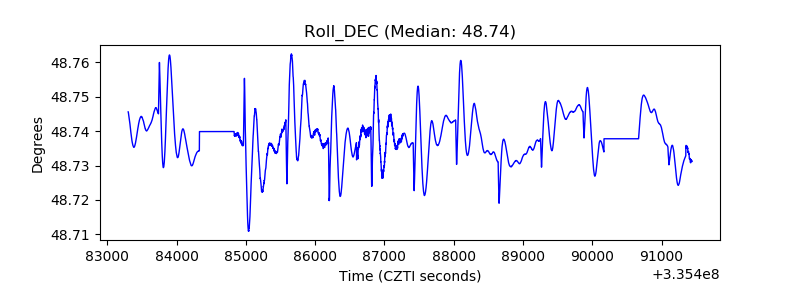 |
| _Roll_RA | 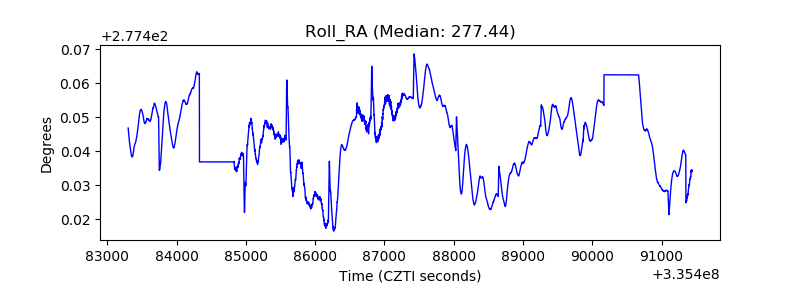 |
| Veto Counter | 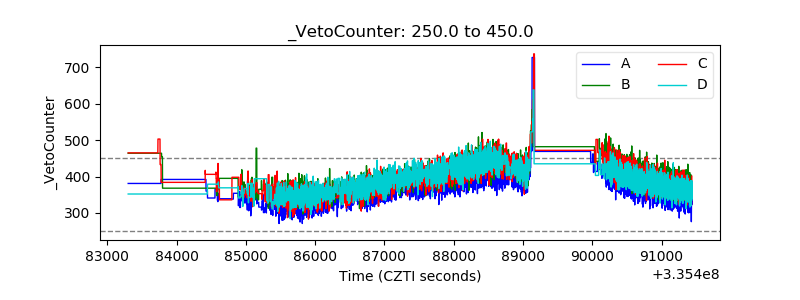 |