| Param | Original file | Final file |
|---|---|---|
| Filename | modeM0/AS1A09_056T01_9000003824_26628cztM0_level2.evt | modeM0/AS1A09_056T01_9000003824_26628cztM0_level2_quad_clean.evt |
| Size (bytes) | 193,723,200 | 45,181,440 |
| Size | 184.7 MB | 43.1 MB |
| Events in quadrant A | 1,182,671 | 308,954 |
| Events in quadrant B | 1,498,310 | 310,251 |
| Events in quadrant C | 1,285,352 | 297,109 |
| Events in quadrant D | 1,740,202 | 283,723 |
| Mode M9 | |||
|---|---|---|---|
| Quadrant | BADHDUFLAG | Total packets | Discarded packets |
| A | 0 | 8 | 0 |
| B | 0 | 8 | 1 |
| C | 0 | 8 | 1 |
| D | 0 | 9 | 1 |
| Mode M0 | |||
|---|---|---|---|
| Quadrant | BADHDUFLAG | Total packets | Discarded packets |
| A | 0 | 4887 | 0 |
| B | 0 | 6009 | 0 |
| C | 0 | 5198 | 0 |
| D | 0 | 6672 | 0 |
| Quadrant | Total seconds | Saturated seconds | Saturation percentage |
|---|---|---|---|
| A | 2303 | 42 | 1.823708% |
| B | 2287 | 82 | 3.585483% |
| C | 2300 | 81 | 3.521739% |
| D | 2238 | 214 | 9.562109% |
Noise dominated data is calculated using 1-second bins in cleaned event files. If a bin has >2000 counts, and if more than 50% of those come from <1% of pixels, then it is considered to be noise-dominated and hence unusable.
| Quadrant | # 1 sec bins | Bins with >0 counts | Bins with >2000 counts | High rate bins dominated by noise | Noise dominated (total time) | Noise dominated (detector-on time) | Marked lightcurve |
|---|---|---|---|---|---|---|---|
| A | 3261 | 2354 | 0 | 0 | 0.00% | 0.00% | 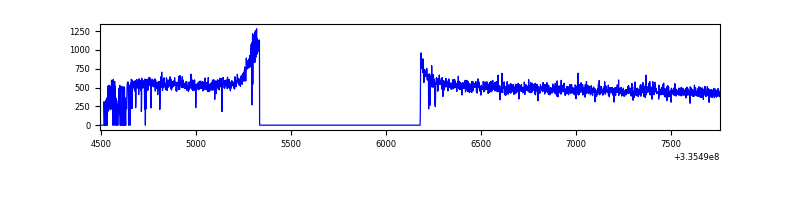 |
| B | 3222 | 2335 | 10 | 10 | 0.31% | 0.43% | 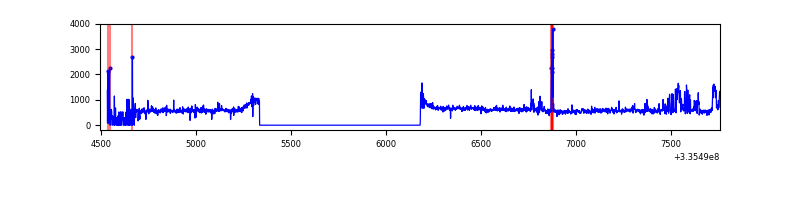 |
| C | 3253 | 2359 | 0 | 0 | 0.00% | 0.00% | 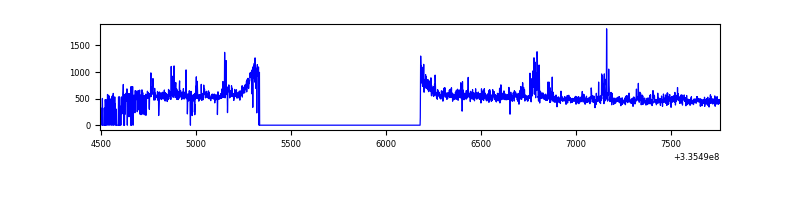 |
| D | 3235 | 2307 | 116 | 116 | 3.59% | 5.03% | 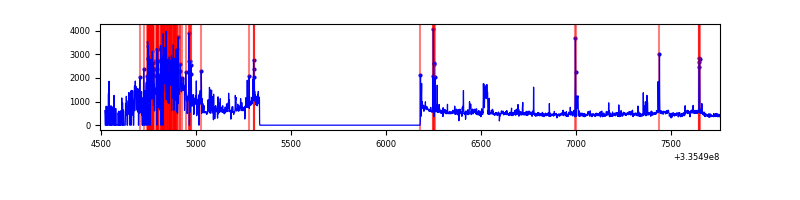 |
Top three noisy pixels from each quadrant. If the there are fewer than three noisy pixels in the level2.evt file, extra rows are filled as -1
| Pixel properties | Quadrant properties | ||||||
|---|---|---|---|---|---|---|---|
| Quadrant | DetID | PixID | Counts | Sigma | Mean | Median | Sigma |
| A | 0 | 13 | 6675 | 99.21 | 304 | 297 | 64.3 |
| A | 13 | 254 | 4014 | 57.82 | 304 | 297 | 64.3 |
| A | 3 | 137 | 2784 | 38.69 | 304 | 297 | 64.3 |
| B | 0 | 189 | 249669 | 4128.07 | 304 | 297 | 60.4 |
| B | 10 | 245 | 52383 | 862.22 | 304 | 297 | 60.4 |
| B | 12 | 111 | 7097 | 112.57 | 304 | 297 | 60.4 |
| C | 3 | 233 | 89095 | 1257.46 | 293 | 295 | 70.6 |
| C | 14 | 238 | 47089 | 662.63 | 293 | 295 | 70.6 |
| C | 1 | 0 | 5748 | 77.22 | 293 | 295 | 70.6 |
| D | 1 | 52 | 467926 | 6755.17 | 275 | 267 | 69.2 |
| D | 7 | 80 | 198536 | 2863.93 | 275 | 267 | 69.2 |
| D | 2 | 250 | 16516 | 234.71 | 275 | 267 | 69.2 |
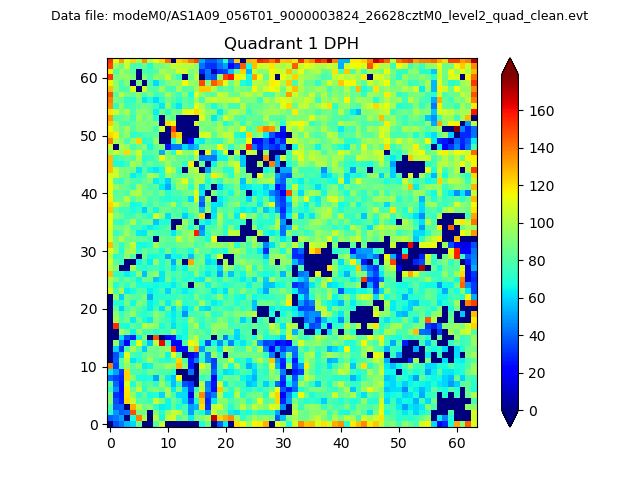
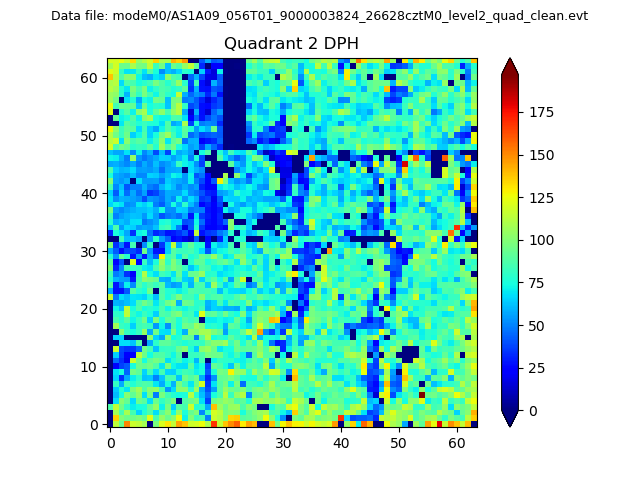
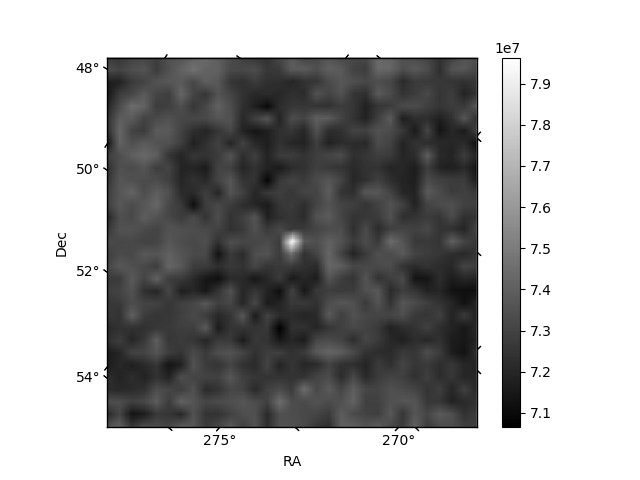
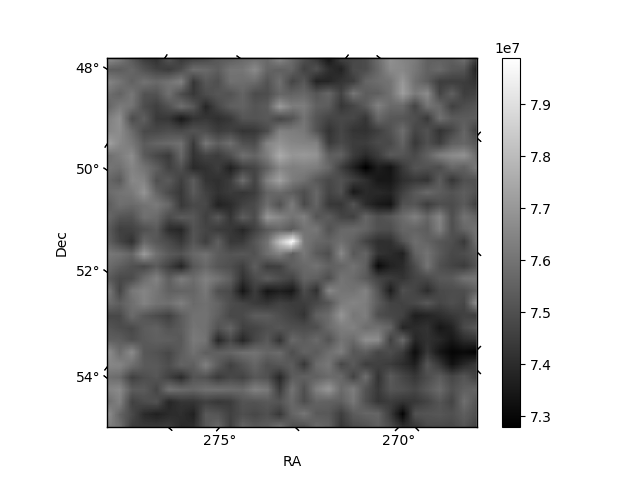
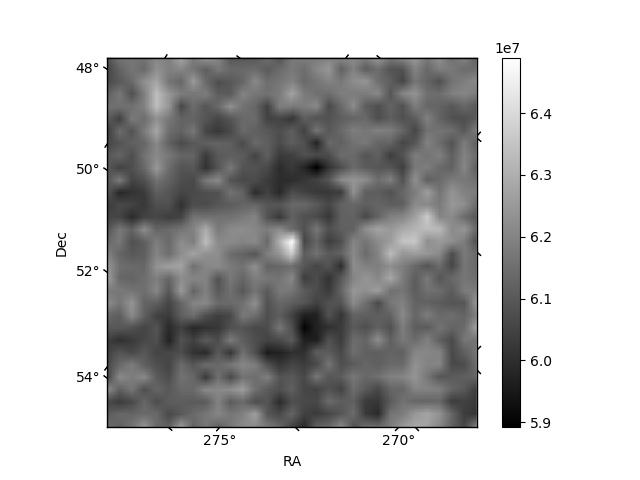
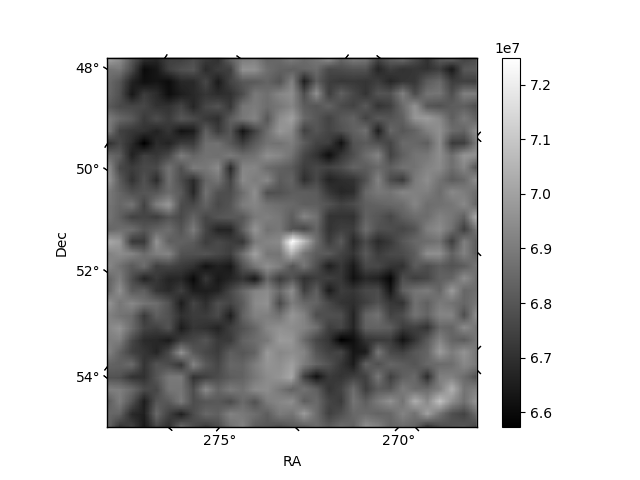
Histogram calculated using DETX and DETY for each event in the final _common_clean file
| Quadrant A |  |
 |
Quadrant B |
|---|---|---|---|
| Quadrant D | 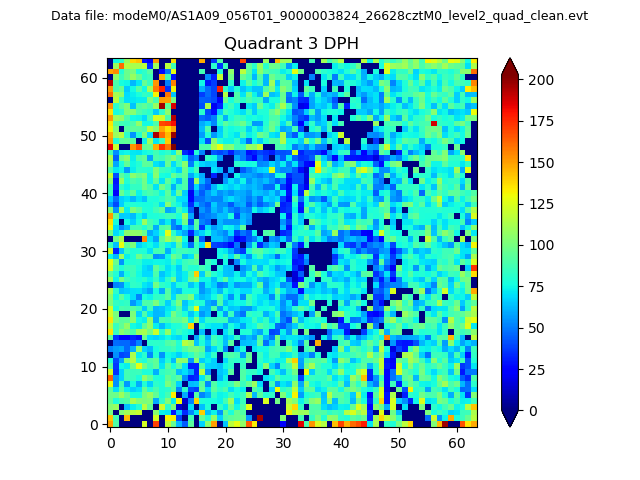 |
 |
Quadrant C |
| Plot type | Count rate plots | Images |
|---|---|---|
| Comparison with Poisson distribution Blue bars denote a histogram of data divided into 1 sec bins. Red curve is a Poisson curve with rate = median count rate of data. |
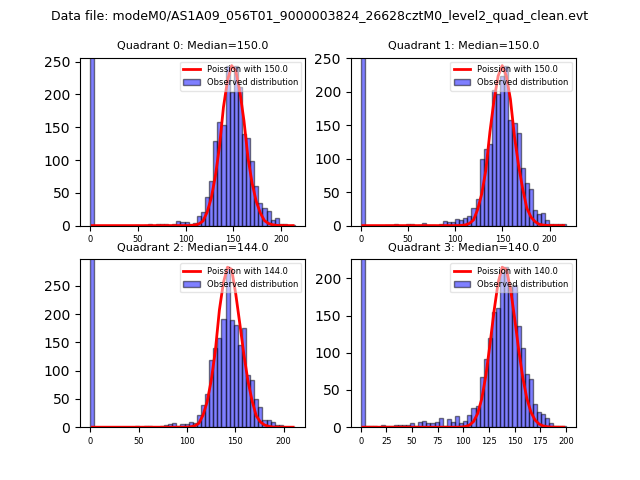 |
 |
| Quadrant-wise count rates Data is divided into 100 sec bins |
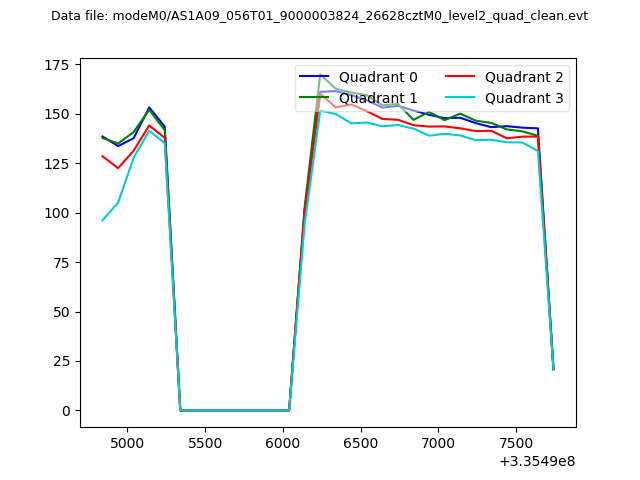 |
|
| Module-wise count rates for Quadrant A Data is divided into 100 sec bins |
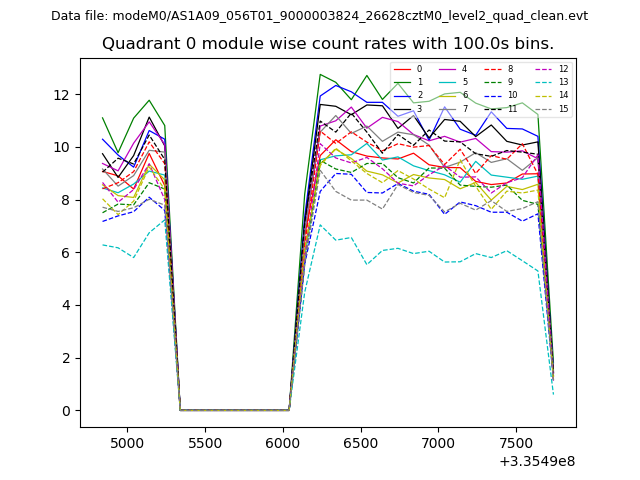 |
 |
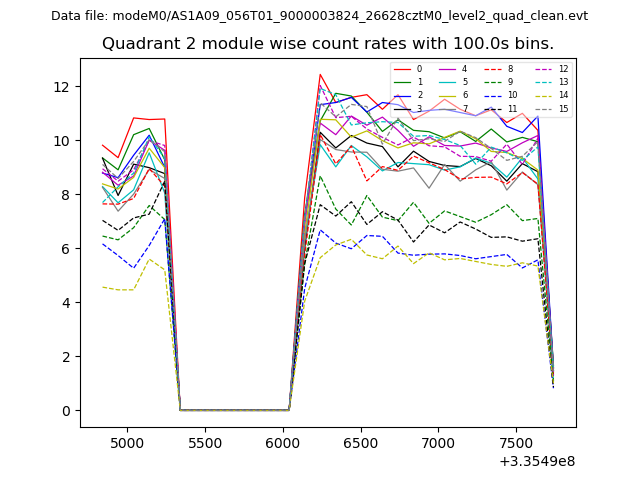
| Module-wise count rates for Quadrant B Data is divided into 100 sec bins |
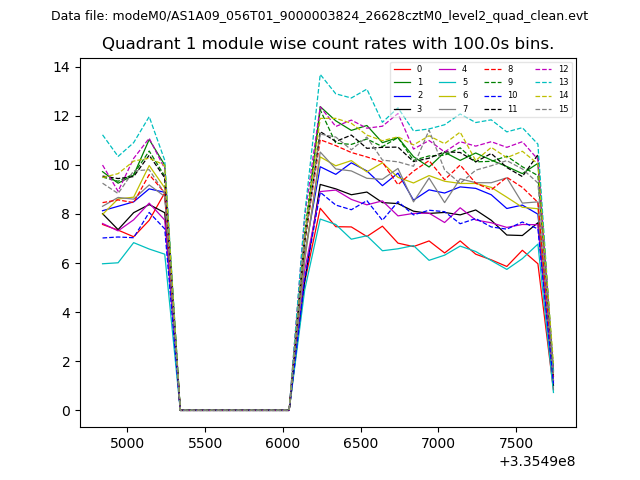 |
 |
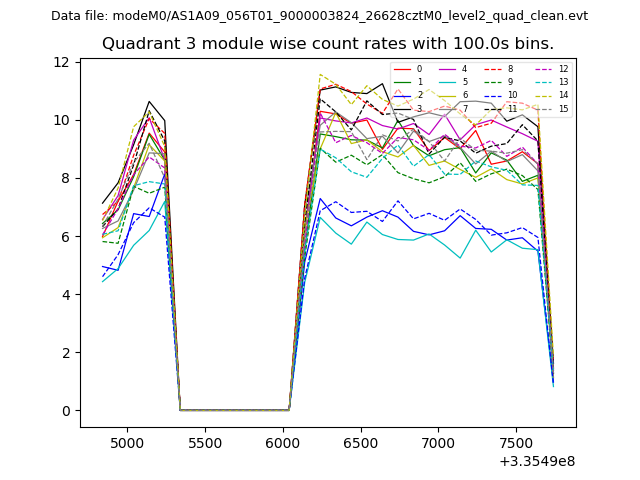
| Module-wise count rates for Quadrant C Data is divided into 100 sec bins |
 |
 |
| Module-wise count rates for Quadrant D Data is divided into 100 sec bins |
 |
 |
| Parameter | Plot |
|---|---|
| CZT HV Monitor | 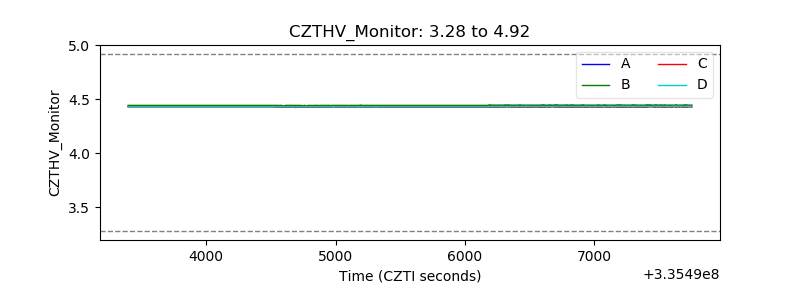 |
| D_VDD | 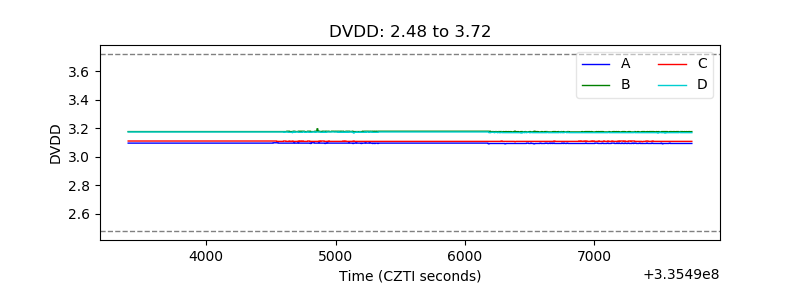 |
| Temperature 1 | 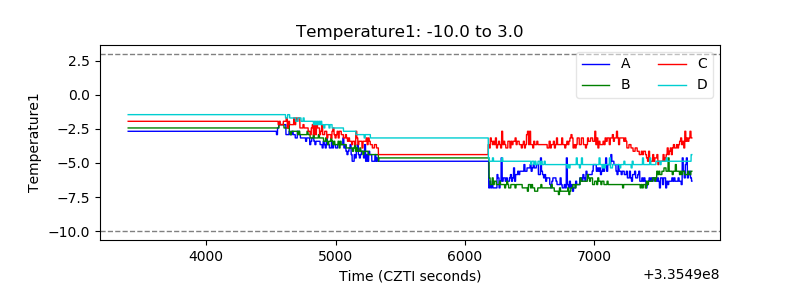 |
| Veto HV Monitor | 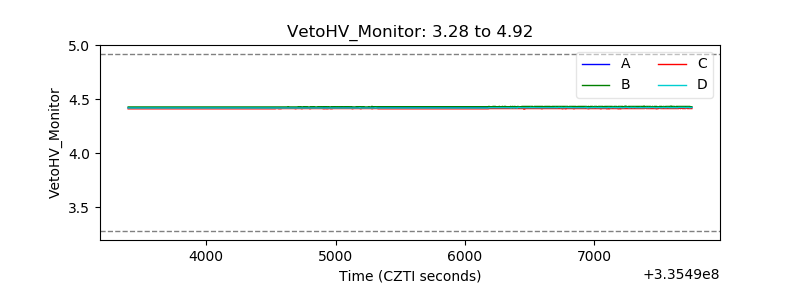 |
| Veto LLD | 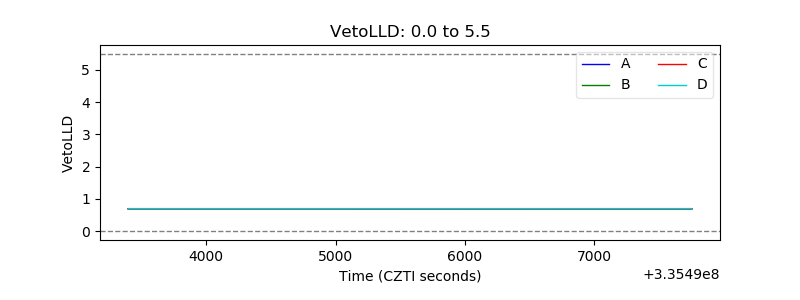 |
| Alpha Counter | 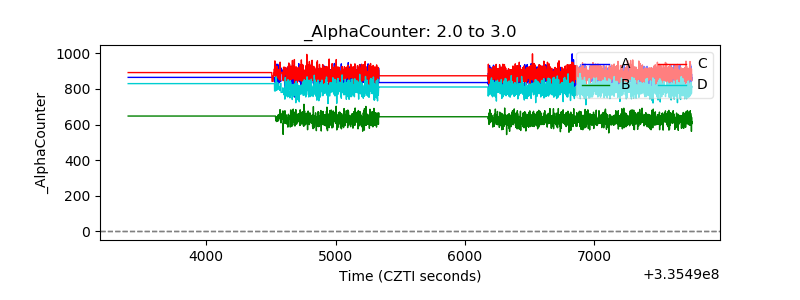 |
| _CPM_Rate | 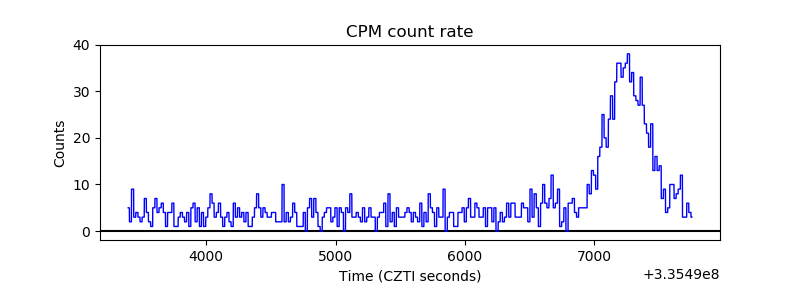 |
| CZT Counter | 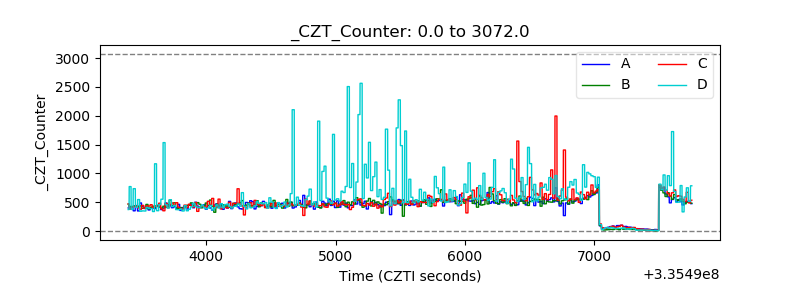 |
| +2.5 Volts monitor | 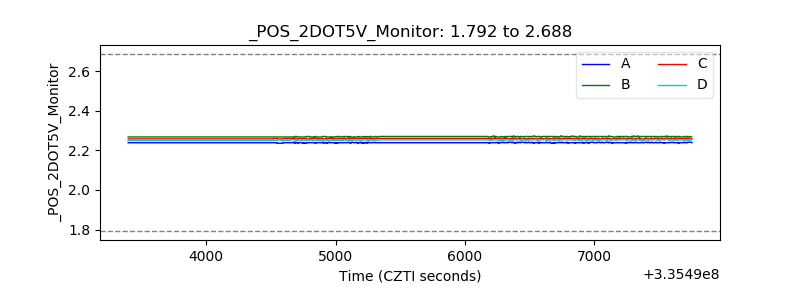 |
| +5 Volts monitor |  |
| _ROLL_ROT | 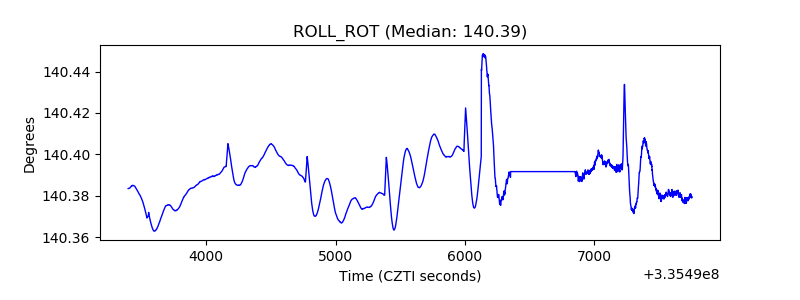 |
| _Roll_DEC |  |
| _Roll_RA |  |
| Veto Counter | 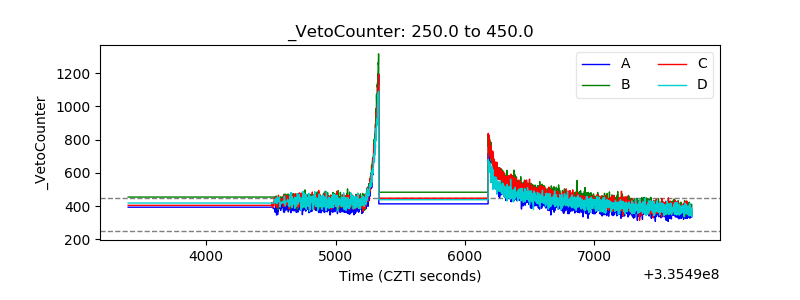 |