| Param | Original file | Final file |
|---|---|---|
| Filename | modeM0/AS1A09_104T02_9000003826cztM0_level2.fits | modeM0/AS1A09_104T02_9000003826cztM0_level2_quad_clean.evt |
| Size (bytes) | 105,416,640 | 71,850,240 |
| Size | 100.5 MB | 68.5 MB |
| Events in quadrant A | 664,903 | 378,576 |
| Events in quadrant B | 629,461 | 377,103 |
| Events in quadrant C | 642,958 | 368,336 |
| Events in quadrant D | 507,474 | 305,023 |
| Mode SS | |||
|---|---|---|---|
| Quadrant | BADHDUFLAG | Total packets | Discarded packets |
| A | 0 | 226 | 0 |
| B | 0 | 220 | 0 |
| C | 0 | 228 | 0 |
| D | 0 | 221 | 0 |
| Mode M0 | |||
|---|---|---|---|
| Quadrant | BADHDUFLAG | Total packets | Discarded packets |
| A | 0 | 23014 | 0 |
| B | 0 | 24362 | 0 |
| C | 0 | 24133 | 0 |
| D | 0 | 32641 | 0 |
| Mode M9 | |||
|---|---|---|---|
| Quadrant | BADHDUFLAG | Total packets | Discarded packets |
| A | 0 | 17 | 0 |
| B | 0 | 18 | 0 |
| C | 0 | 18 | 0 |
| D | 0 | 17 | 0 |
| Quadrant | Total seconds | Saturated seconds | Saturation percentage |
|---|---|---|---|
| A | 10930 | 92 | 0.841720% |
| B | 10812 | 127 | 1.174621% |
| C | 10967 | 251 | 2.288684% |
| D | 10308 | 955 | 9.264649% |
Noise dominated data is calculated using 1-second bins in cleaned event files. If a bin has >2000 counts, and if more than 50% of those come from <1% of pixels, then it is considered to be noise-dominated and hence unusable.
| Quadrant | # 1 sec bins | Bins with >0 counts | Bins with >2000 counts | High rate bins dominated by noise | Noise dominated (total time) | Noise dominated (detector-on time) | Marked lightcurve |
|---|---|---|---|---|---|---|---|
| A | 15708 | 10952 | 0 | 0 | 0.00% | 0.00% | 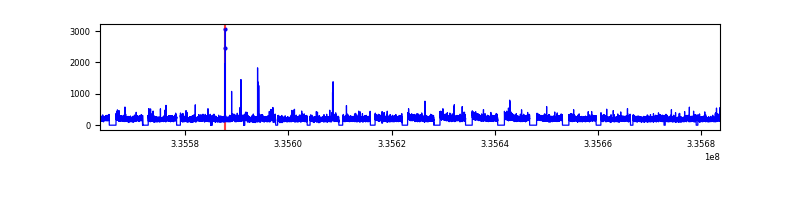 |
| B | 15708 | 10738 | 0 | 0 | 0.00% | 0.00% | 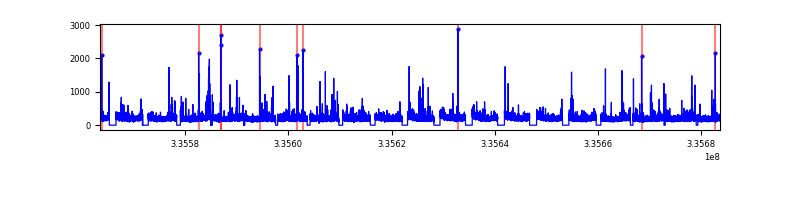 |
| C | 15708 | 10918 | 0 | 0 | 0.00% | 0.00% | 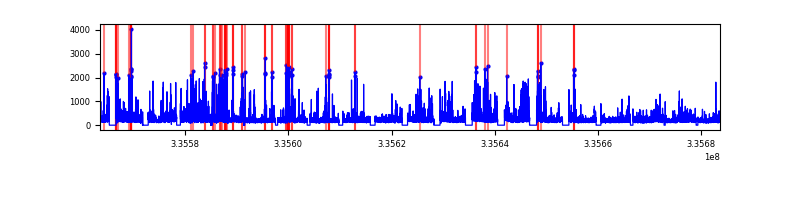 |
| D | 15708 | 10236 | 0 | 0 | 0.00% | 0.00% | 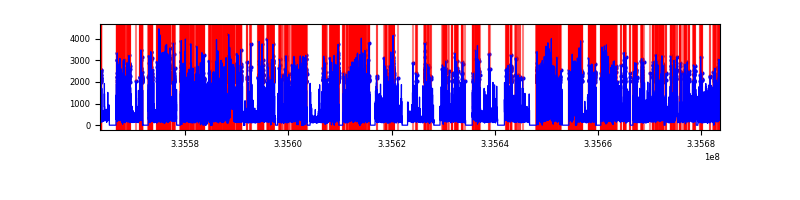 |
Top three noisy pixels from each quadrant. If the there are fewer than three noisy pixels in the level2.evt file, extra rows are filled as -1
| Pixel properties | Quadrant properties | ||||||
|---|---|---|---|---|---|---|---|
| Quadrant | DetID | PixID | Counts | Sigma | Mean | Median | Sigma |
| A | 0 | 29 | 542 | 8.51 | 173 | 163 | 44.5 |
| A | 7 | 110 | 525 | 8.13 | 173 | 163 | 44.5 |
| A | 9 | 19 | 519 | 8.0 | 173 | 163 | 44.5 |
| B | 2 | 9 | 549 | 11.36 | 166 | 158 | 34.4 |
| B | 2 | 8 | 429 | 7.87 | 166 | 158 | 34.4 |
| B | 5 | 232 | 418 | 7.55 | 166 | 158 | 34.4 |
| C | 1 | 80 | 514 | 7.86 | 169 | 159 | 45.2 |
| C | 1 | 81 | 510 | 7.77 | 169 | 159 | 45.2 |
| C | 12 | 241 | 452 | 6.49 | 169 | 159 | 45.2 |
| D | 15 | 46 | 372 | 6.0 | 144 | 132 | 40.0 |
| D | 10 | 113 | 371 | 5.97 | 144 | 132 | 40.0 |
| D | 6 | 83 | 363 | 5.77 | 144 | 132 | 40.0 |
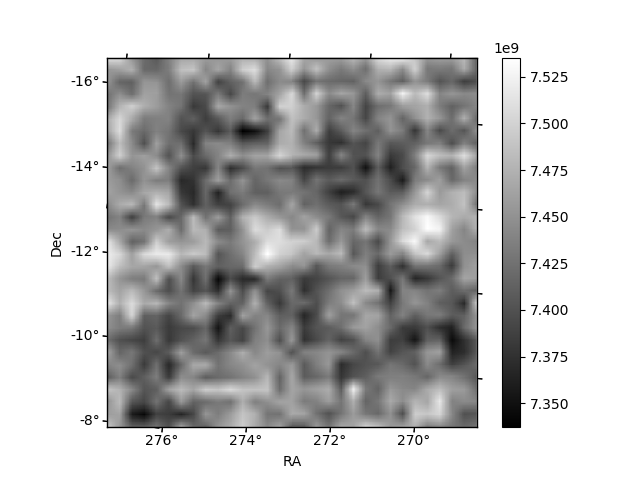
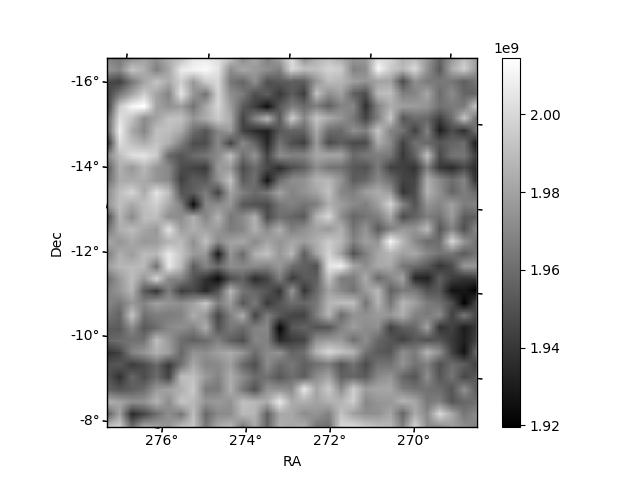
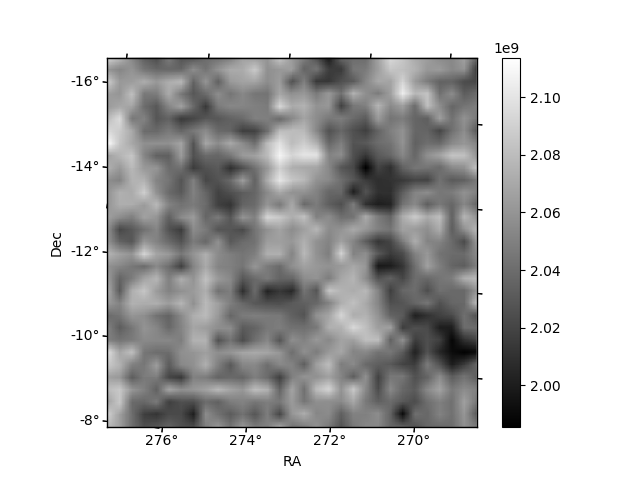
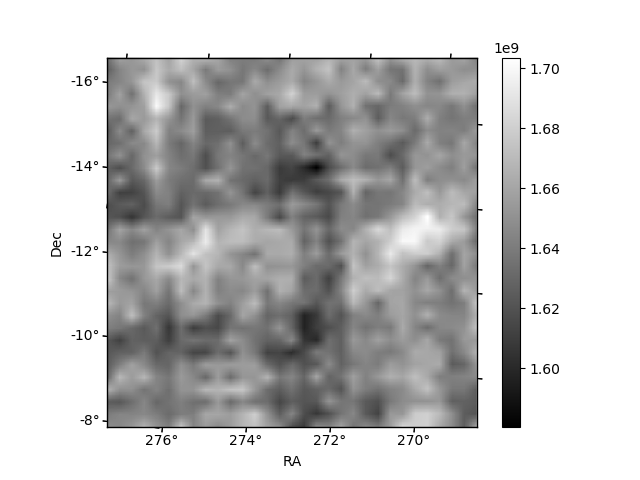
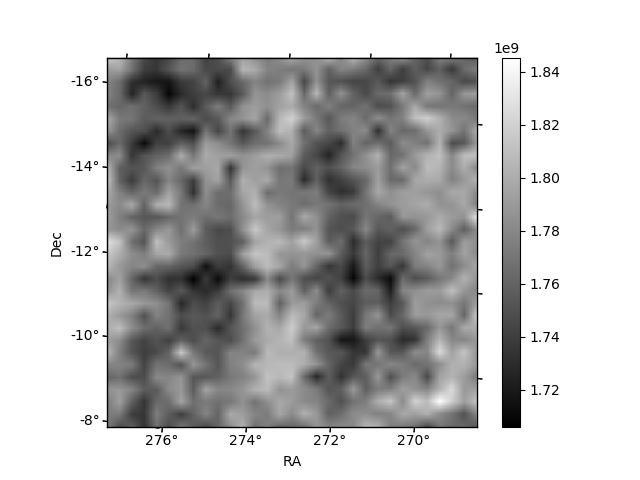
Histogram calculated using DETX and DETY for each event in the final _common_clean file
| Quadrant A | 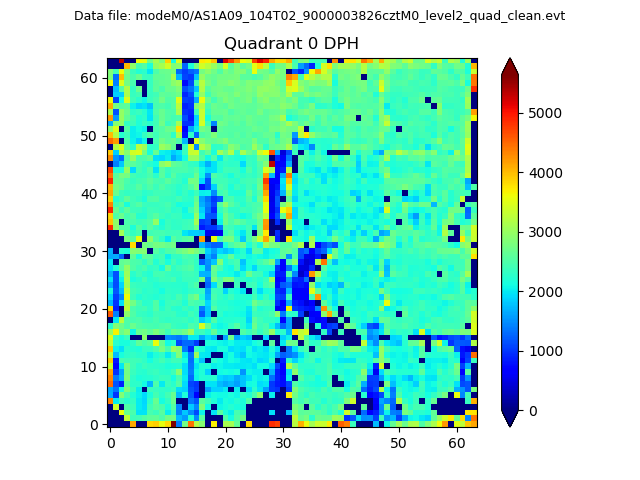 |
 |
Quadrant B |
|---|---|---|---|
| Quadrant D | 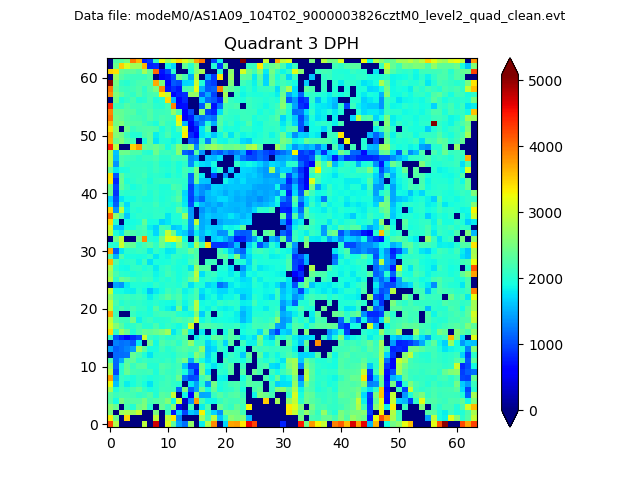 |
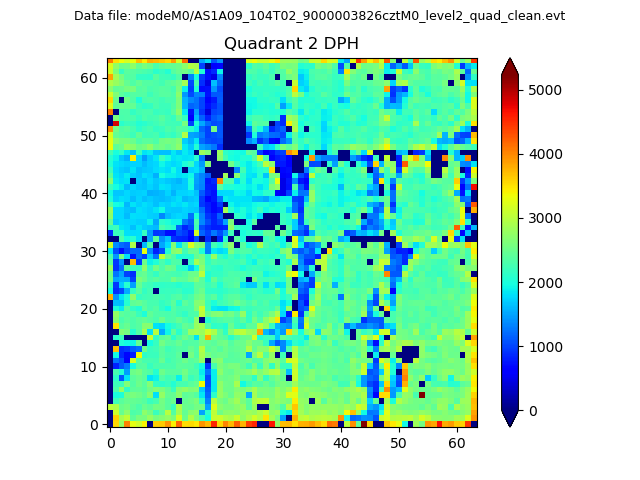 |
Quadrant C |
| Plot type | Count rate plots | Images |
|---|---|---|
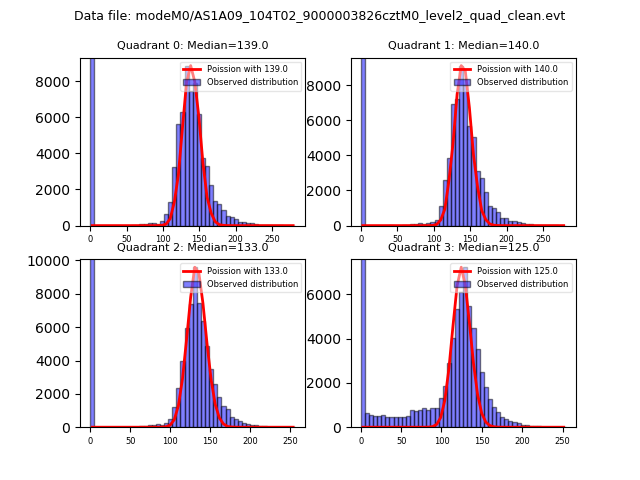
| Comparison with Poisson distribution Blue bars denote a histogram of data divided into 1 sec bins. Red curve is a Poisson curve with rate = median count rate of data. |
 |
 |
| Quadrant-wise count rates Data is divided into 100 sec bins |
 |
|
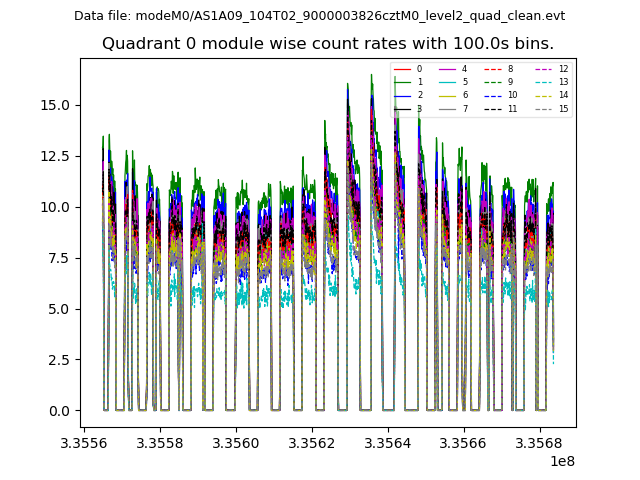
| Module-wise count rates for Quadrant A Data is divided into 100 sec bins |
 |
 |
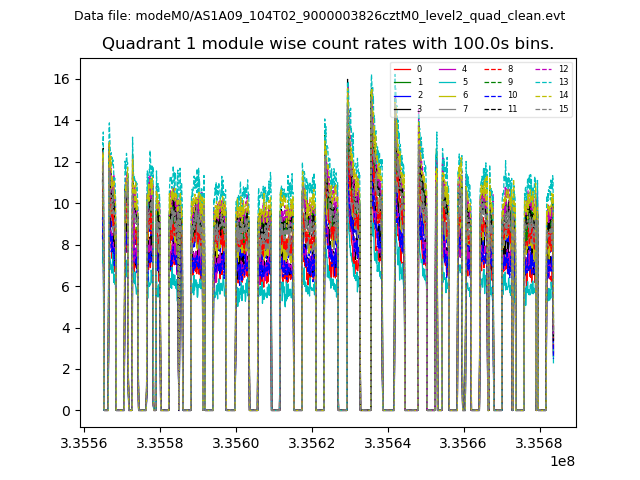
| Module-wise count rates for Quadrant B Data is divided into 100 sec bins |
 |
 |
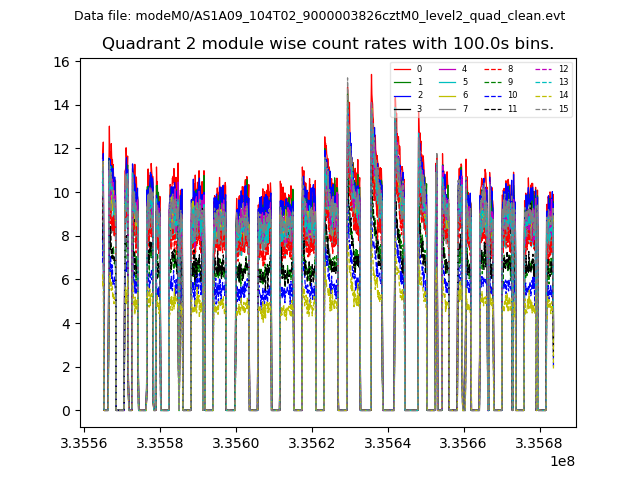
| Module-wise count rates for Quadrant C Data is divided into 100 sec bins |
 |
 |
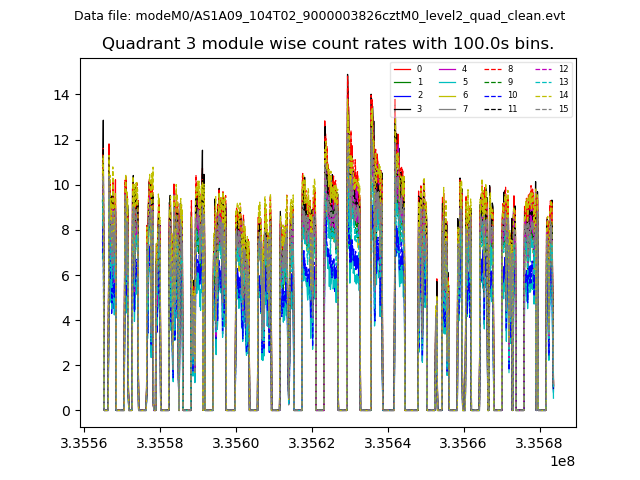
| Module-wise count rates for Quadrant D Data is divided into 100 sec bins |
 |
 |
| Parameter | Plot |
|---|---|
| CZT HV Monitor |  |
| D_VDD | 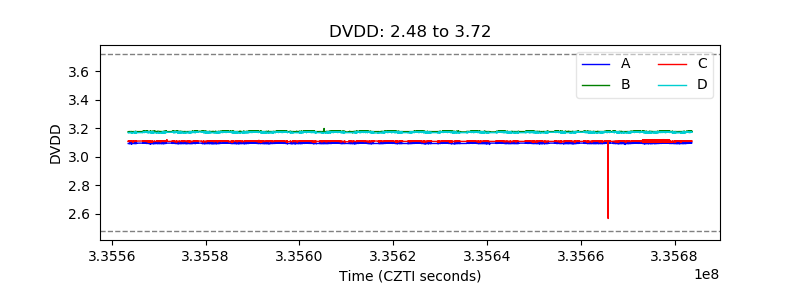 |
| Temperature 1 | 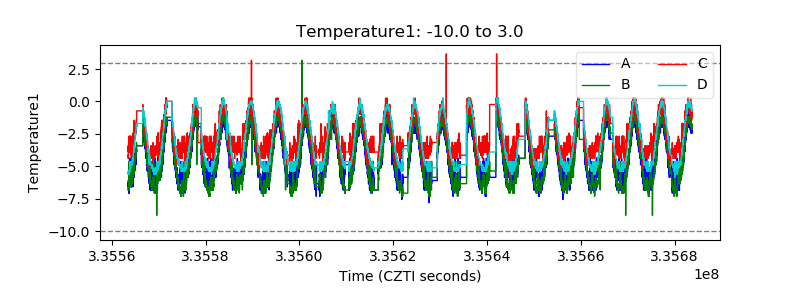 |
| Veto HV Monitor |  |
| Veto LLD | 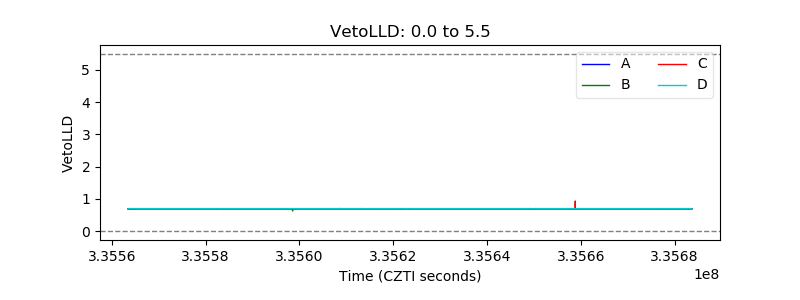 |
| Alpha Counter | 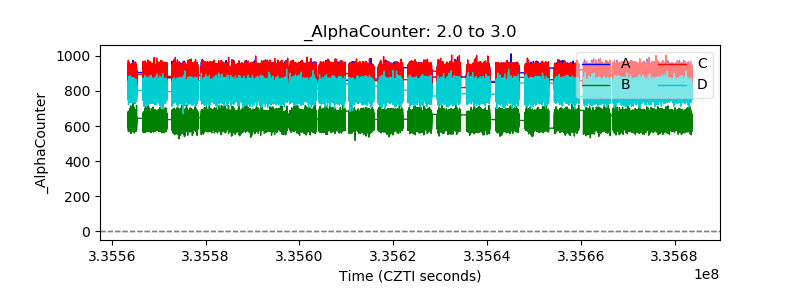 |
| _CPM_Rate | 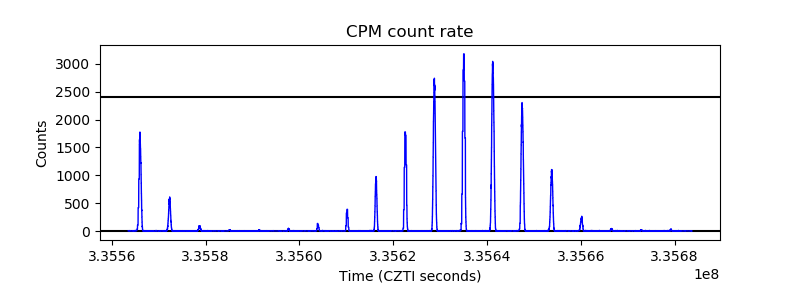 |
| CZT Counter | 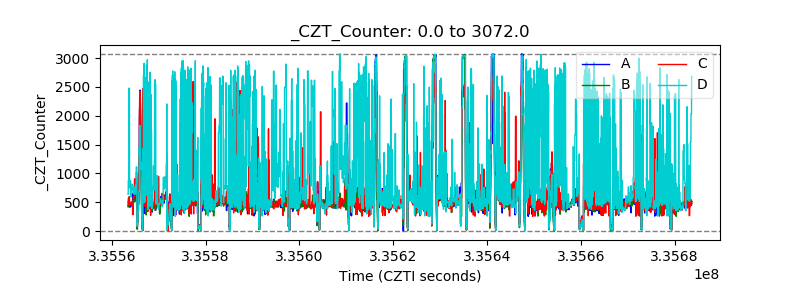 |
| +2.5 Volts monitor | 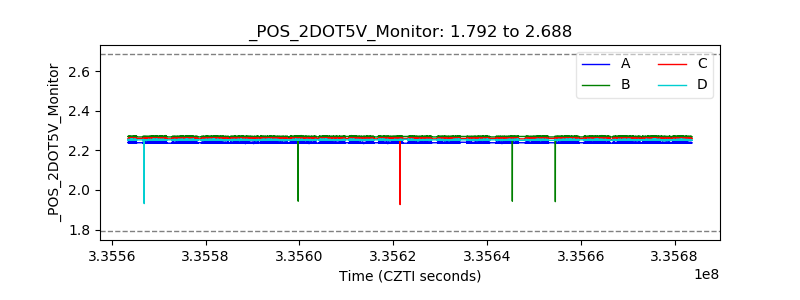 |
| +5 Volts monitor |  |
| _ROLL_ROT | 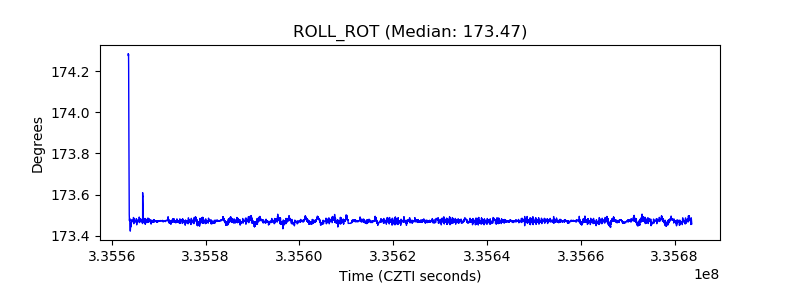 |
| _Roll_DEC |  |
| _Roll_RA | 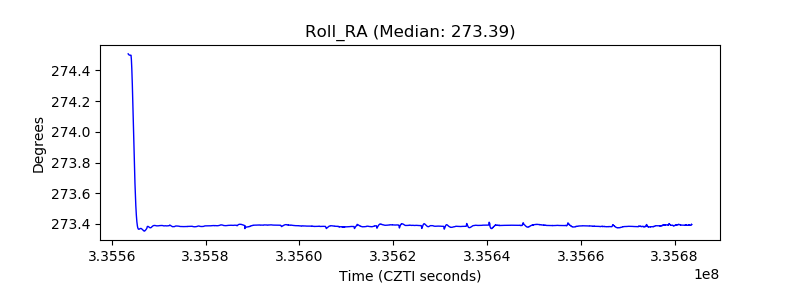 |
| Veto Counter | 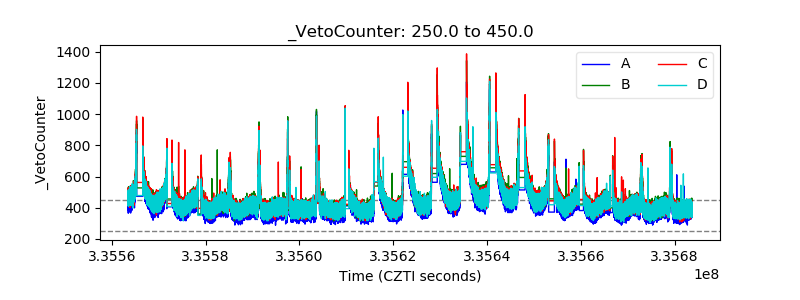 |