| Param | Original file | Final file |
|---|---|---|
| Filename | modeM0/AS1A09_104T02_9000003826_26461cztM0_level2.evt | modeM0/AS1A09_104T02_9000003826_26461cztM0_level2_quad_clean.evt |
| Size (bytes) | 289,203,840 | 39,251,520 |
| Size | 275.8 MB | 37.4 MB |
| Events in quadrant A | 1,652,162 | 253,184 |
| Events in quadrant B | 1,693,769 | 260,661 |
| Events in quadrant C | 1,985,447 | 240,818 |
| Events in quadrant D | 3,219,190 | 216,398 |
| Mode M0 | |||
|---|---|---|---|
| Quadrant | BADHDUFLAG | Total packets | Discarded packets |
| A | 0 | 6716 | 0 |
| B | 0 | 6792 | 0 |
| C | 0 | 7807 | 0 |
| D | 0 | 11763 | 0 |
| Mode M9 | |||
|---|---|---|---|
| Quadrant | BADHDUFLAG | Total packets | Discarded packets |
| A | 0 | 13 | 0 |
| B | 0 | 13 | 0 |
| C | 0 | 13 | 0 |
| D | 0 | 13 | 0 |
| Quadrant | Total seconds | Saturated seconds | Saturation percentage |
|---|---|---|---|
| A | 3047 | 63 | 2.067607% |
| B | 3047 | 98 | 3.216278% |
| C | 3047 | 191 | 6.268461% |
| D | 3047 | 418 | 13.718412% |
Noise dominated data is calculated using 1-second bins in cleaned event files. If a bin has >2000 counts, and if more than 50% of those come from <1% of pixels, then it is considered to be noise-dominated and hence unusable.
| Quadrant | # 1 sec bins | Bins with >0 counts | Bins with >2000 counts | High rate bins dominated by noise | Noise dominated (total time) | Noise dominated (detector-on time) | Marked lightcurve |
|---|---|---|---|---|---|---|---|
| A | 4352 | 3048 | 0 | 0 | 0.00% | 0.00% | 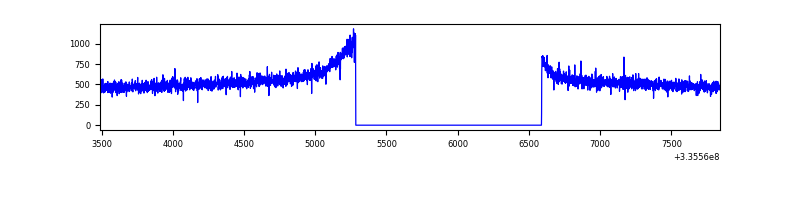 |
| B | 4352 | 3048 | 2 | 2 | 0.05% | 0.07% | 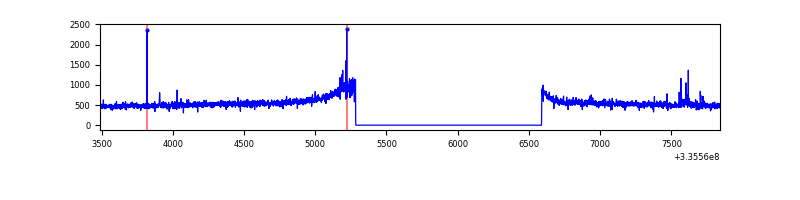 |
| C | 4352 | 3048 | 31 | 31 | 0.71% | 1.02% | 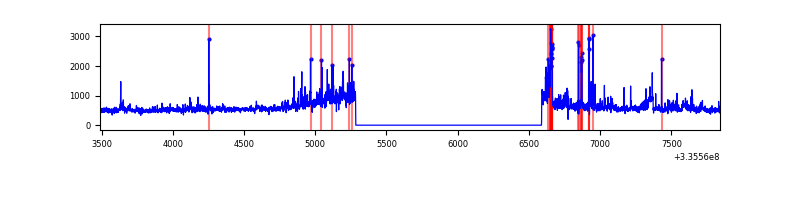 |
| D | 4352 | 3048 | 346 | 346 | 7.95% | 11.35% | 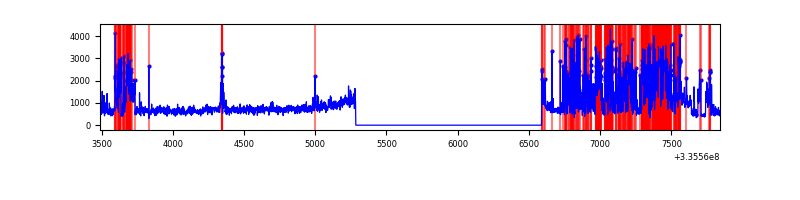 |
Top three noisy pixels from each quadrant. If the there are fewer than three noisy pixels in the level2.evt file, extra rows are filled as -1
| Pixel properties | Quadrant properties | ||||||
|---|---|---|---|---|---|---|---|
| Quadrant | DetID | PixID | Counts | Sigma | Mean | Median | Sigma |
| A | 13 | 254 | 4917 | 51.46 | 428 | 419 | 87.4 |
| A | 3 | 137 | 3919 | 40.04 | 428 | 419 | 87.4 |
| A | 0 | 226 | 3662 | 37.1 | 428 | 419 | 87.4 |
| B | 0 | 244 | 10216 | 117.87 | 426 | 413 | 83.2 |
| B | 12 | 111 | 9680 | 111.43 | 426 | 413 | 83.2 |
| B | 11 | 111 | 8754 | 100.29 | 426 | 413 | 83.2 |
| C | 3 | 233 | 250175 | 2553.54 | 408 | 411 | 97.8 |
| C | 2 | 16 | 69333 | 704.65 | 408 | 411 | 97.8 |
| C | 14 | 238 | 65132 | 661.7 | 408 | 411 | 97.8 |
| D | 1 | 52 | 1056959 | 10949.02 | 396 | 386 | 96.5 |
| D | 12 | 233 | 565783 | 5859.08 | 396 | 386 | 96.5 |
| D | 7 | 80 | 81098 | 836.4 | 396 | 386 | 96.5 |
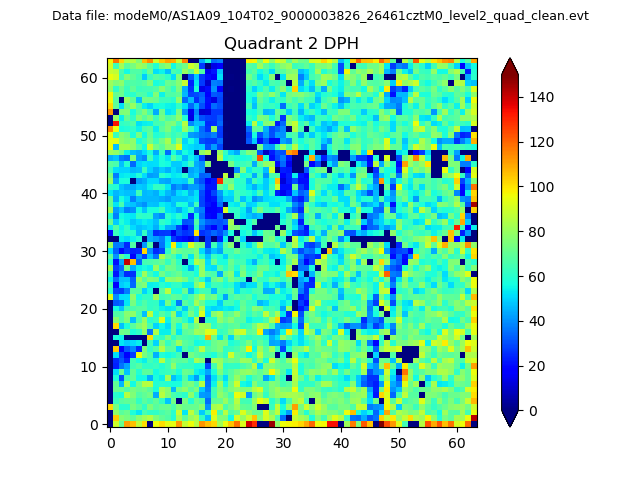
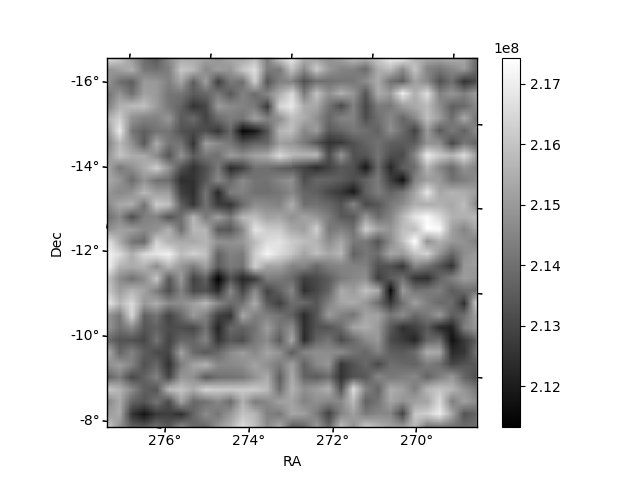
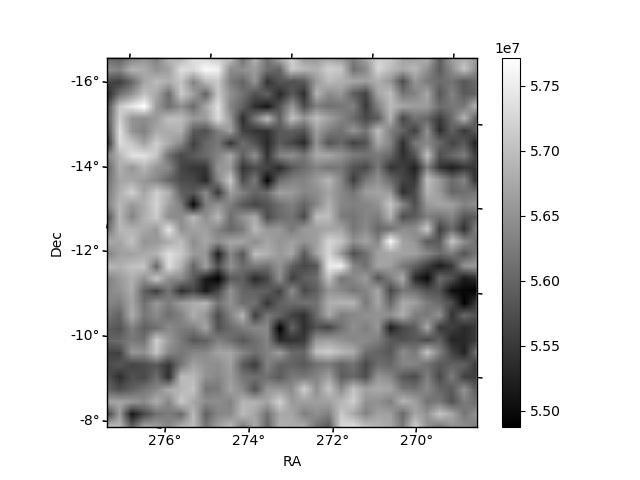
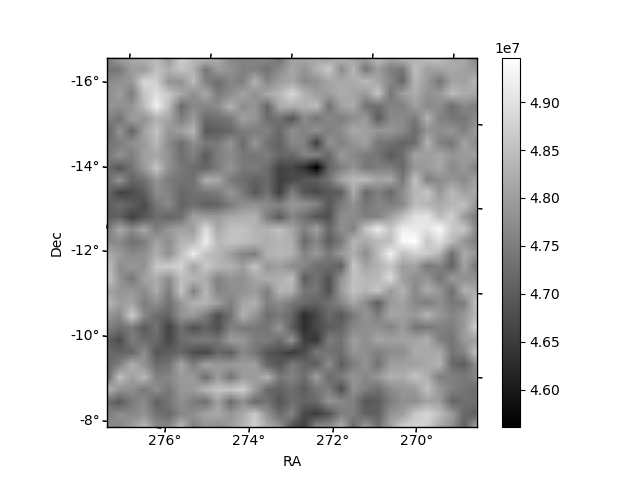
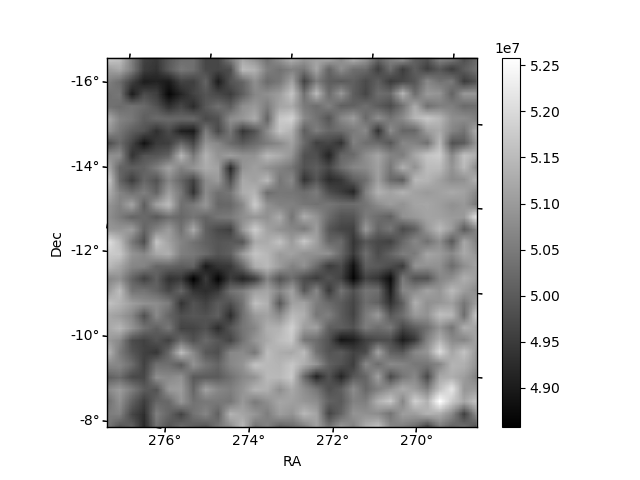
Histogram calculated using DETX and DETY for each event in the final _common_clean file
| Quadrant A | 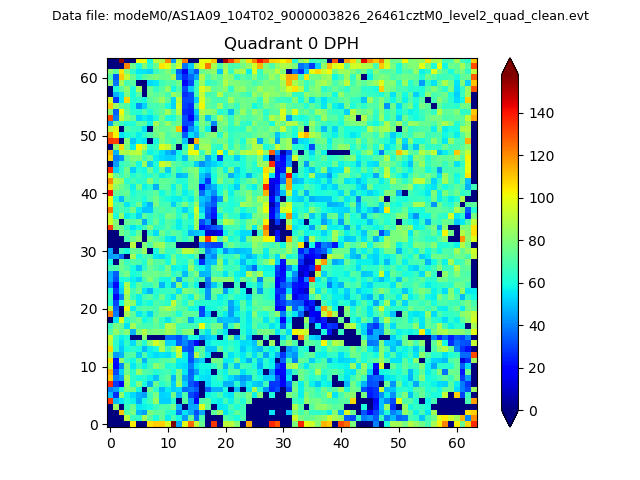 |
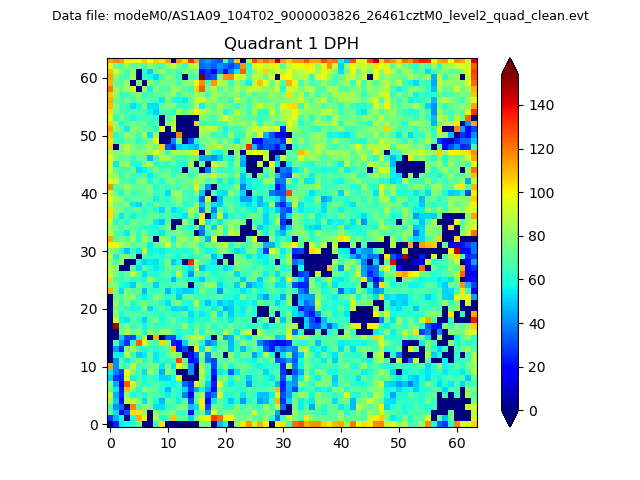 |
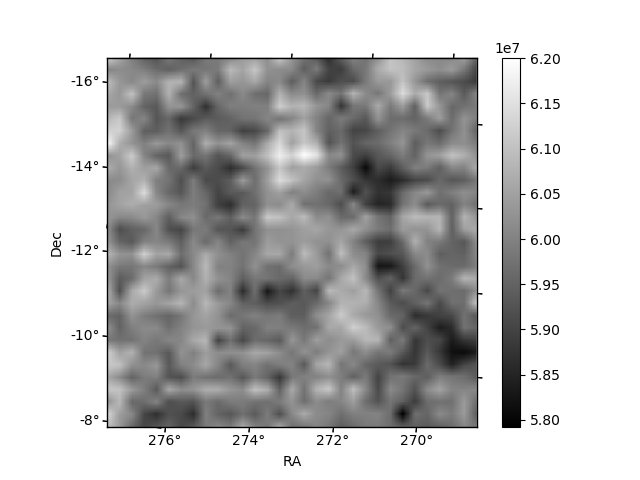
Quadrant B |
|---|---|---|---|
| Quadrant D | 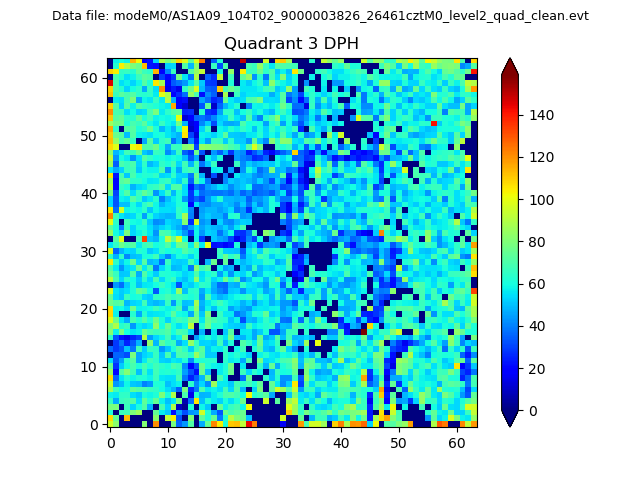 |
 |
Quadrant C |
| Plot type | Count rate plots | Images |
|---|---|---|
| Comparison with Poisson distribution Blue bars denote a histogram of data divided into 1 sec bins. Red curve is a Poisson curve with rate = median count rate of data. |
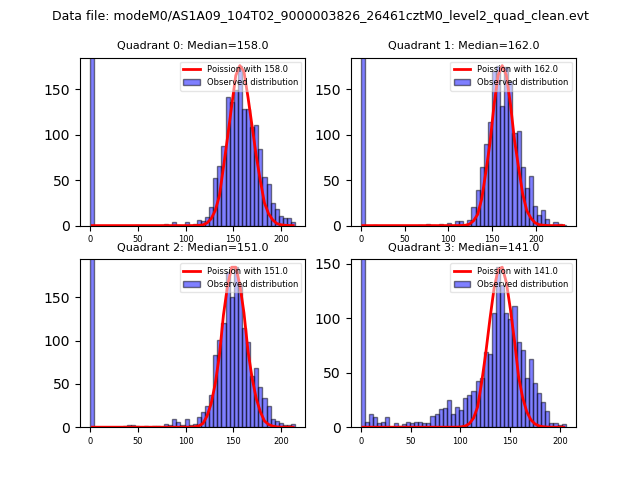 |
 |
| Quadrant-wise count rates Data is divided into 100 sec bins |
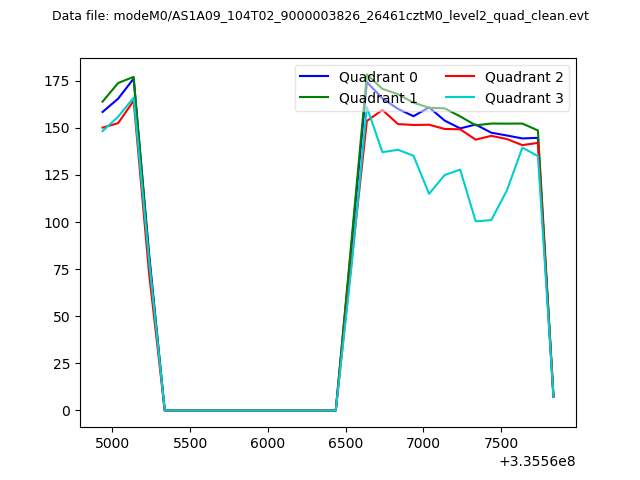 |
|
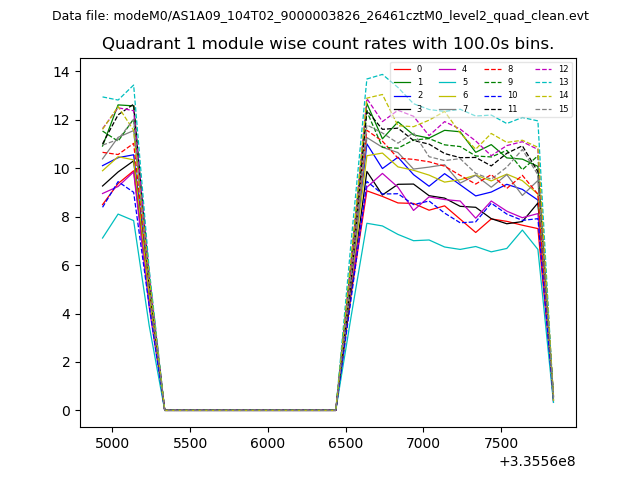
| Module-wise count rates for Quadrant A Data is divided into 100 sec bins |
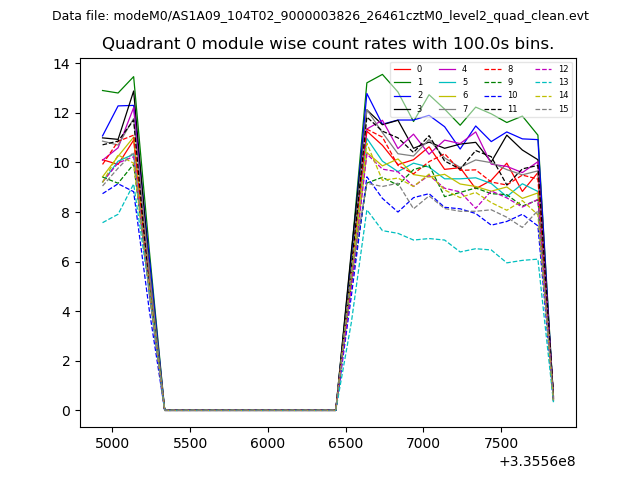 |
 |
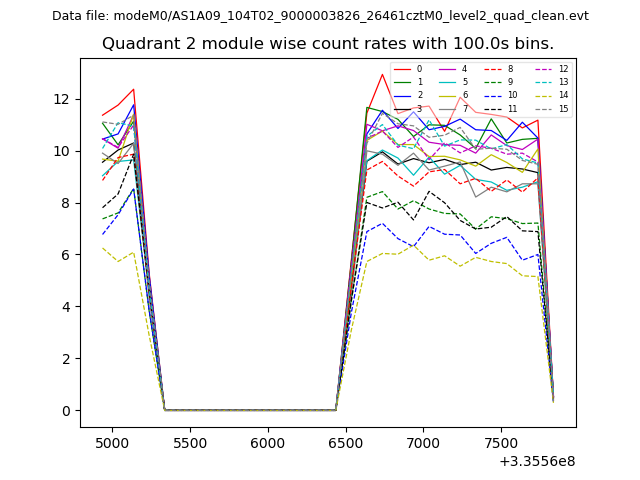
| Module-wise count rates for Quadrant B Data is divided into 100 sec bins |
 |
 |
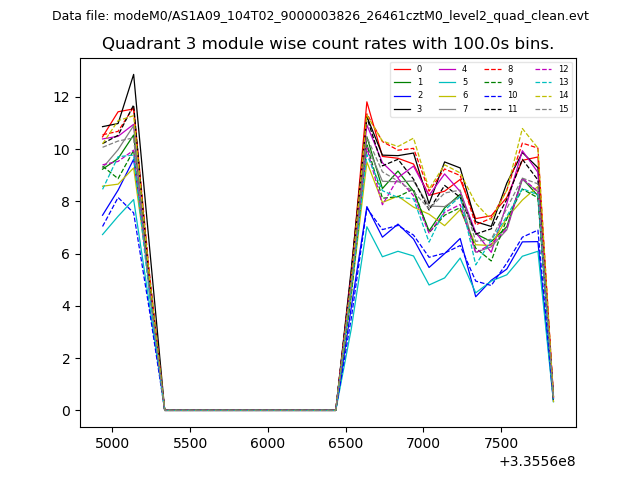
| Module-wise count rates for Quadrant C Data is divided into 100 sec bins |
 |
 |
| Module-wise count rates for Quadrant D Data is divided into 100 sec bins |
 |
 |
| Parameter | Plot |
|---|---|
| CZT HV Monitor | 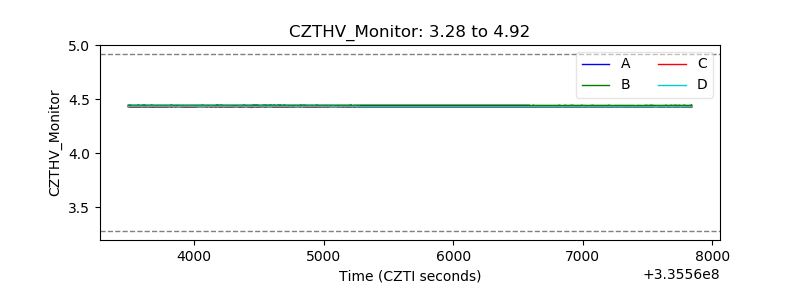 |
| D_VDD | 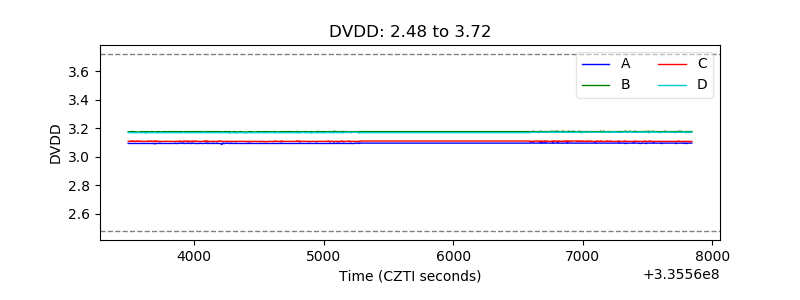 |
| Temperature 1 | 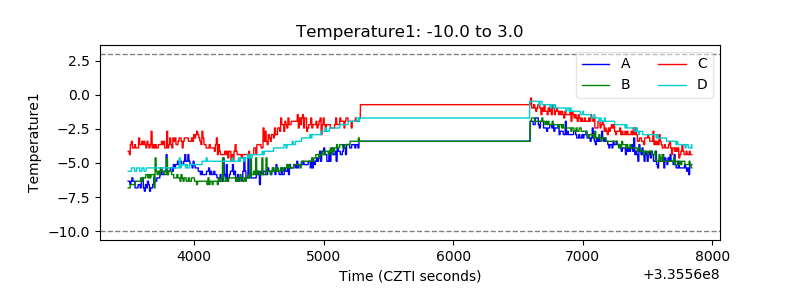 |
| Veto HV Monitor | 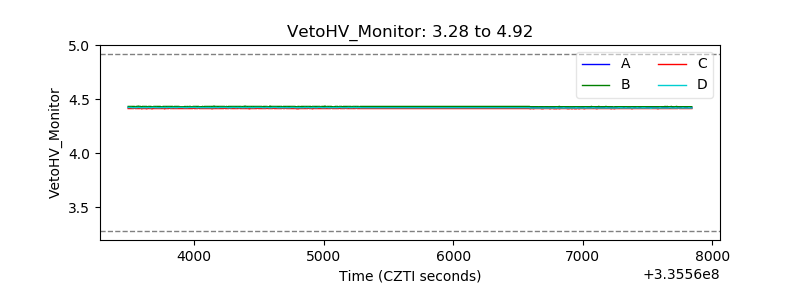 |
| Veto LLD | 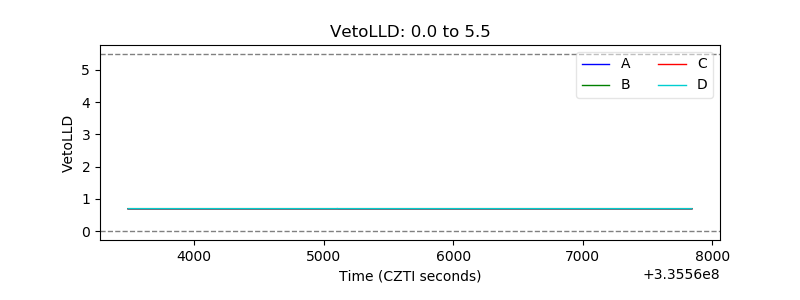 |
| Alpha Counter | 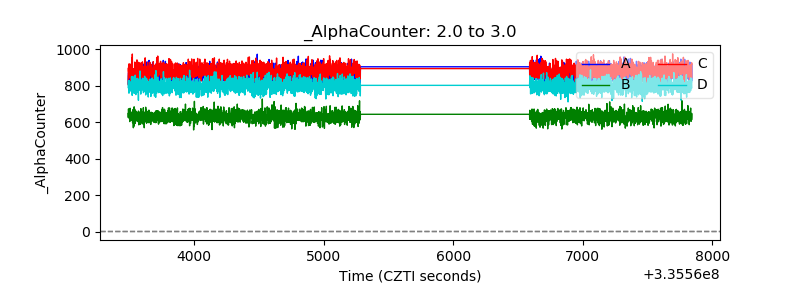 |
| _CPM_Rate | 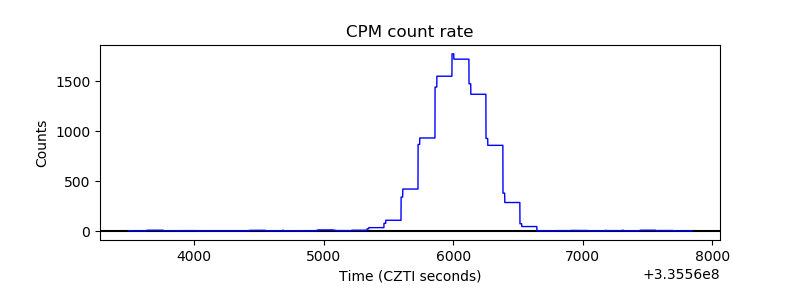 |
| CZT Counter | 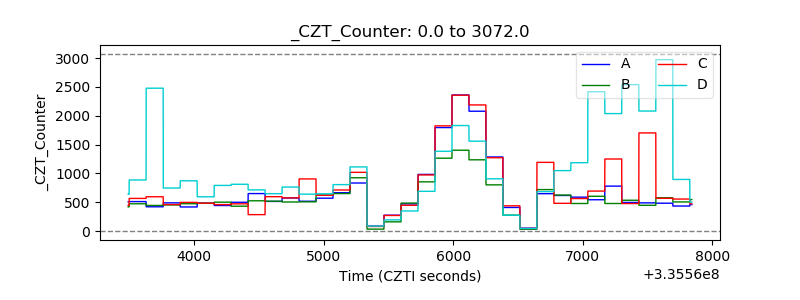 |
| +2.5 Volts monitor | 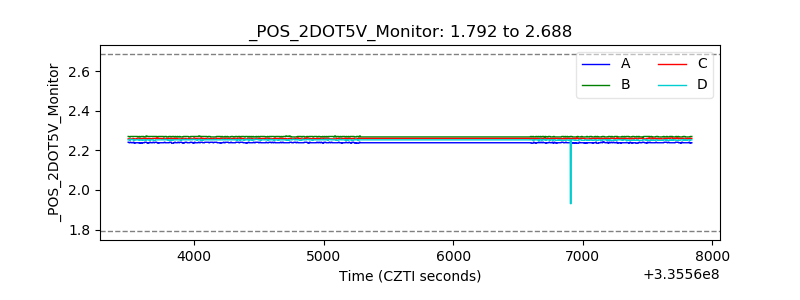 |
| +5 Volts monitor | 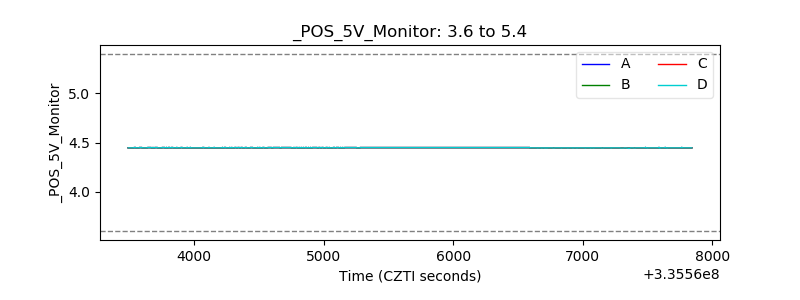 |
| _ROLL_ROT | 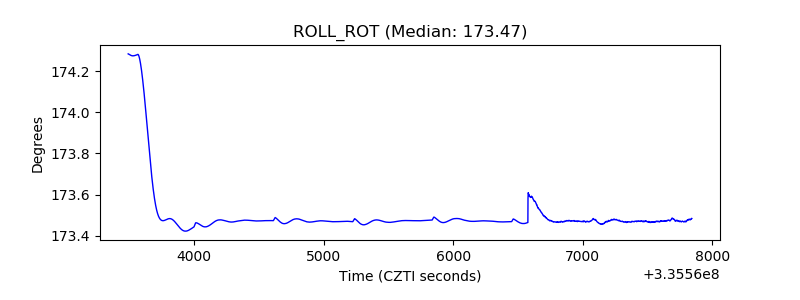 |
| _Roll_DEC | 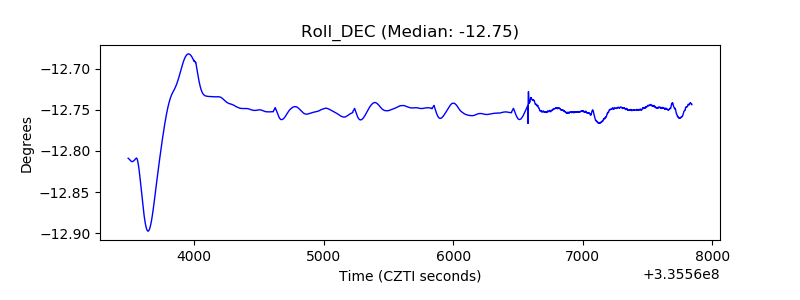 |
| _Roll_RA | 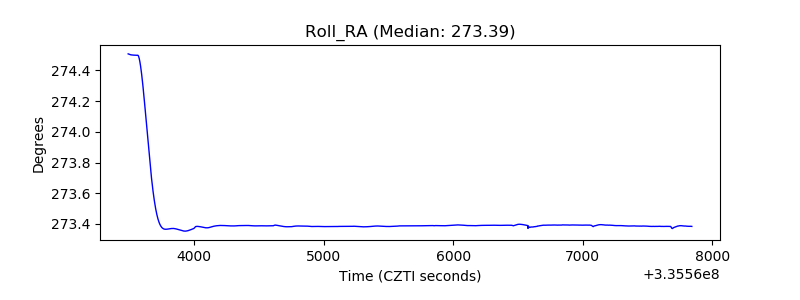 |
| Veto Counter | 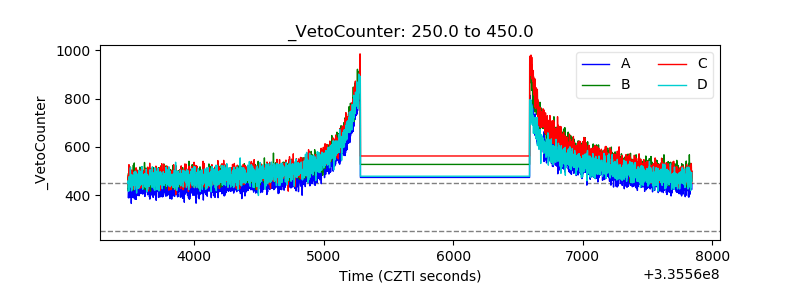 |