| Param | Original file | Final file |
|---|---|---|
| Filename | modeM0/AS1A09_104T02_9000003826_26462cztM0_level2.evt | modeM0/AS1A09_104T02_9000003826_26462cztM0_level2_quad_clean.evt |
| Size (bytes) | 563,489,280 | 92,712,960 |
| Size | 537.4 MB | 88.4 MB |
| Events in quadrant A | 3,188,666 | 613,638 |
| Events in quadrant B | 3,288,917 | 629,328 |
| Events in quadrant C | 3,773,167 | 593,935 |
| Events in quadrant D | 6,379,125 | 522,318 |
| Mode M0 | |||
|---|---|---|---|
| Quadrant | BADHDUFLAG | Total packets | Discarded packets |
| A | 0 | 13539 | 0 |
| B | 0 | 13689 | 0 |
| C | 0 | 15272 | 0 |
| D | 0 | 23241 | 0 |
| Mode M9 | |||
|---|---|---|---|
| Quadrant | BADHDUFLAG | Total packets | Discarded packets |
| A | 0 | 12 | 0 |
| B | 0 | 13 | 0 |
| C | 0 | 13 | 0 |
| D | 0 | 13 | 0 |
| Quadrant | Total seconds | Saturated seconds | Saturation percentage |
|---|---|---|---|
| A | 6425 | 38 | 0.591440% |
| B | 6425 | 45 | 0.700389% |
| C | 6425 | 149 | 2.319066% |
| D | 6425 | 919 | 14.303502% |
Noise dominated data is calculated using 1-second bins in cleaned event files. If a bin has >2000 counts, and if more than 50% of those come from <1% of pixels, then it is considered to be noise-dominated and hence unusable.
| Quadrant | # 1 sec bins | Bins with >0 counts | Bins with >2000 counts | High rate bins dominated by noise | Noise dominated (total time) | Noise dominated (detector-on time) | Marked lightcurve |
|---|---|---|---|---|---|---|---|
| A | 7530 | 6427 | 0 | 0 | 0.00% | 0.00% | 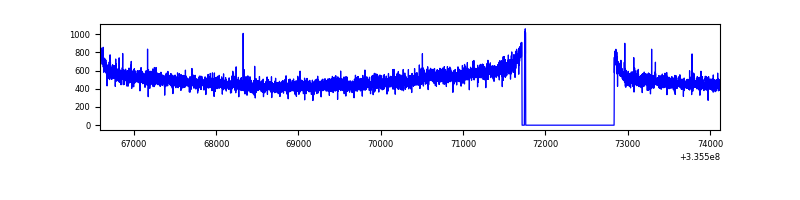 |
| B | 7530 | 6427 | 0 | 0 | 0.00% | 0.00% | 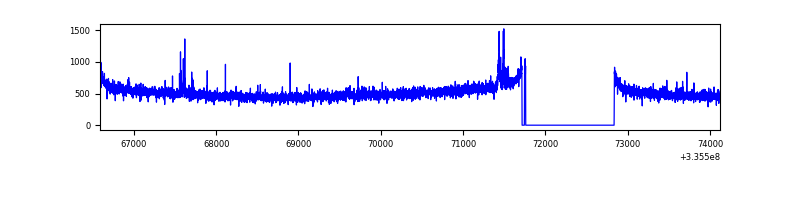 |
| C | 7530 | 6427 | 55 | 55 | 0.73% | 0.86% | 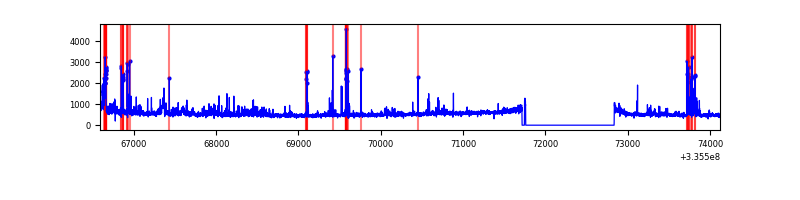 |
| D | 7530 | 6426 | 807 | 807 | 10.72% | 12.56% | 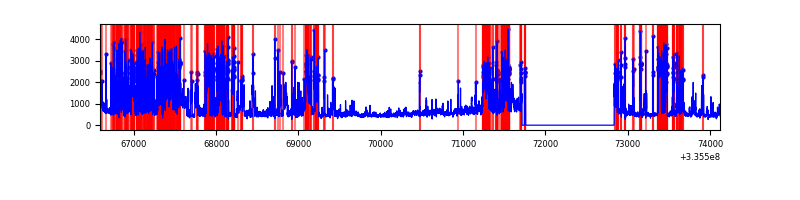 |
Top three noisy pixels from each quadrant. If the there are fewer than three noisy pixels in the level2.evt file, extra rows are filled as -1
| Pixel properties | Quadrant properties | ||||||
|---|---|---|---|---|---|---|---|
| Quadrant | DetID | PixID | Counts | Sigma | Mean | Median | Sigma |
| A | 13 | 254 | 10129 | 56.13 | 825 | 811 | 166.0 |
| A | 6 | 16 | 8649 | 47.22 | 825 | 811 | 166.0 |
| A | 3 | 137 | 7560 | 40.66 | 825 | 811 | 166.0 |
| B | 0 | 190 | 36416 | 227.37 | 825 | 805 | 156.6 |
| B | 12 | 111 | 18581 | 113.5 | 825 | 805 | 156.6 |
| B | 11 | 111 | 16796 | 102.1 | 825 | 805 | 156.6 |
| C | 3 | 233 | 303801 | 1631.8 | 790 | 798 | 185.7 |
| C | 2 | 16 | 233047 | 1250.76 | 790 | 798 | 185.7 |
| C | 14 | 238 | 127109 | 680.24 | 790 | 798 | 185.7 |
| D | 1 | 52 | 1866282 | 10463.67 | 747 | 730 | 178.3 |
| D | 12 | 233 | 1259446 | 7059.99 | 747 | 730 | 178.3 |
| D | 7 | 80 | 353931 | 1981.06 | 747 | 730 | 178.3 |
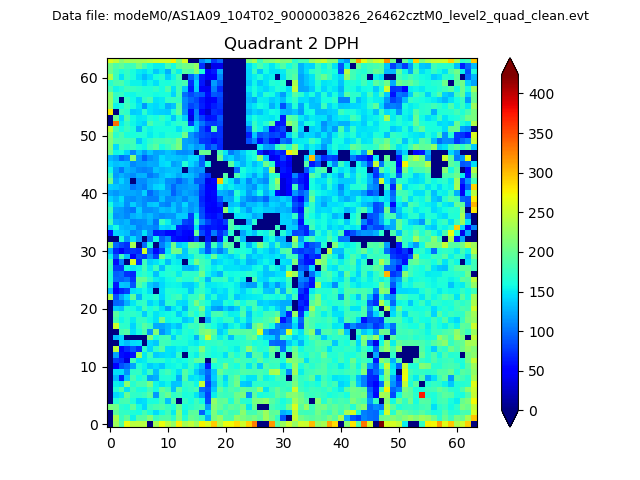
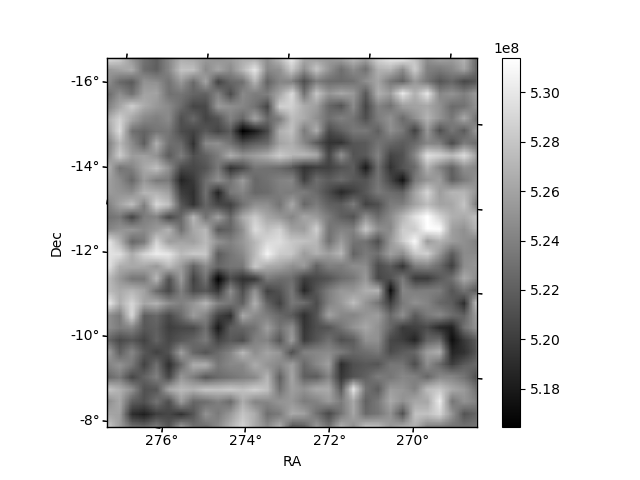
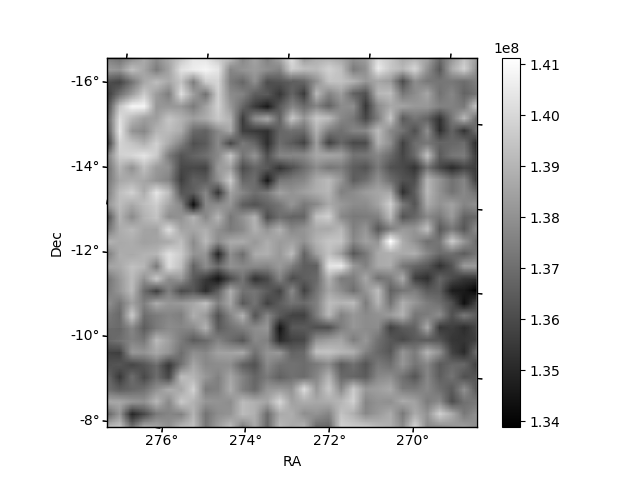
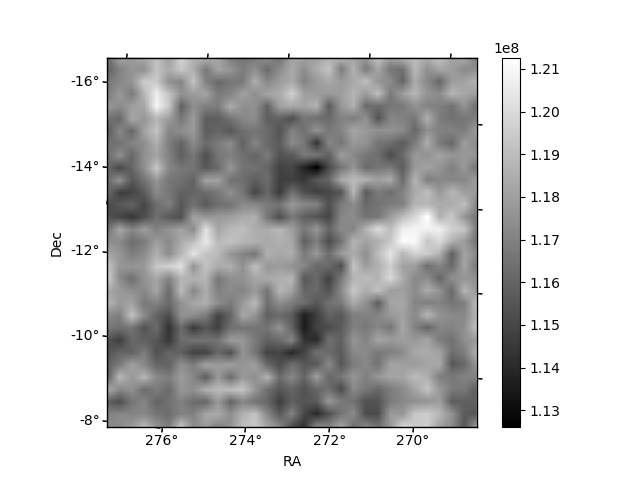
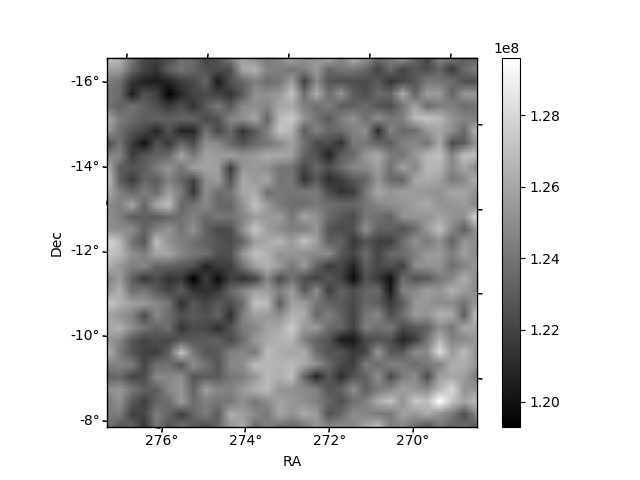
Histogram calculated using DETX and DETY for each event in the final _common_clean file
| Quadrant A | 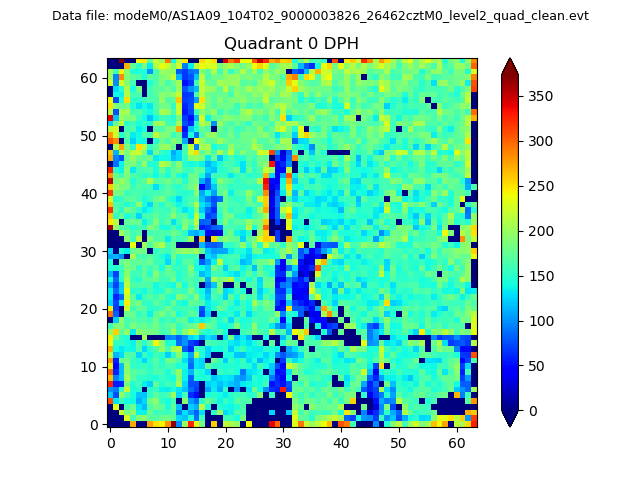 |
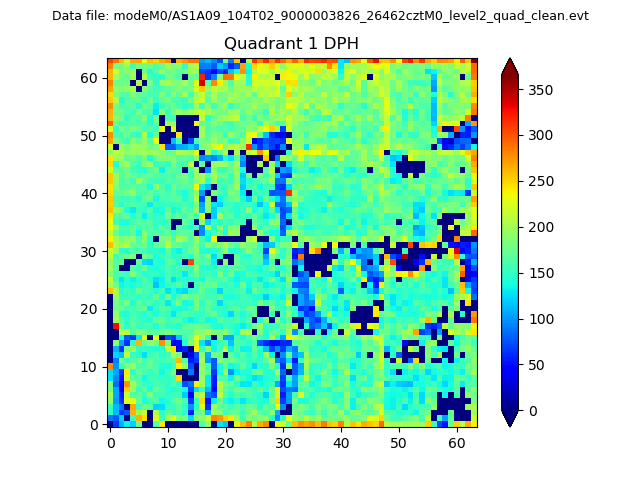 |
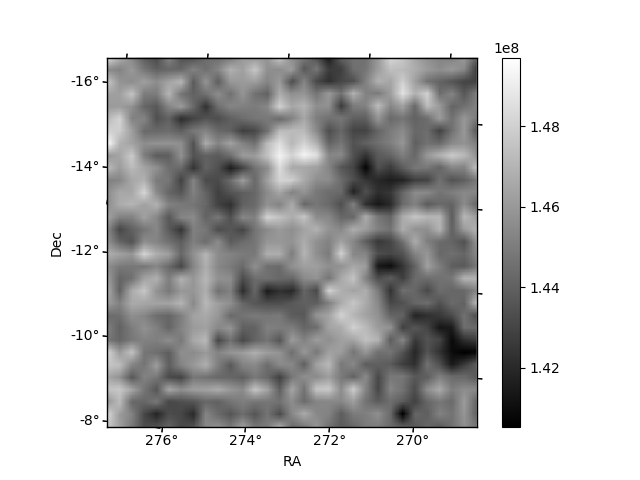
Quadrant B |
|---|---|---|---|
| Quadrant D | 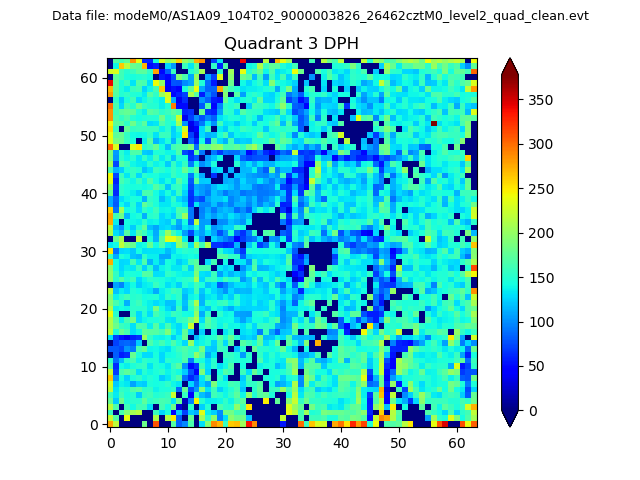 |
 |
Quadrant C |
| Plot type | Count rate plots | Images |
|---|---|---|
| Comparison with Poisson distribution Blue bars denote a histogram of data divided into 1 sec bins. Red curve is a Poisson curve with rate = median count rate of data. |
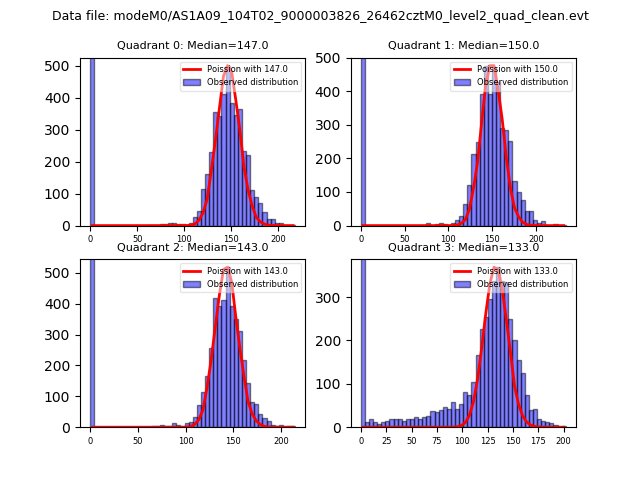 |
 |
| Quadrant-wise count rates Data is divided into 100 sec bins |
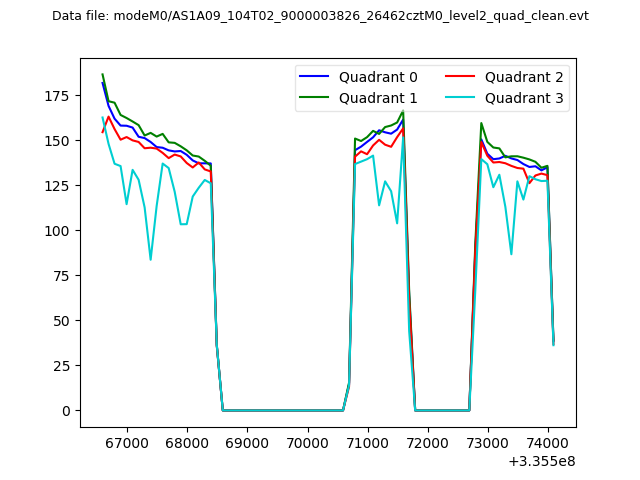 |
|
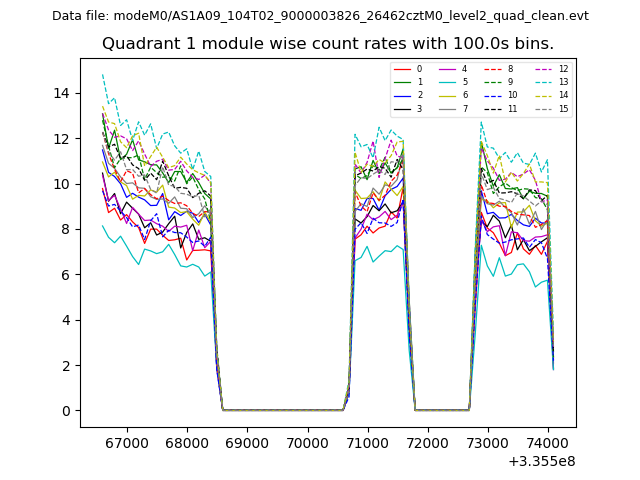
| Module-wise count rates for Quadrant A Data is divided into 100 sec bins |
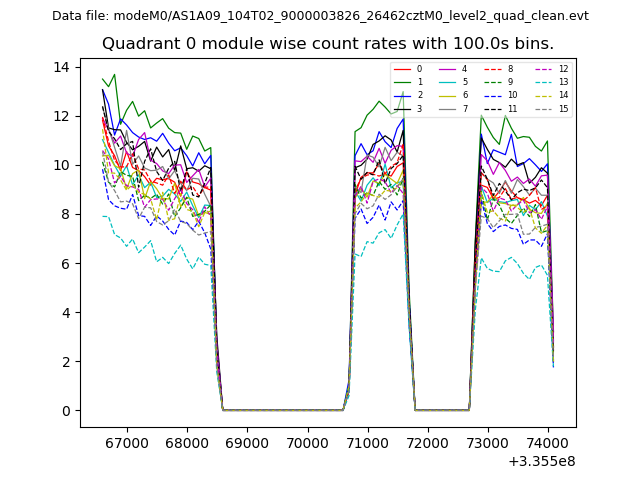 |
 |
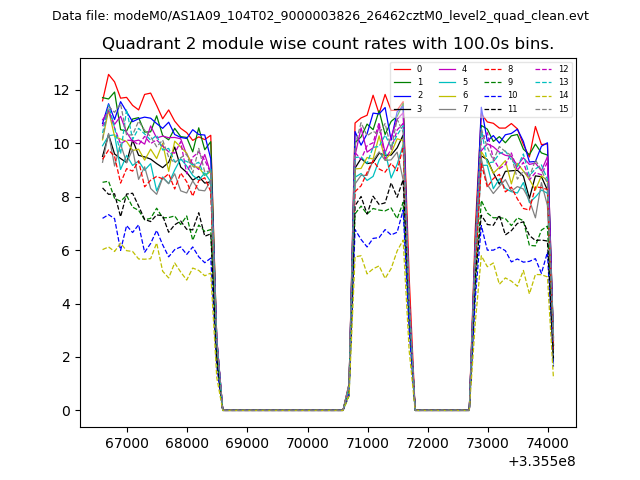
| Module-wise count rates for Quadrant B Data is divided into 100 sec bins |
 |
 |
| Module-wise count rates for Quadrant C Data is divided into 100 sec bins |
 |
 |
| Module-wise count rates for Quadrant D Data is divided into 100 sec bins |
 |
 |
| Parameter | Plot |
|---|---|
| CZT HV Monitor | 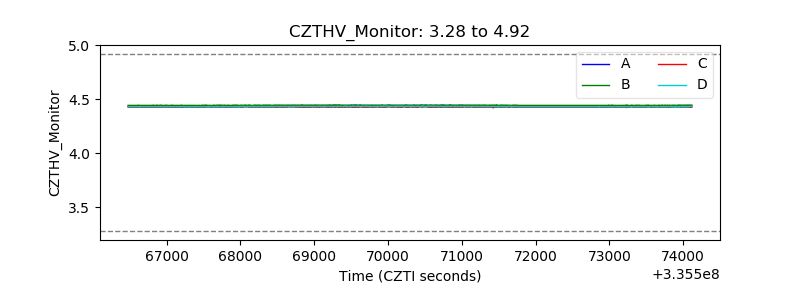 |
| D_VDD | 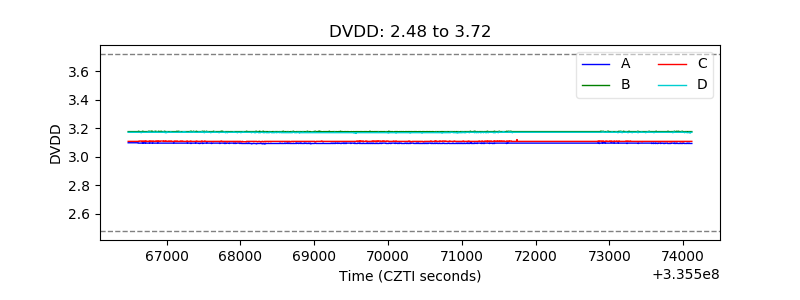 |
| Temperature 1 | 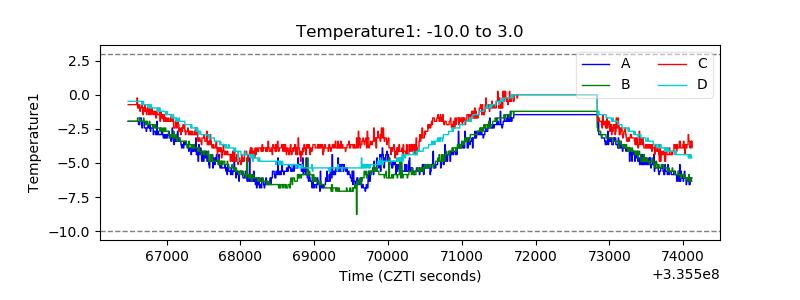 |
| Veto HV Monitor | 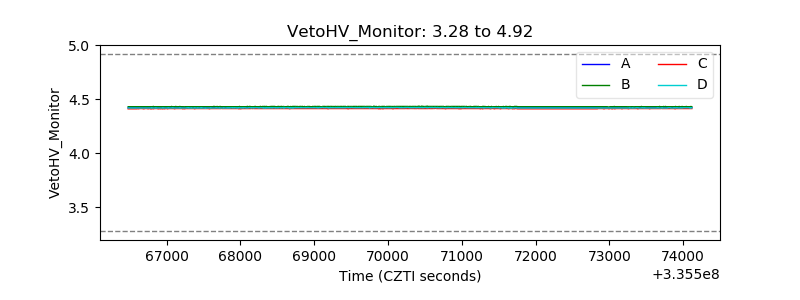 |
| Veto LLD | 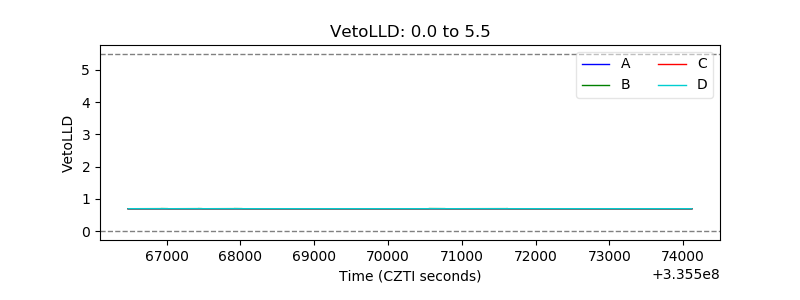 |
| Alpha Counter | 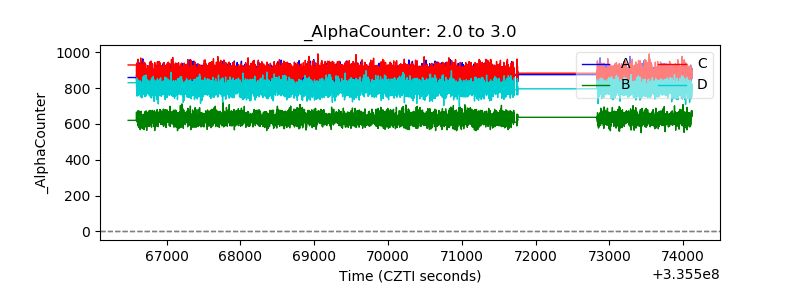 |
| _CPM_Rate | 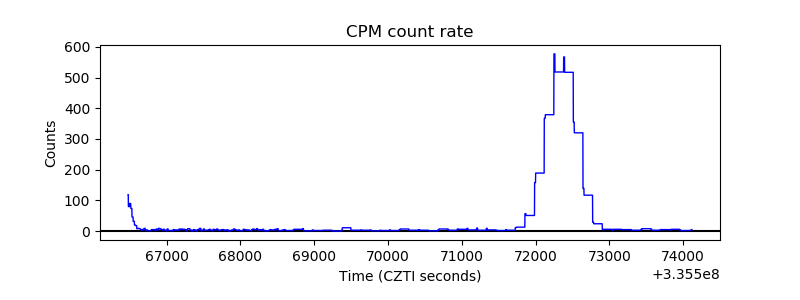 |
| CZT Counter | 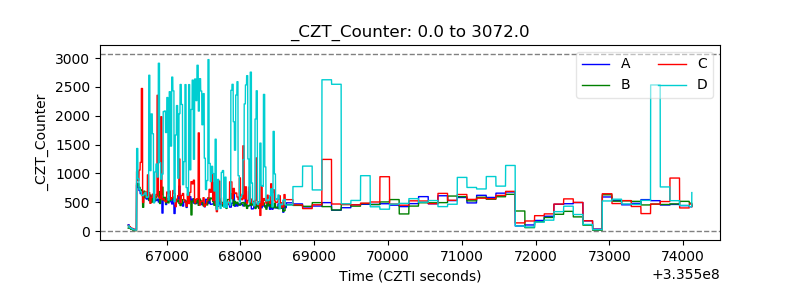 |
| +2.5 Volts monitor | 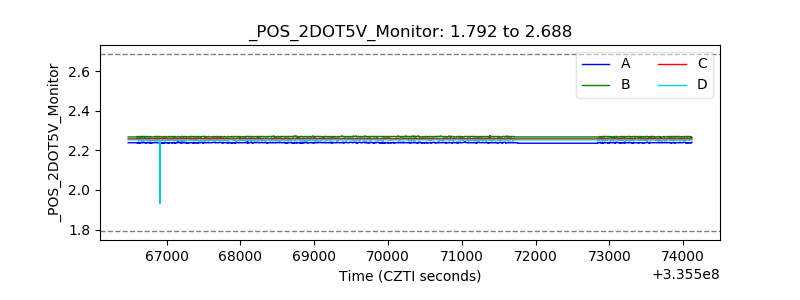 |
| +5 Volts monitor | 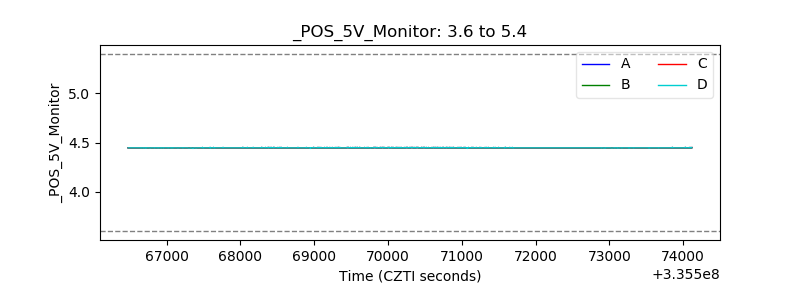 |
| _ROLL_ROT | 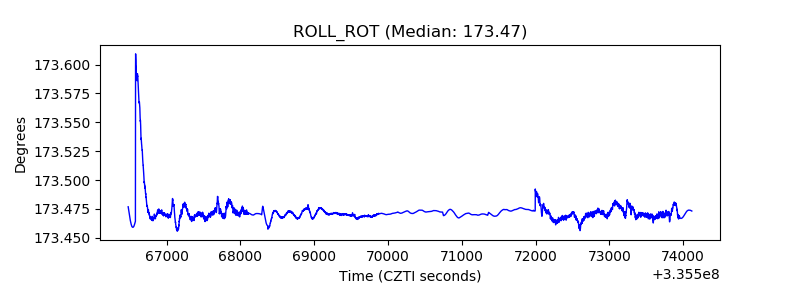 |
| _Roll_DEC | 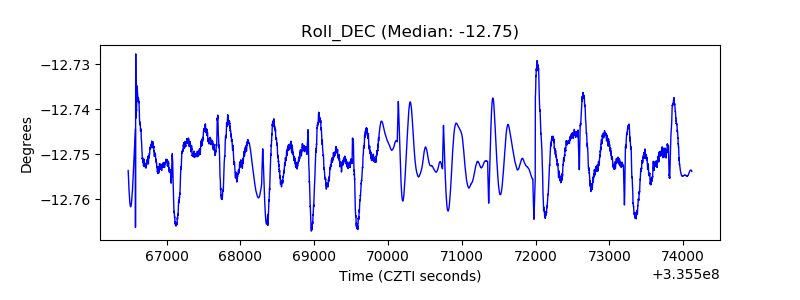 |
| _Roll_RA | 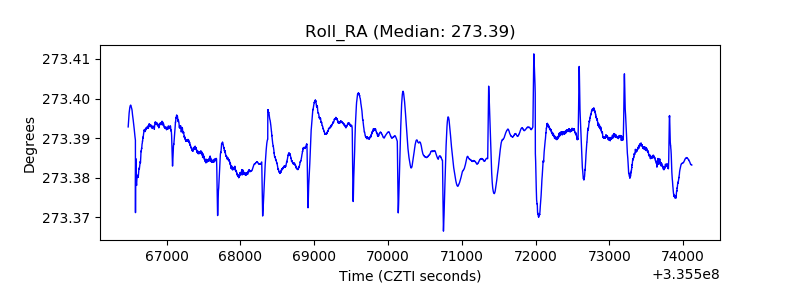 |
| Veto Counter | 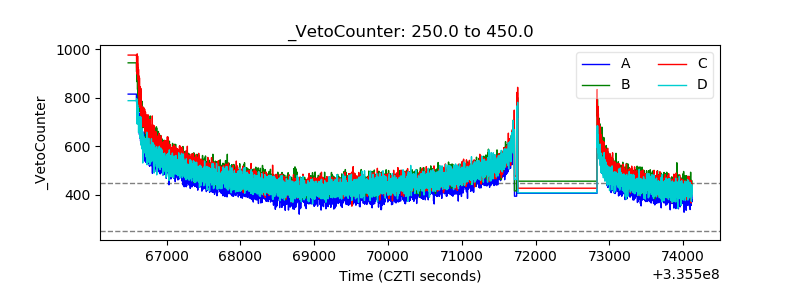 |