| Param | Original file | Final file |
|---|---|---|
| Filename | modeM0/AS1A09_104T02_9000003826_26463cztM0_level2.evt | modeM0/AS1A09_104T02_9000003826_26463cztM0_level2_quad_clean.evt |
| Size (bytes) | 631,062,720 | 93,176,640 |
| Size | 601.8 MB | 88.9 MB |
| Events in quadrant A | 3,295,915 | 610,112 |
| Events in quadrant B | 3,417,769 | 620,438 |
| Events in quadrant C | 3,878,430 | 589,404 |
| Events in quadrant D | 8,052,087 | 520,631 |
| Mode M0 | |||
|---|---|---|---|
| Quadrant | BADHDUFLAG | Total packets | Discarded packets |
| A | 0 | 14132 | 0 |
| B | 0 | 14410 | 0 |
| C | 0 | 15879 | 0 |
| D | 0 | 28692 | 0 |
| Mode M9 | |||
|---|---|---|---|
| Quadrant | BADHDUFLAG | Total packets | Discarded packets |
| A | 0 | 12 | 0 |
| B | 0 | 13 | 0 |
| C | 0 | 13 | 0 |
| D | 0 | 13 | 0 |
| Quadrant | Total seconds | Saturated seconds | Saturation percentage |
|---|---|---|---|
| A | 6902 | 15 | 0.217328% |
| B | 6902 | 38 | 0.550565% |
| C | 6901 | 112 | 1.622953% |
| D | 6901 | 1654 | 23.967541% |
Noise dominated data is calculated using 1-second bins in cleaned event files. If a bin has >2000 counts, and if more than 50% of those come from <1% of pixels, then it is considered to be noise-dominated and hence unusable.
| Quadrant | # 1 sec bins | Bins with >0 counts | Bins with >2000 counts | High rate bins dominated by noise | Noise dominated (total time) | Noise dominated (detector-on time) | Marked lightcurve |
|---|---|---|---|---|---|---|---|
| A | 7632 | 6903 | 0 | 0 | 0.00% | 0.00% | 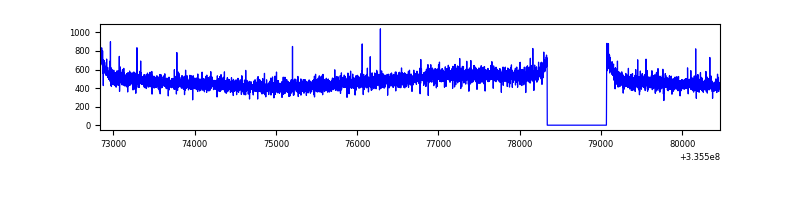 |
| B | 7632 | 6903 | 6 | 6 | 0.08% | 0.09% | 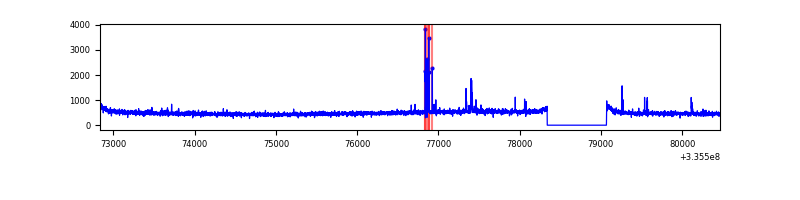 |
| C | 7631 | 6902 | 41 | 41 | 0.54% | 0.59% | 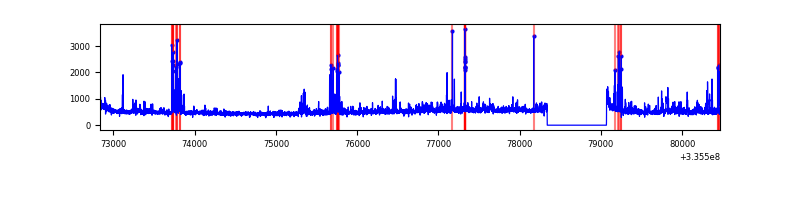 |
| D | 7631 | 6902 | 1542 | 1542 | 20.21% | 22.34% | 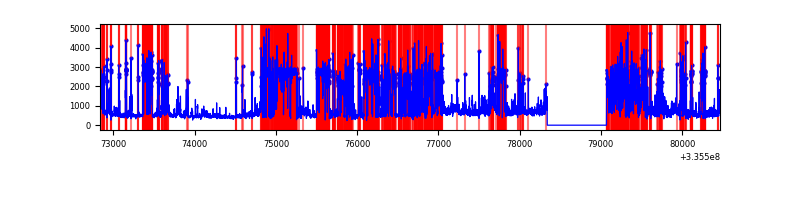 |
Top three noisy pixels from each quadrant. If the there are fewer than three noisy pixels in the level2.evt file, extra rows are filled as -1
| Pixel properties | Quadrant properties | ||||||
|---|---|---|---|---|---|---|---|
| Quadrant | DetID | PixID | Counts | Sigma | Mean | Median | Sigma |
| A | 13 | 254 | 10485 | 55.56 | 853 | 836 | 173.7 |
| A | 3 | 137 | 8061 | 41.6 | 853 | 836 | 173.7 |
| A | 0 | 226 | 7256 | 36.97 | 853 | 836 | 173.7 |
| B | 0 | 230 | 38946 | 231.83 | 852 | 829 | 164.4 |
| B | 0 | 190 | 32531 | 192.81 | 852 | 829 | 164.4 |
| B | 12 | 111 | 19907 | 116.03 | 852 | 829 | 164.4 |
| C | 2 | 16 | 231636 | 1200.78 | 816 | 821 | 192.2 |
| C | 3 | 233 | 226756 | 1175.39 | 816 | 821 | 192.2 |
| C | 14 | 238 | 129598 | 669.94 | 816 | 821 | 192.2 |
| D | 1 | 52 | 4175633 | 23958.36 | 728 | 712 | 174.3 |
| D | 12 | 233 | 712836 | 4086.62 | 728 | 712 | 174.3 |
| D | 7 | 80 | 357183 | 2045.66 | 728 | 712 | 174.3 |
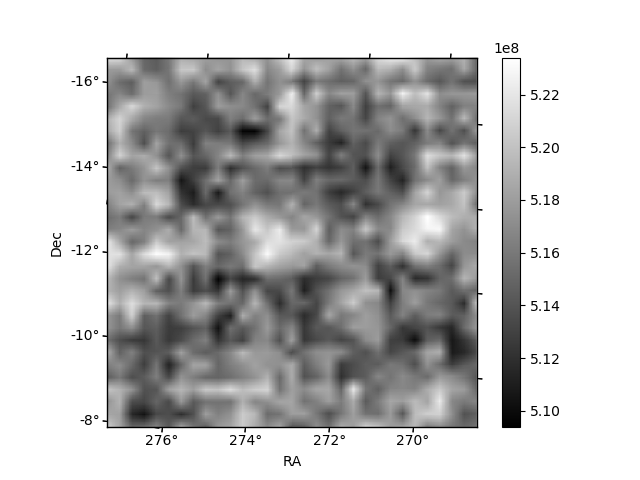
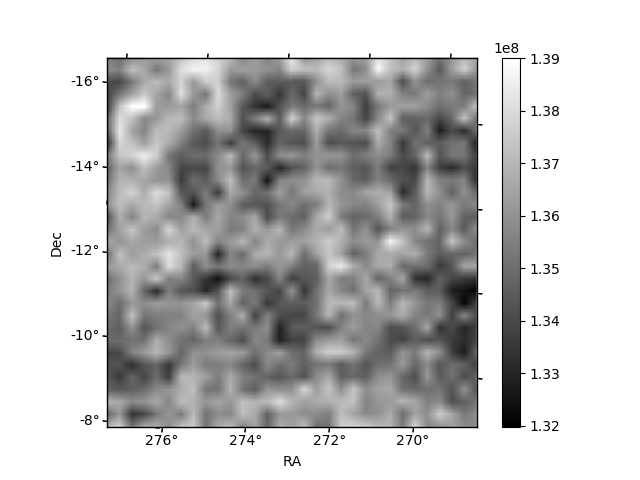
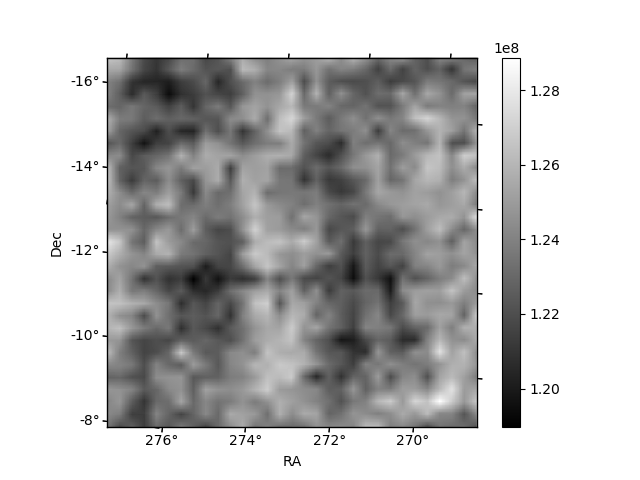
Histogram calculated using DETX and DETY for each event in the final _common_clean file
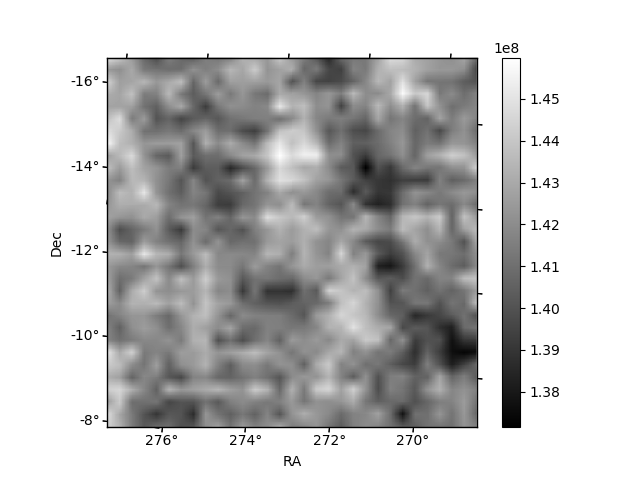
| Quadrant A | 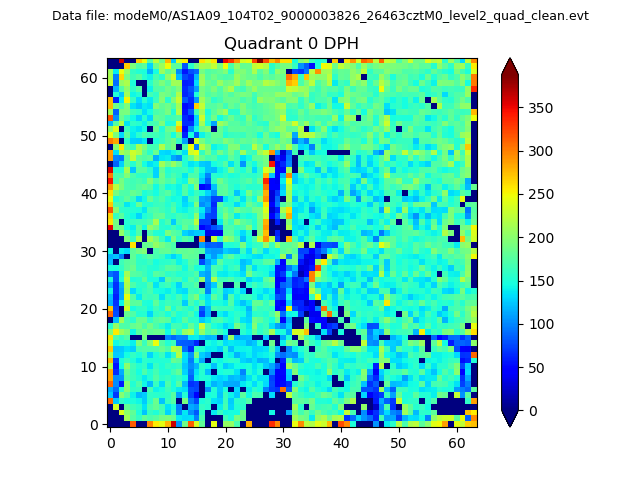 |
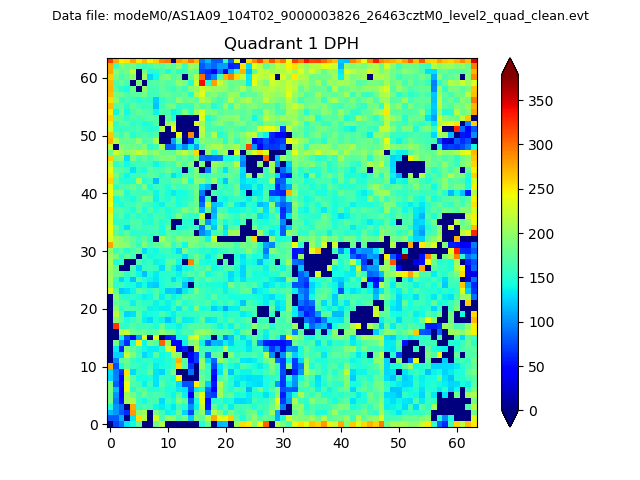 |
Quadrant B |
|---|---|---|---|
| Quadrant D | 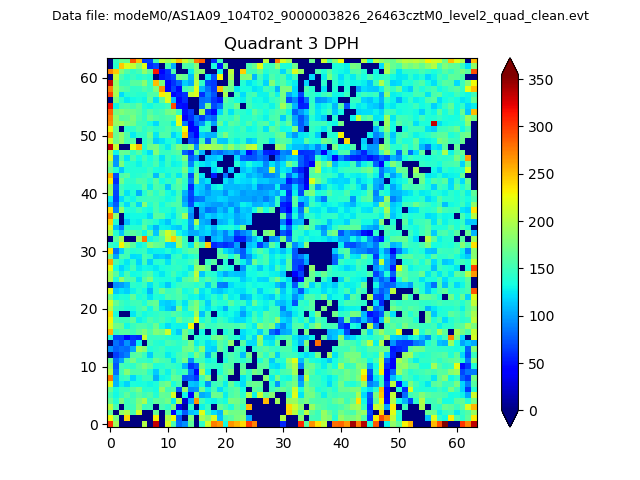 |
 |
Quadrant C |
| Plot type | Count rate plots | Images |
|---|---|---|
| Comparison with Poisson distribution Blue bars denote a histogram of data divided into 1 sec bins. Red curve is a Poisson curve with rate = median count rate of data. |
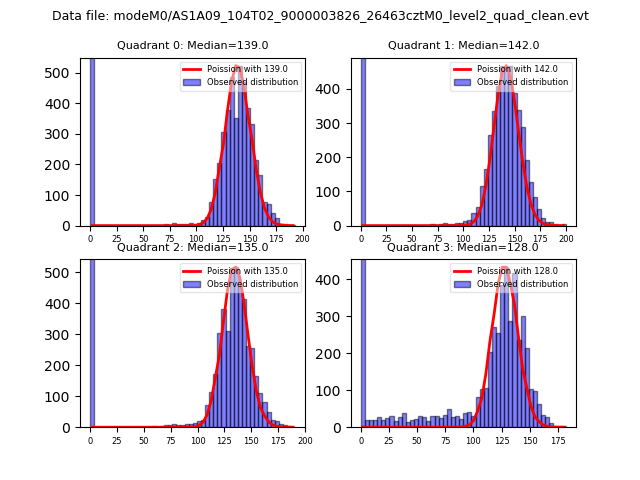 |
 |
| Quadrant-wise count rates Data is divided into 100 sec bins |
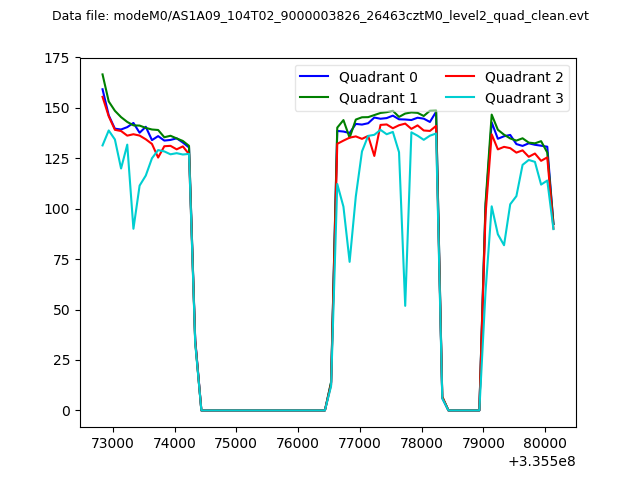 |
|
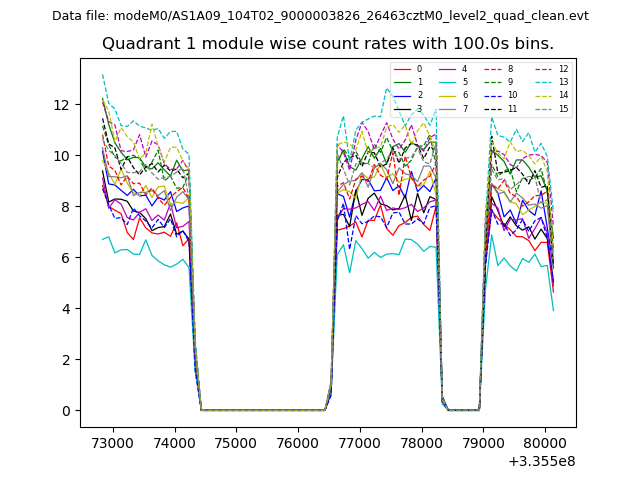
| Module-wise count rates for Quadrant A Data is divided into 100 sec bins |
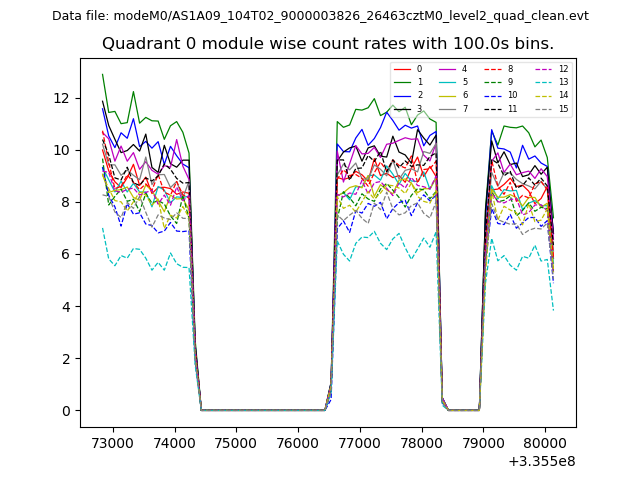 |
 |
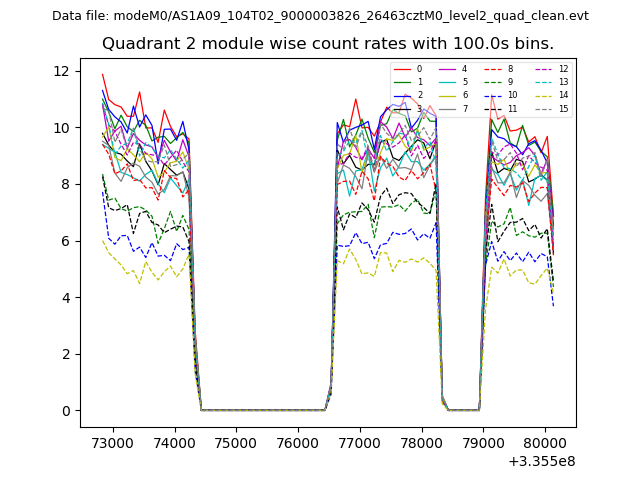
| Module-wise count rates for Quadrant B Data is divided into 100 sec bins |
 |
 |
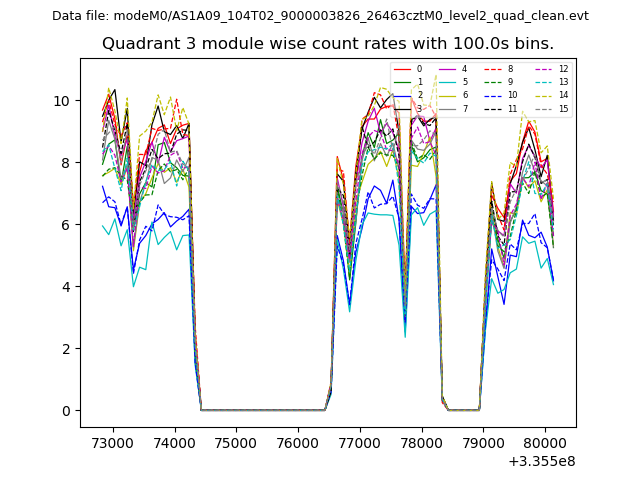
| Module-wise count rates for Quadrant C Data is divided into 100 sec bins |
 |
 |
| Module-wise count rates for Quadrant D Data is divided into 100 sec bins |
 |
 |
| Parameter | Plot |
|---|---|
| CZT HV Monitor | 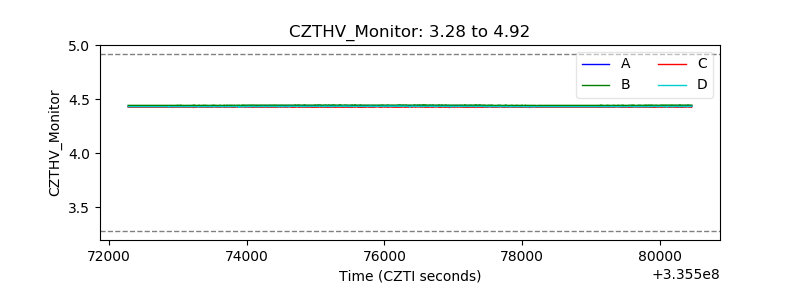 |
| D_VDD | 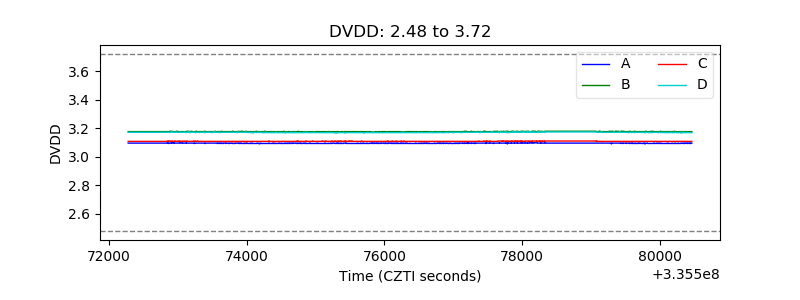 |
| Temperature 1 | 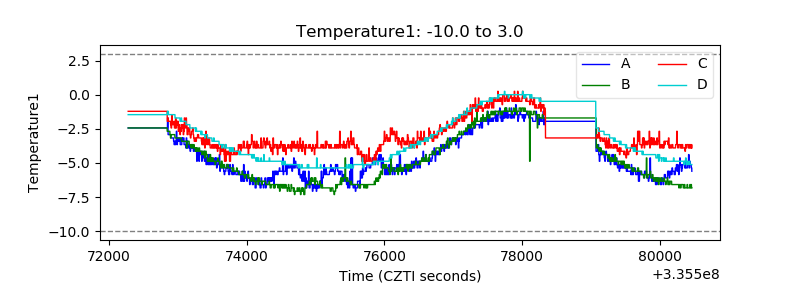 |
| Veto HV Monitor | 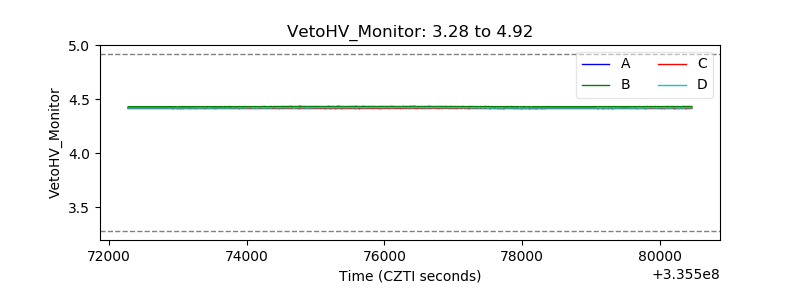 |
| Veto LLD | 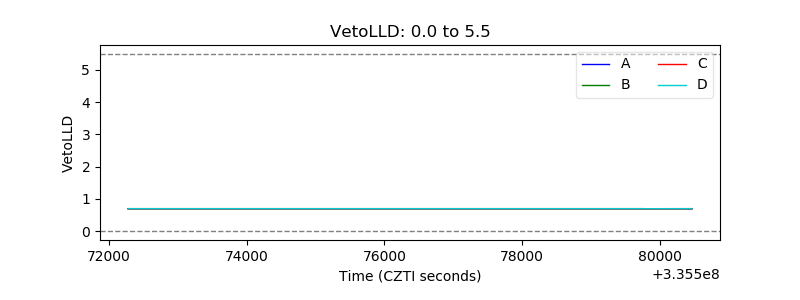 |
| Alpha Counter |  |
| _CPM_Rate | 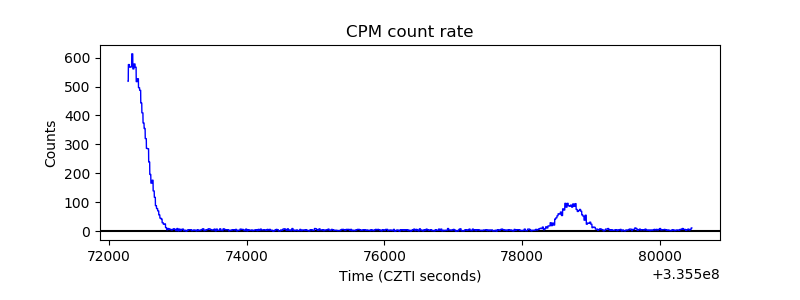 |
| CZT Counter | 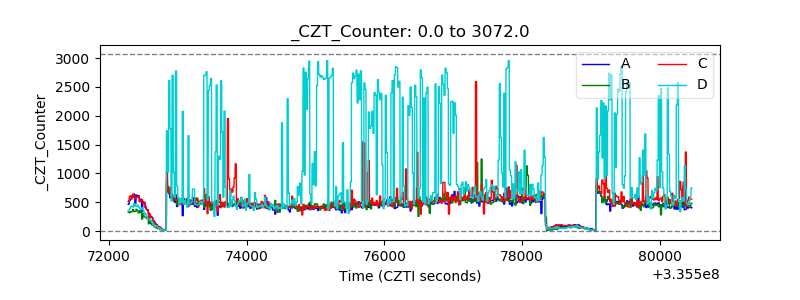 |
| +2.5 Volts monitor |  |
| +5 Volts monitor |  |
| _ROLL_ROT | 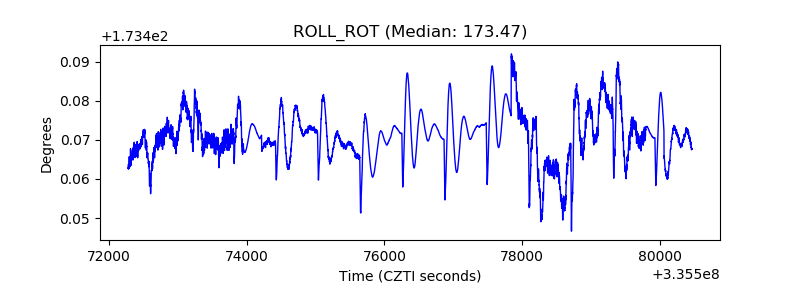 |
| _Roll_DEC | 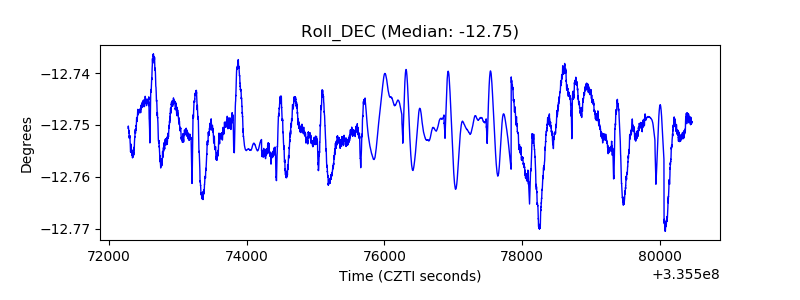 |
| _Roll_RA | 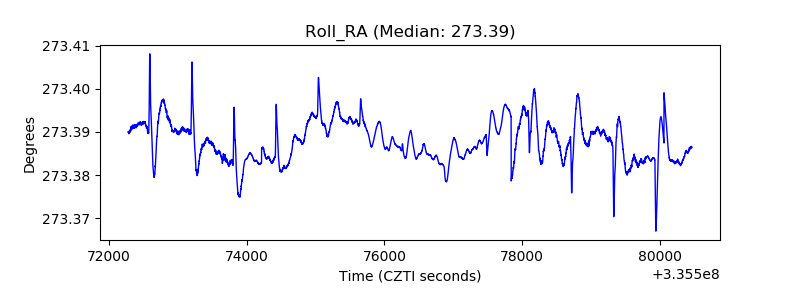 |
| Veto Counter | 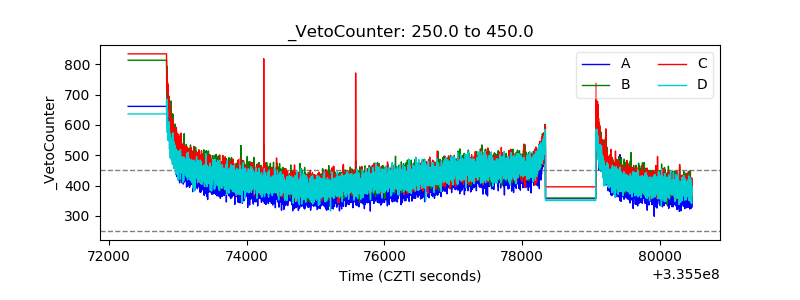 |