| Param | Original file | Final file |
|---|---|---|
| Filename | modeM0/AS1A09_104T02_9000003826_26464cztM0_level2.evt | modeM0/AS1A09_104T02_9000003826_26464cztM0_level2_quad_clean.evt |
| Size (bytes) | 702,077,760 | 95,103,360 |
| Size | 669.6 MB | 90.7 MB |
| Events in quadrant A | 3,643,370 | 627,399 |
| Events in quadrant B | 3,910,399 | 636,236 |
| Events in quadrant C | 4,872,438 | 598,456 |
| Events in quadrant D | 8,320,492 | 487,240 |
| Mode M0 | |||
|---|---|---|---|
| Quadrant | BADHDUFLAG | Total packets | Discarded packets |
| A | 0 | 15734 | 0 |
| B | 0 | 16401 | 0 |
| C | 0 | 19220 | 0 |
| D | 0 | 30024 | 0 |
| Mode M9 | |||
|---|---|---|---|
| Quadrant | BADHDUFLAG | Total packets | Discarded packets |
| A | 0 | 10 | 0 |
| B | 0 | 10 | 0 |
| C | 0 | 10 | 0 |
| D | 0 | 10 | 0 |
| Quadrant | Total seconds | Saturated seconds | Saturation percentage |
|---|---|---|---|
| A | 7616 | 35 | 0.459559% |
| B | 7615 | 96 | 1.260670% |
| C | 7615 | 391 | 5.134603% |
| D | 7616 | 1578 | 20.719538% |
Noise dominated data is calculated using 1-second bins in cleaned event files. If a bin has >2000 counts, and if more than 50% of those come from <1% of pixels, then it is considered to be noise-dominated and hence unusable.
| Quadrant | # 1 sec bins | Bins with >0 counts | Bins with >2000 counts | High rate bins dominated by noise | Noise dominated (total time) | Noise dominated (detector-on time) | Marked lightcurve |
|---|---|---|---|---|---|---|---|
| A | 8651 | 7619 | 0 | 0 | 0.00% | 0.00% | 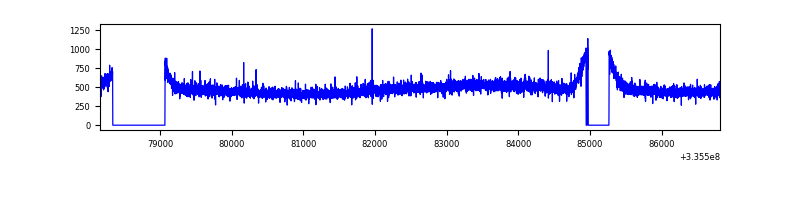 |
| B | 8650 | 7618 | 20 | 20 | 0.23% | 0.26% | 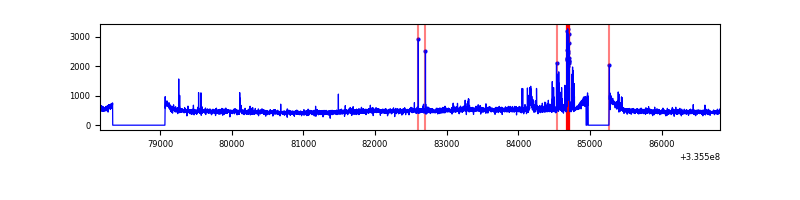 |
| C | 8650 | 7618 | 203 | 203 | 2.35% | 2.66% | 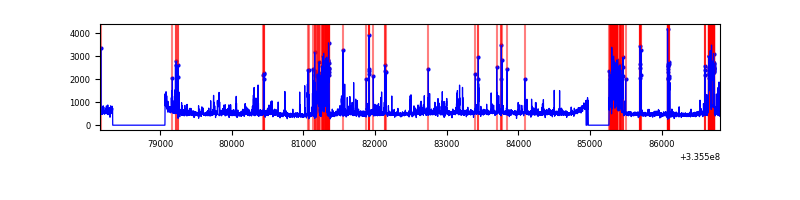 |
| D | 8651 | 7618 | 1332 | 1332 | 15.40% | 17.48% | 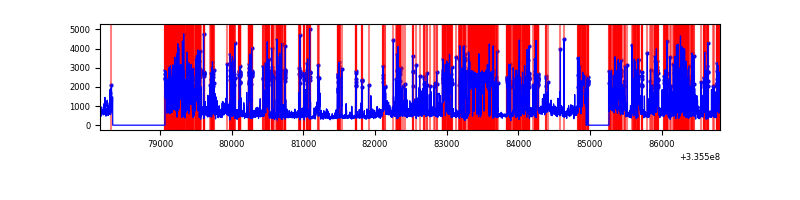 |
Top three noisy pixels from each quadrant. If the there are fewer than three noisy pixels in the level2.evt file, extra rows are filled as -1
| Pixel properties | Quadrant properties | ||||||
|---|---|---|---|---|---|---|---|
| Quadrant | DetID | PixID | Counts | Sigma | Mean | Median | Sigma |
| A | 13 | 254 | 11688 | 55.88 | 944 | 924 | 192.6 |
| A | 3 | 137 | 9157 | 42.74 | 944 | 924 | 192.6 |
| A | 0 | 226 | 8045 | 36.97 | 944 | 924 | 192.6 |
| B | 5 | 172 | 155479 | 847.81 | 942 | 919 | 182.3 |
| B | 0 | 190 | 27631 | 146.52 | 942 | 919 | 182.3 |
| B | 12 | 111 | 22243 | 116.97 | 942 | 919 | 182.3 |
| C | 2 | 16 | 753809 | 3573.52 | 890 | 894 | 210.7 |
| C | 4 | 254 | 288456 | 1364.84 | 890 | 894 | 210.7 |
| C | 3 | 233 | 221177 | 1045.52 | 890 | 894 | 210.7 |
| D | 1 | 52 | 3249937 | 16984.15 | 795 | 778 | 191.3 |
| D | 7 | 80 | 1396983 | 7298.3 | 795 | 778 | 191.3 |
| D | 12 | 233 | 591666 | 3088.72 | 795 | 778 | 191.3 |
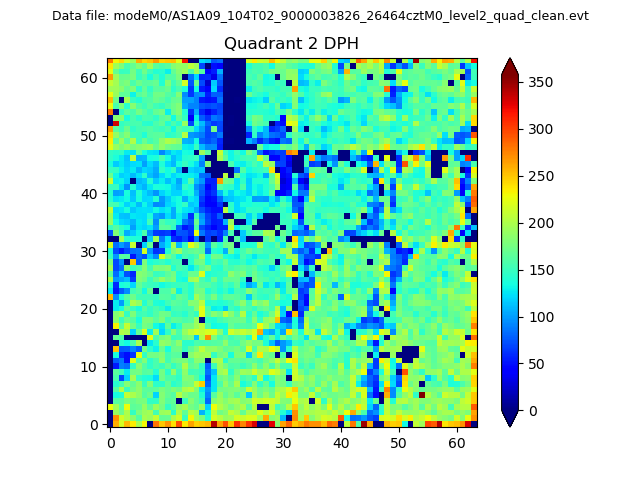
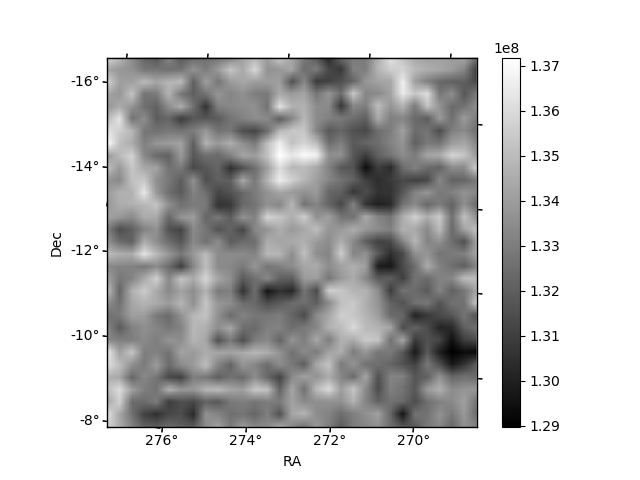
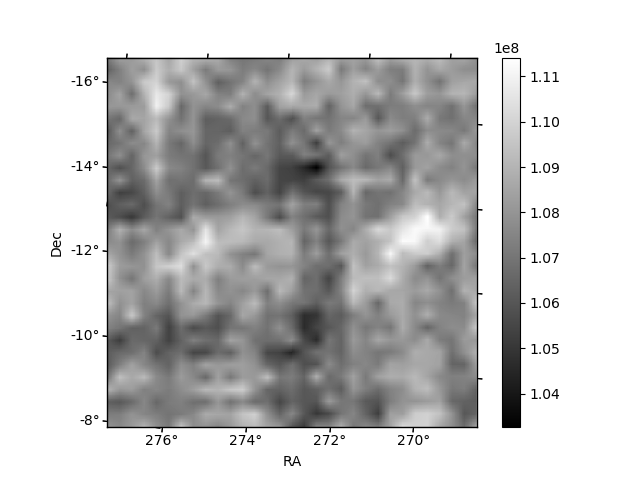
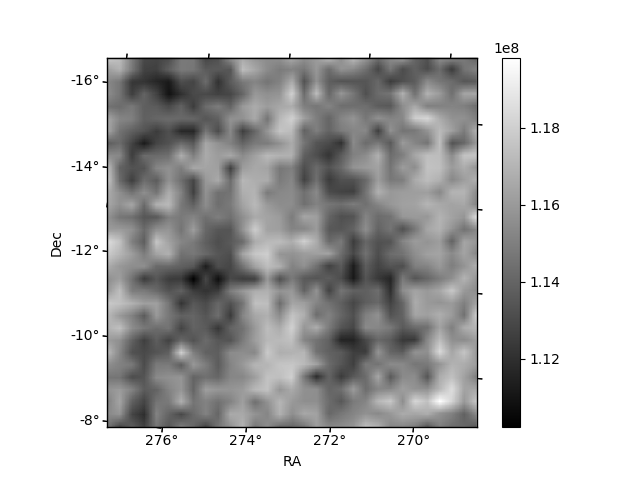
Histogram calculated using DETX and DETY for each event in the final _common_clean file
| Quadrant A | 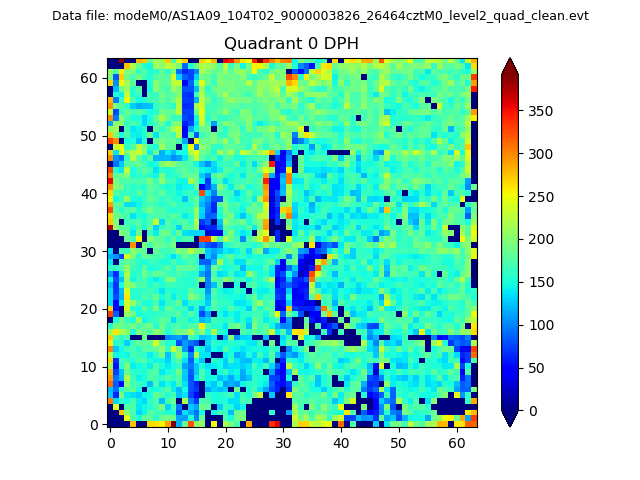 |
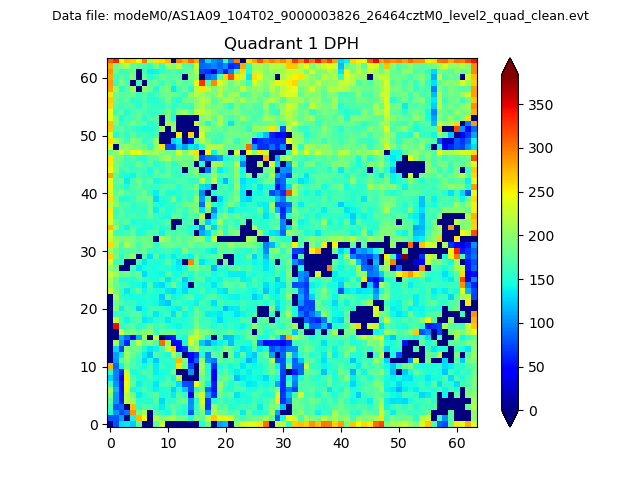 |
Quadrant B |
|---|---|---|---|
| Quadrant D | 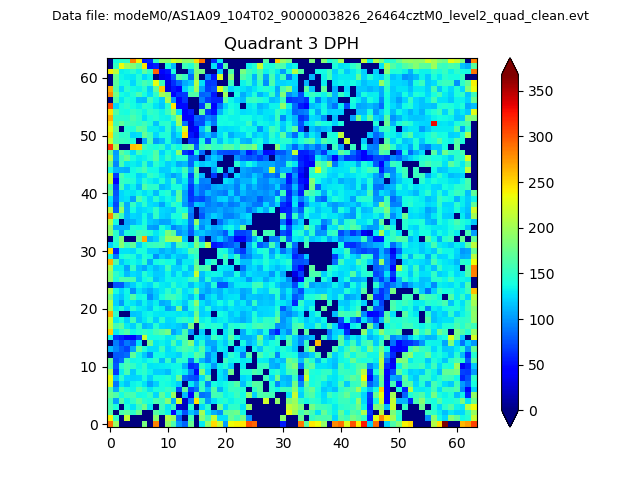 |
 |
Quadrant C |
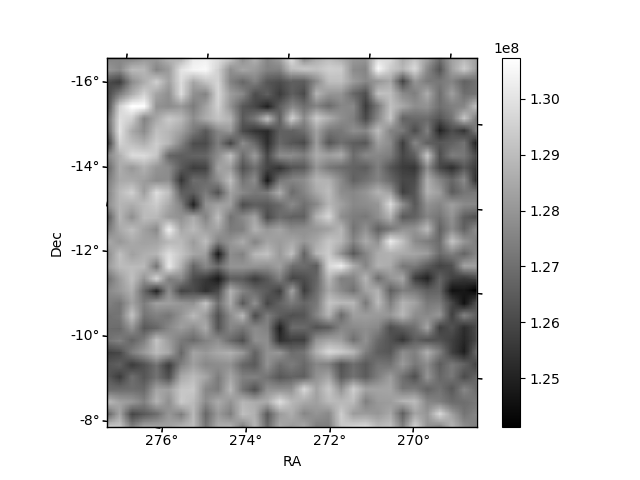
| Plot type | Count rate plots | Images |
|---|---|---|
| Comparison with Poisson distribution Blue bars denote a histogram of data divided into 1 sec bins. Red curve is a Poisson curve with rate = median count rate of data. |
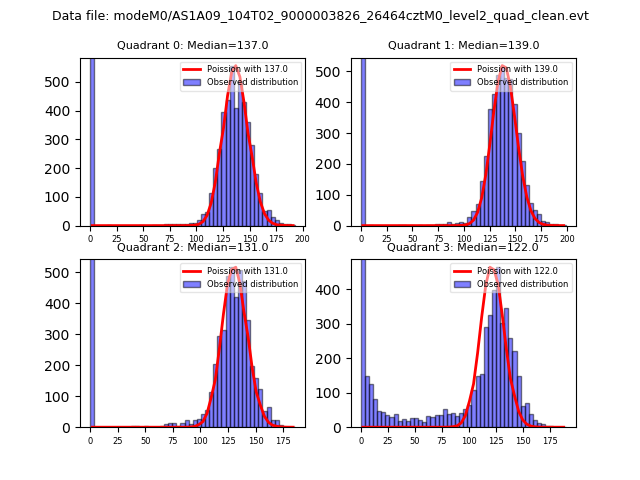 |
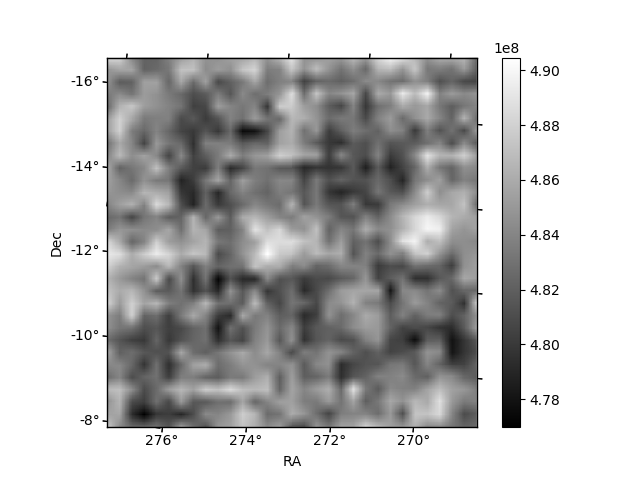 |
| Quadrant-wise count rates Data is divided into 100 sec bins |
 |
|
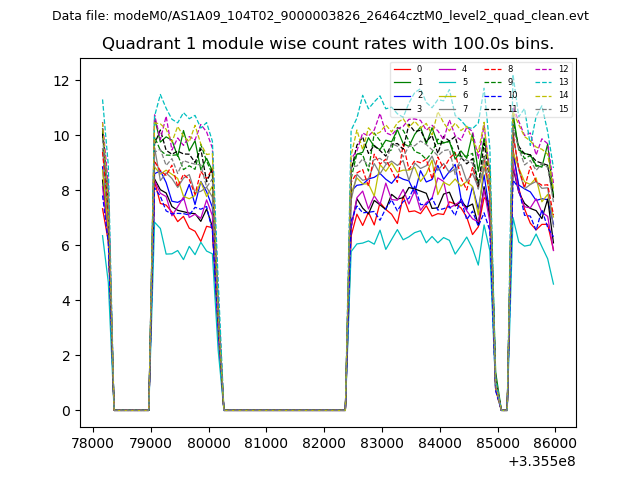
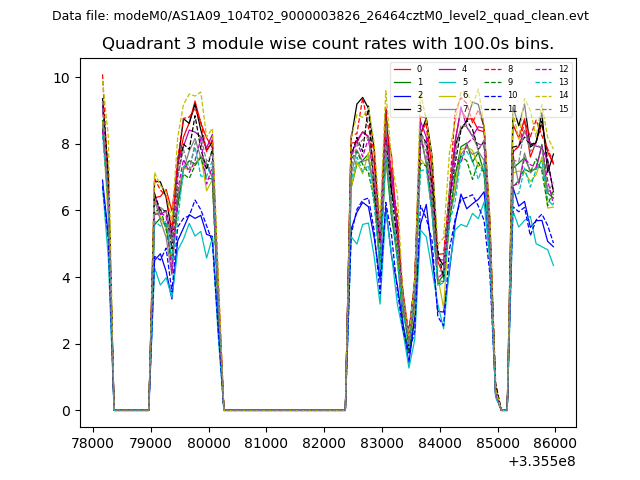
| Module-wise count rates for Quadrant A Data is divided into 100 sec bins |
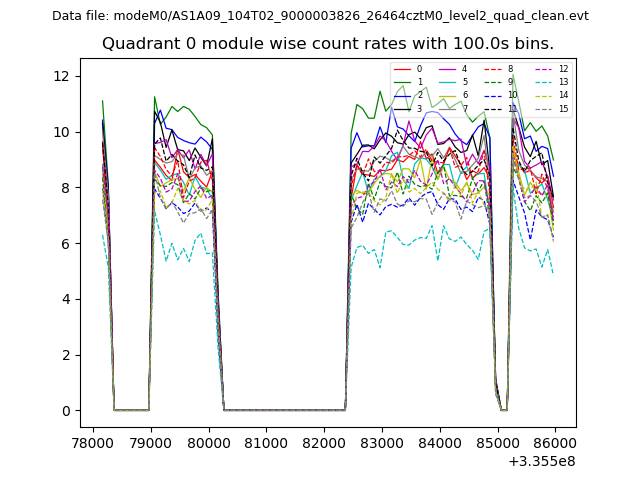 |
 |
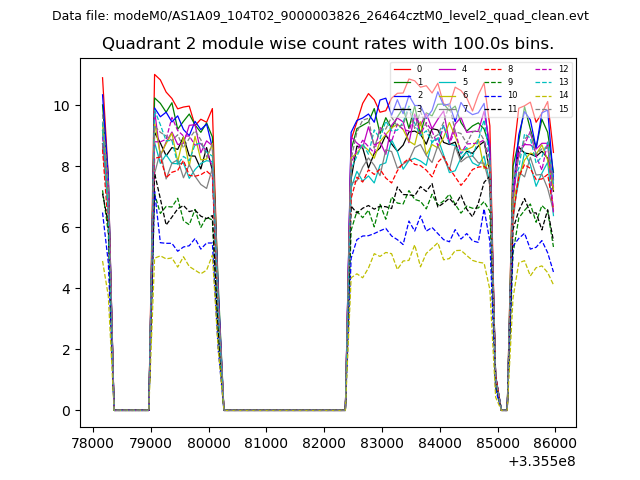
| Module-wise count rates for Quadrant B Data is divided into 100 sec bins |
 |
 |
| Module-wise count rates for Quadrant C Data is divided into 100 sec bins |
 |
 |
| Module-wise count rates for Quadrant D Data is divided into 100 sec bins |
 |
 |
| Parameter | Plot |
|---|---|
| CZT HV Monitor | 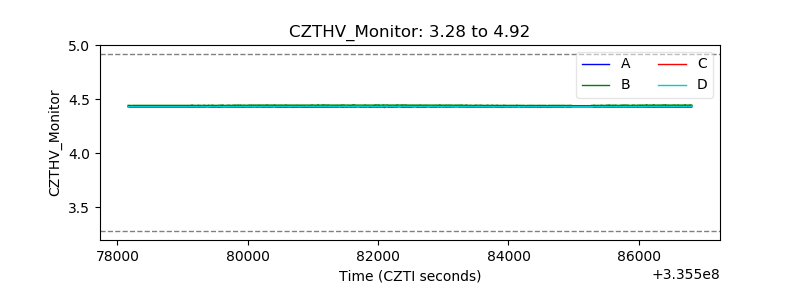 |
| D_VDD |  |
| Temperature 1 | 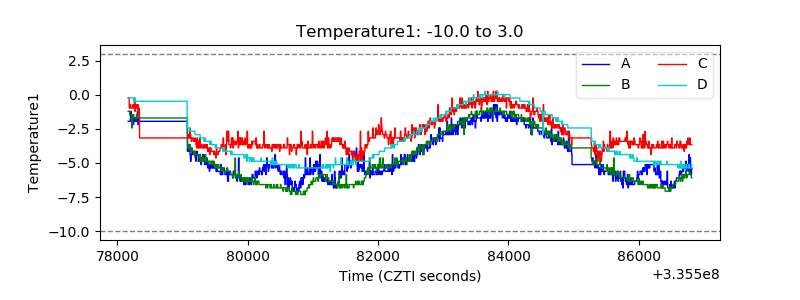 |
| Veto HV Monitor | 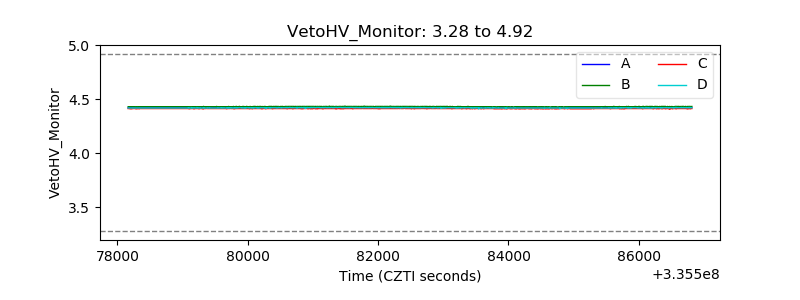 |
| Veto LLD | 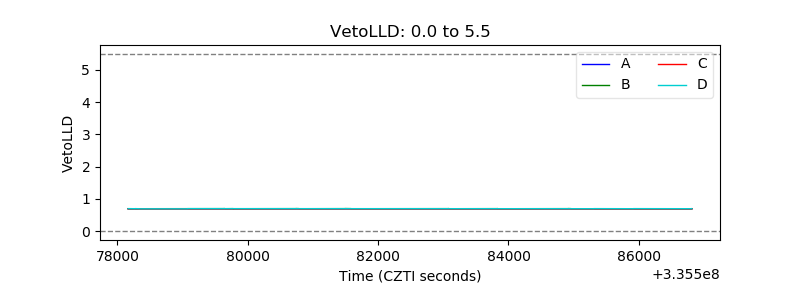 |
| Alpha Counter | 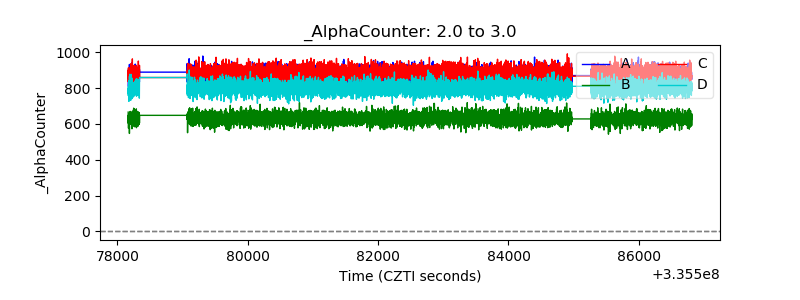 |
| _CPM_Rate | 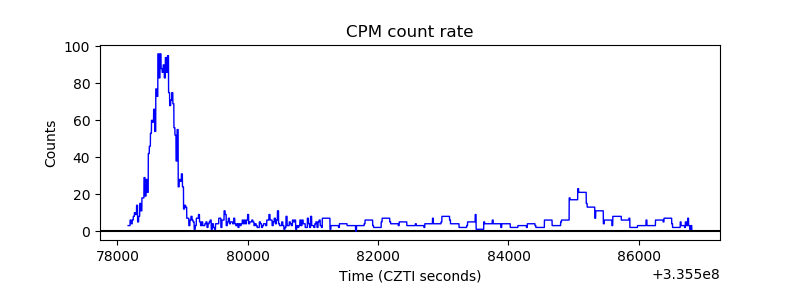 |
| CZT Counter | 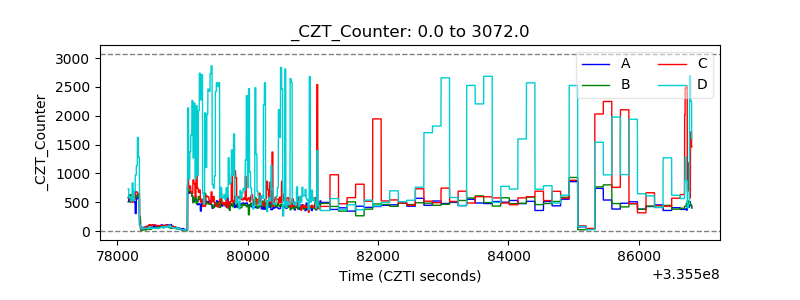 |
| +2.5 Volts monitor | 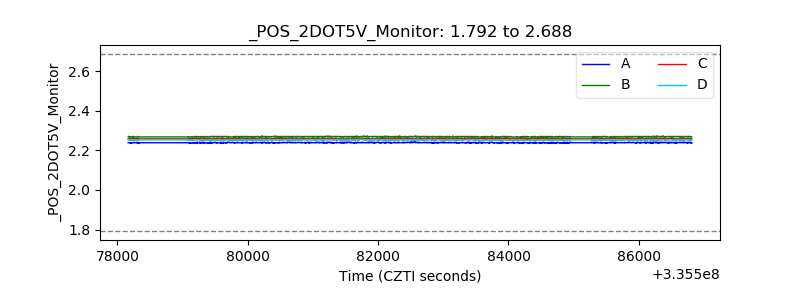 |
| +5 Volts monitor |  |
| _ROLL_ROT | 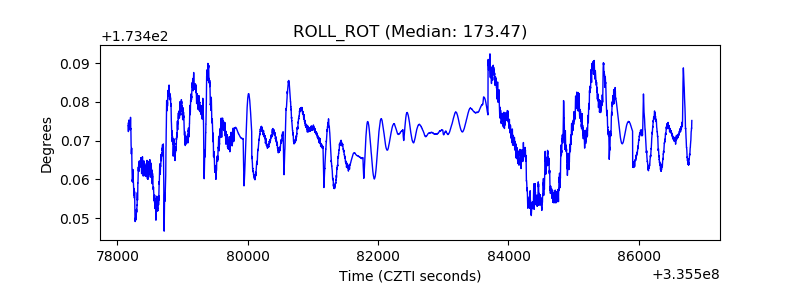 |
| _Roll_DEC | 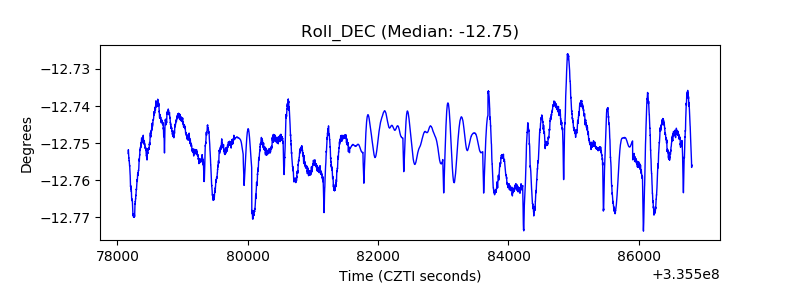 |
| _Roll_RA | 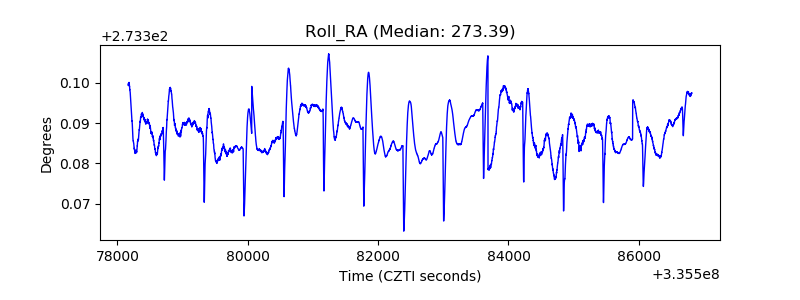 |
| Veto Counter | 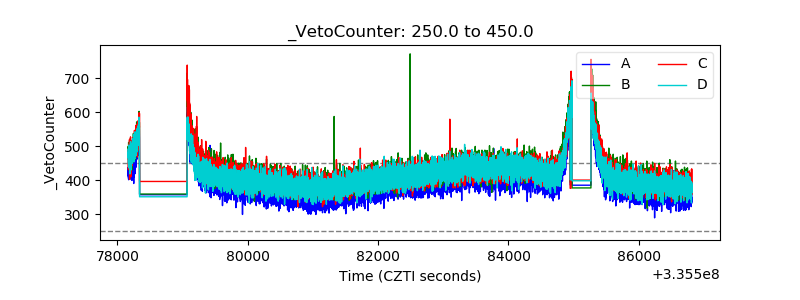 |