| Param | Original file | Final file |
|---|---|---|
| Filename | modeM0/AS1A09_104T02_9000003826_26465cztM0_level2.evt | modeM0/AS1A09_104T02_9000003826_26465cztM0_level2_quad_clean.evt |
| Size (bytes) | 657,334,080 | 79,560,000 |
| Size | 626.9 MB | 75.9 MB |
| Events in quadrant A | 3,542,237 | 504,121 |
| Events in quadrant B | 3,566,303 | 512,004 |
| Events in quadrant C | 4,599,096 | 483,932 |
| Events in quadrant D | 7,708,351 | 403,337 |
| Mode M0 | |||
|---|---|---|---|
| Quadrant | BADHDUFLAG | Total packets | Discarded packets |
| A | 0 | 15289 | 0 |
| B | 0 | 15211 | 0 |
| C | 0 | 18186 | 0 |
| D | 0 | 27800 | 0 |
| Mode M9 | |||
|---|---|---|---|
| Quadrant | BADHDUFLAG | Total packets | Discarded packets |
| A | 0 | 2 | 0 |
| B | 0 | 2 | 0 |
| C | 0 | 2 | 0 |
| D | 0 | 2 | 0 |
| Quadrant | Total seconds | Saturated seconds | Saturation percentage |
|---|---|---|---|
| A | 7250 | 103 | 1.420690% |
| B | 7251 | 135 | 1.861812% |
| C | 7251 | 426 | 5.875052% |
| D | 7251 | 1552 | 21.403944% |
Noise dominated data is calculated using 1-second bins in cleaned event files. If a bin has >2000 counts, and if more than 50% of those come from <1% of pixels, then it is considered to be noise-dominated and hence unusable.
| Quadrant | # 1 sec bins | Bins with >0 counts | Bins with >2000 counts | High rate bins dominated by noise | Noise dominated (total time) | Noise dominated (detector-on time) | Marked lightcurve |
|---|---|---|---|---|---|---|---|
| A | 7455 | 7252 | 4 | 4 | 0.05% | 0.06% | 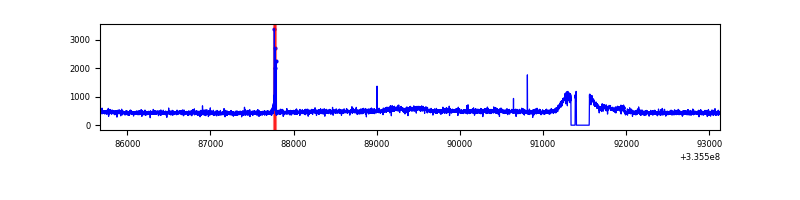 |
| B | 7456 | 7251 | 7 | 7 | 0.09% | 0.10% | 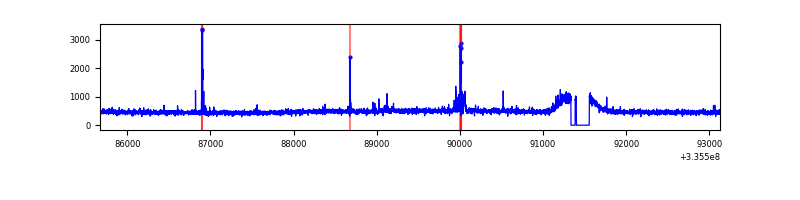 |
| C | 7456 | 7252 | 182 | 182 | 2.44% | 2.51% | 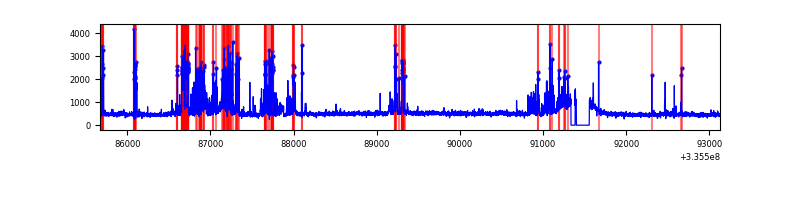 |
| D | 7456 | 7253 | 1354 | 1354 | 18.16% | 18.67% | 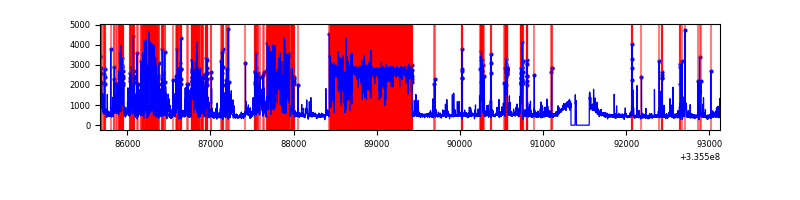 |
Top three noisy pixels from each quadrant. If the there are fewer than three noisy pixels in the level2.evt file, extra rows are filled as -1
| Pixel properties | Quadrant properties | ||||||
|---|---|---|---|---|---|---|---|
| Quadrant | DetID | PixID | Counts | Sigma | Mean | Median | Sigma |
| A | 6 | 16 | 97842 | 534.42 | 890 | 872 | 181.4 |
| A | 12 | 189 | 11928 | 60.93 | 890 | 872 | 181.4 |
| A | 13 | 254 | 11875 | 60.64 | 890 | 872 | 181.4 |
| B | 5 | 172 | 38560 | 220.38 | 886 | 864 | 171.0 |
| B | 0 | 230 | 23267 | 130.98 | 886 | 864 | 171.0 |
| B | 12 | 111 | 21073 | 118.15 | 886 | 864 | 171.0 |
| C | 2 | 16 | 952714 | 4770.3 | 843 | 850 | 199.5 |
| C | 3 | 233 | 146065 | 727.75 | 843 | 850 | 199.5 |
| C | 14 | 238 | 131571 | 655.11 | 843 | 850 | 199.5 |
| D | 7 | 80 | 2405864 | 12803.78 | 779 | 761 | 187.8 |
| D | 1 | 52 | 2046171 | 10888.92 | 779 | 761 | 187.8 |
| D | 12 | 233 | 211235 | 1120.48 | 779 | 761 | 187.8 |
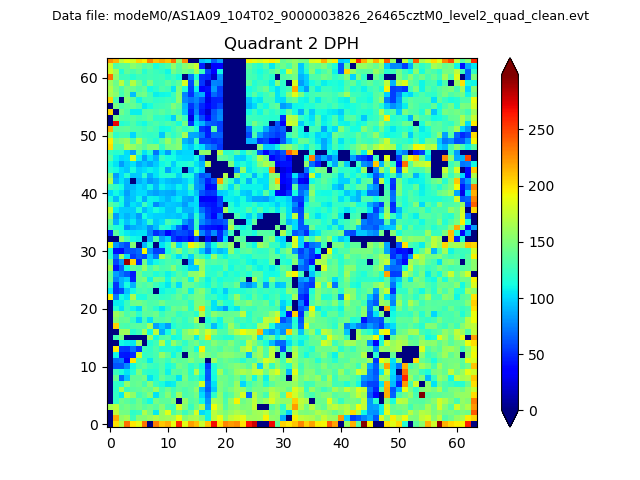
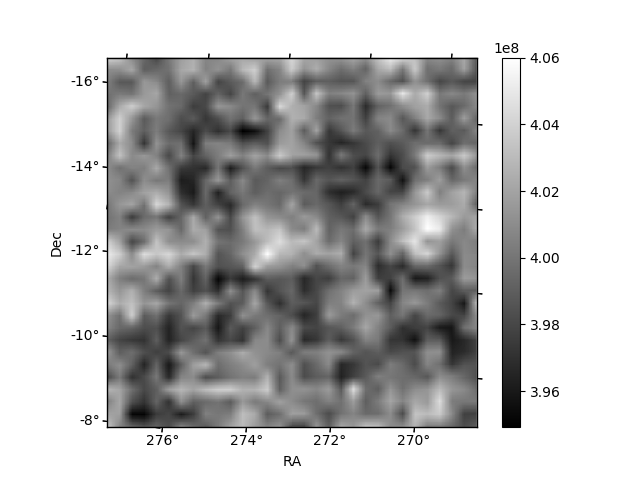
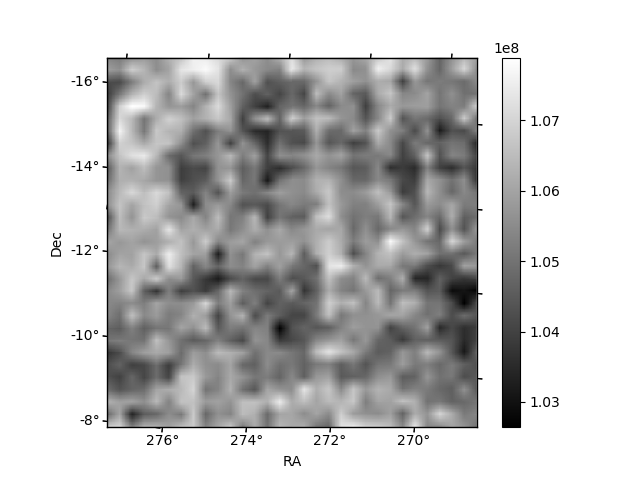
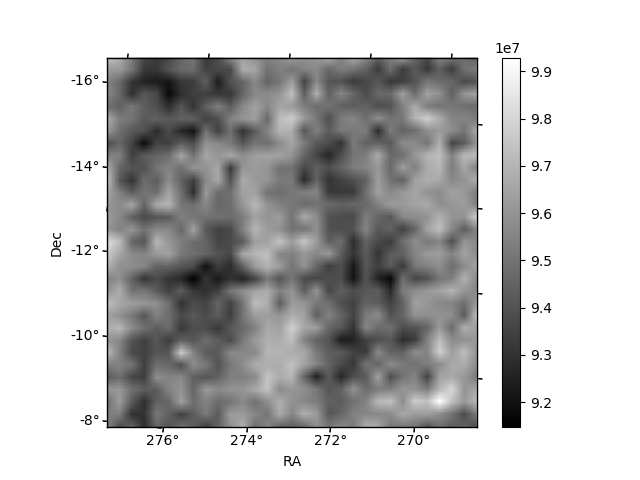
Histogram calculated using DETX and DETY for each event in the final _common_clean file
| Quadrant A | 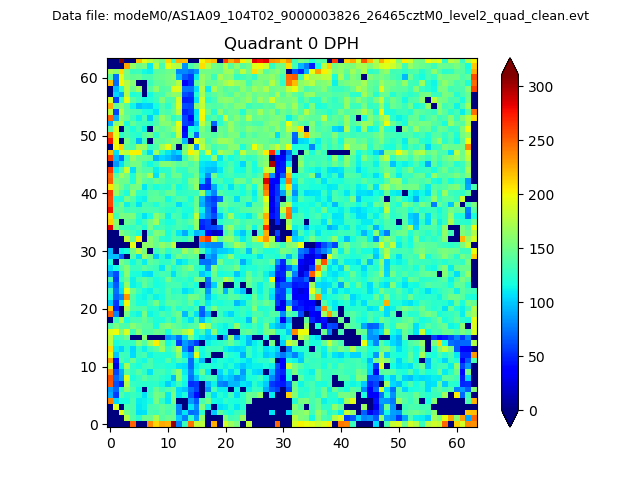 |
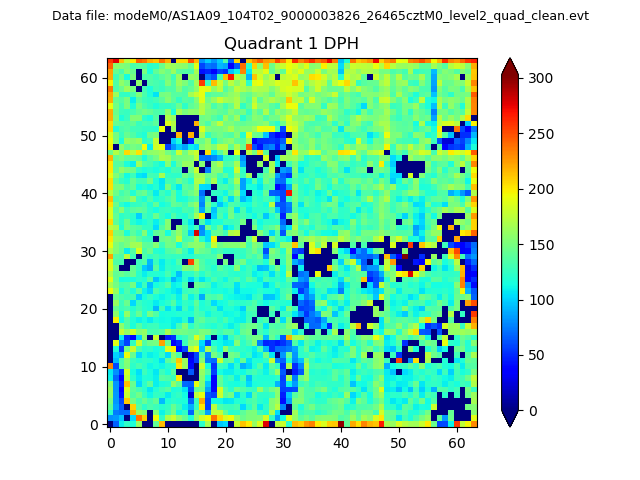 |
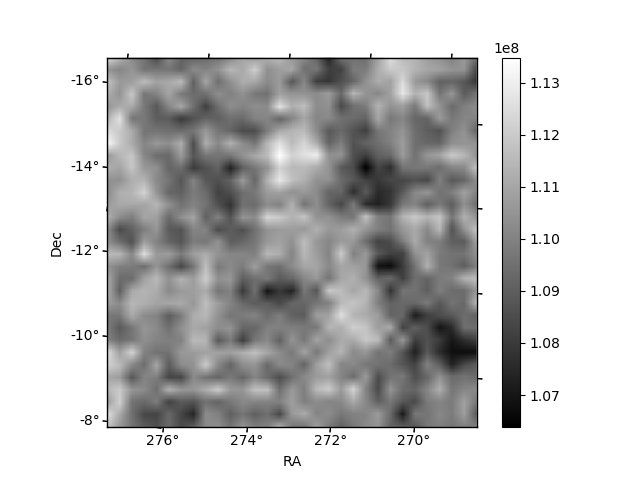
Quadrant B |
|---|---|---|---|
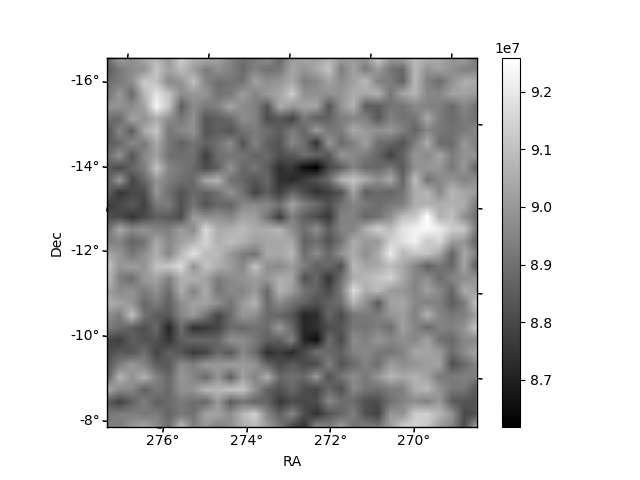
| Quadrant D | 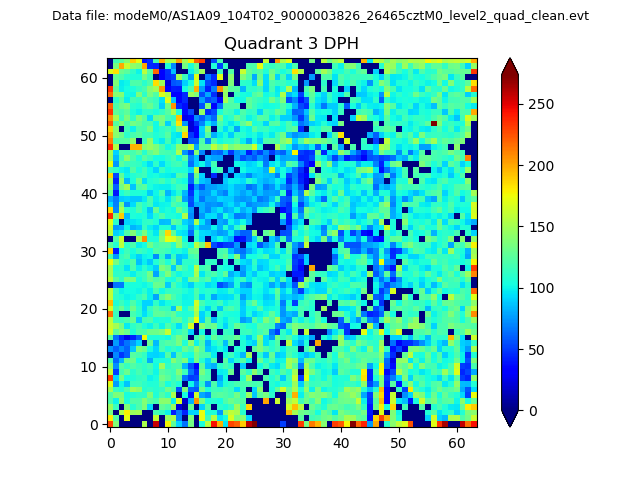 |
 |
Quadrant C |
| Plot type | Count rate plots | Images |
|---|---|---|
| Comparison with Poisson distribution Blue bars denote a histogram of data divided into 1 sec bins. Red curve is a Poisson curve with rate = median count rate of data. |
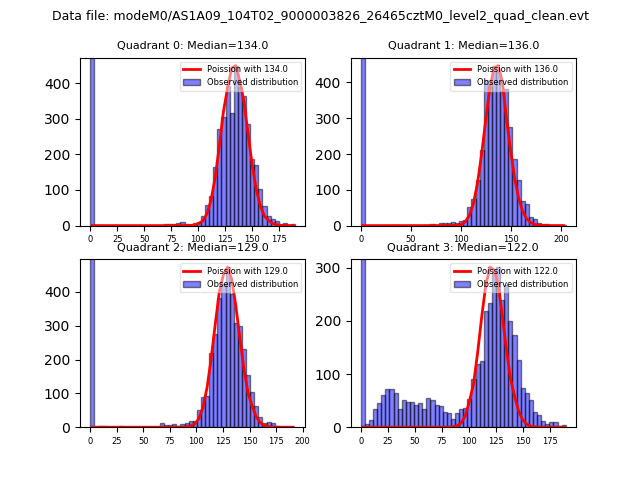 |
 |
| Quadrant-wise count rates Data is divided into 100 sec bins |
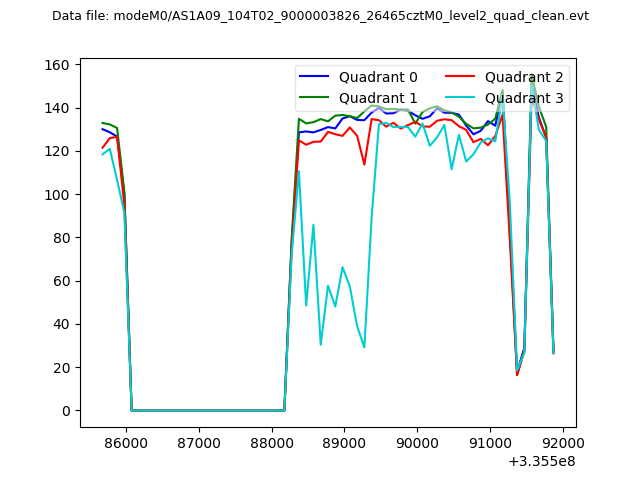 |
|
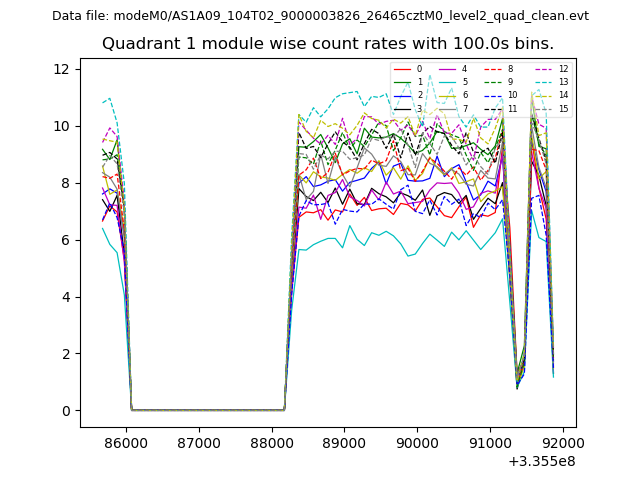
| Module-wise count rates for Quadrant A Data is divided into 100 sec bins |
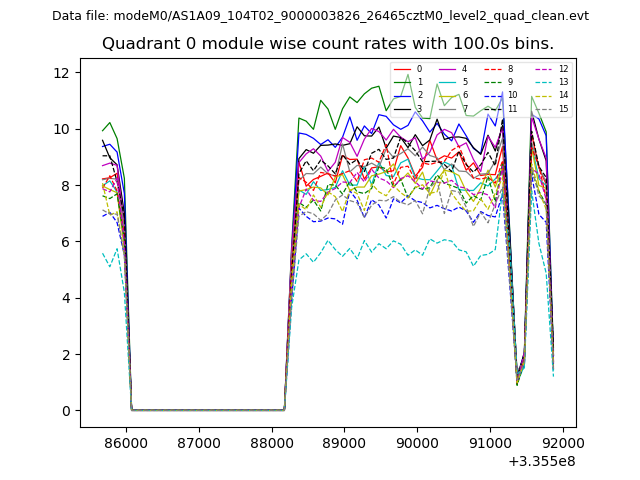 |
 |
| Module-wise count rates for Quadrant B Data is divided into 100 sec bins |
 |
 |
| Module-wise count rates for Quadrant C Data is divided into 100 sec bins |
 |
 |
| Module-wise count rates for Quadrant D Data is divided into 100 sec bins |
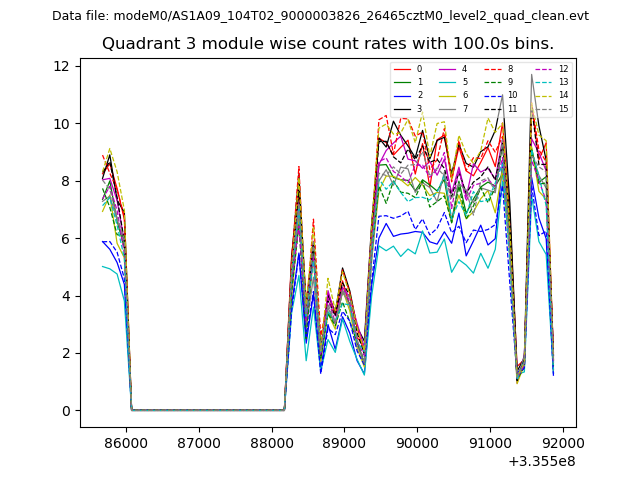 |
 |
| Parameter | Plot |
|---|---|
| CZT HV Monitor |  |
| D_VDD | 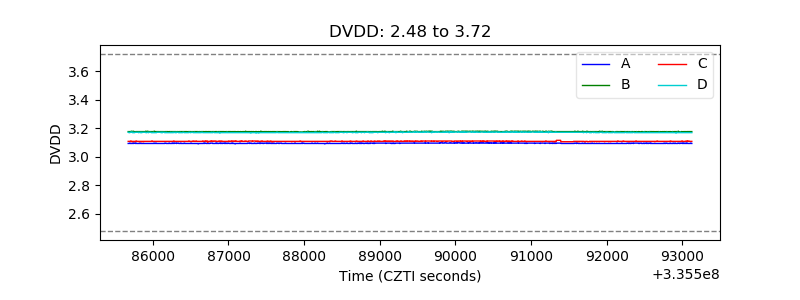 |
| Temperature 1 | 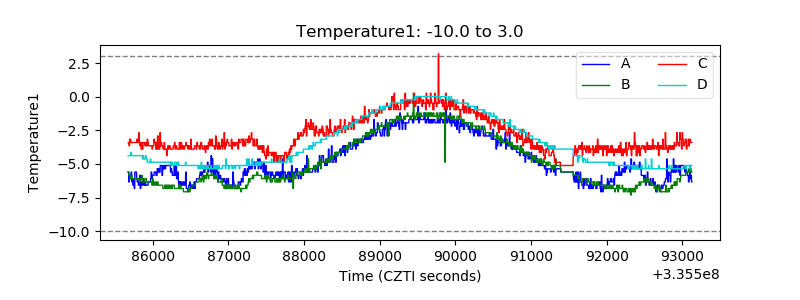 |
| Veto HV Monitor | 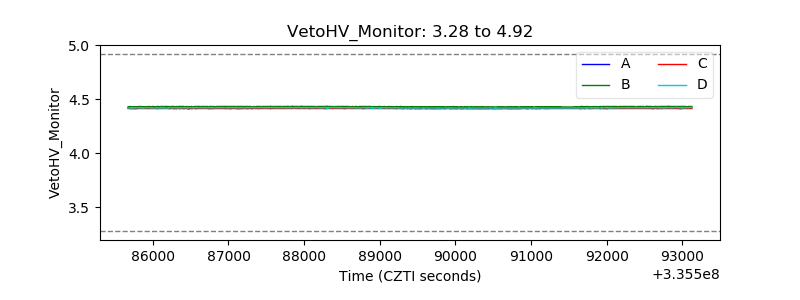 |
| Veto LLD | 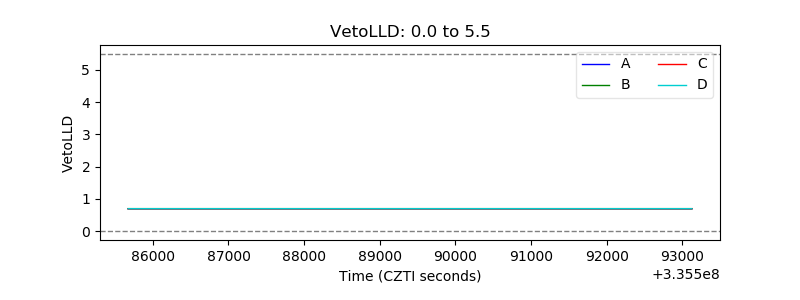 |
| Alpha Counter | 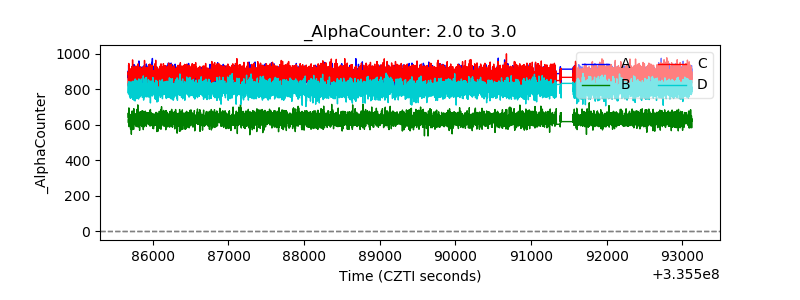 |
| _CPM_Rate | 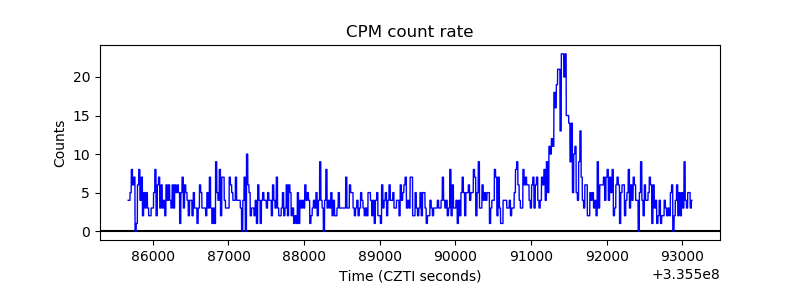 |
| CZT Counter | 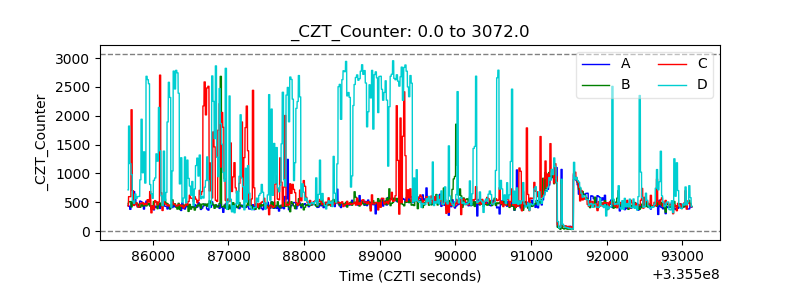 |
| +2.5 Volts monitor |  |
| +5 Volts monitor |  |
| _ROLL_ROT | 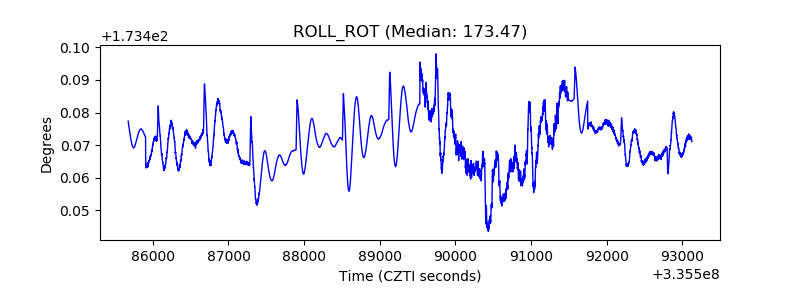 |
| _Roll_DEC | 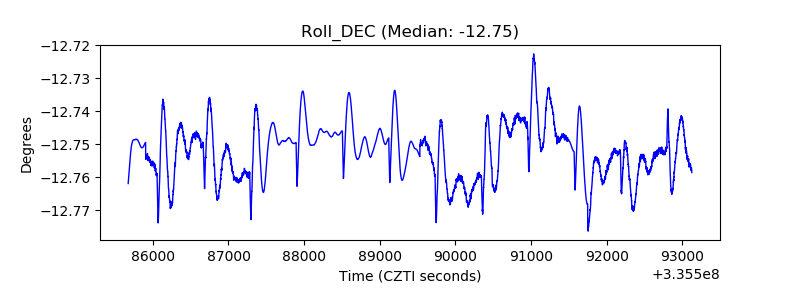 |
| _Roll_RA | 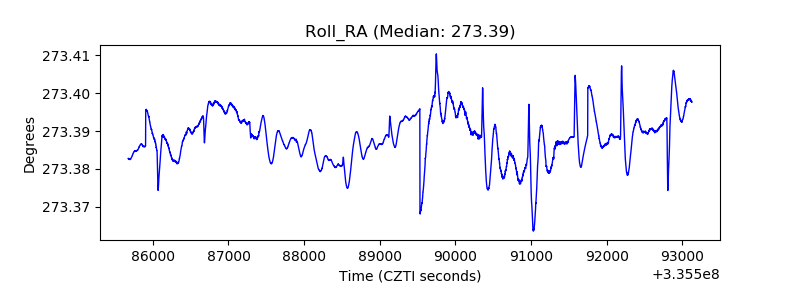 |
| Veto Counter | 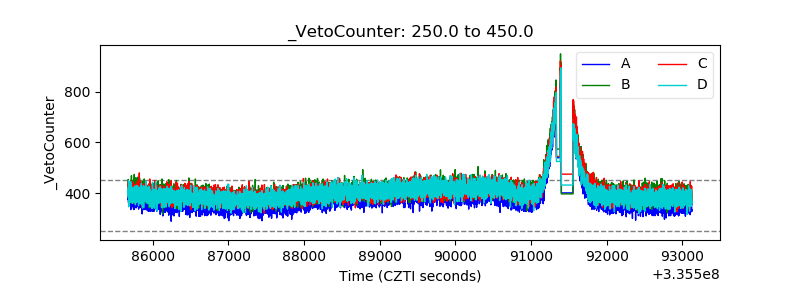 |