| Param | Original file | Final file |
|---|---|---|
| Filename | modeM0/AS1A09_104T02_9000003826_26466cztM0_level2.evt | modeM0/AS1A09_104T02_9000003826_26466cztM0_level2_quad_clean.evt |
| Size (bytes) | 655,004,160 | 89,012,160 |
| Size | 624.7 MB | 84.9 MB |
| Events in quadrant A | 4,003,611 | 555,171 |
| Events in quadrant B | 4,012,408 | 562,986 |
| Events in quadrant C | 4,285,945 | 537,695 |
| Events in quadrant D | 6,988,489 | 478,646 |
| Mode M0 | |||
|---|---|---|---|
| Quadrant | BADHDUFLAG | Total packets | Discarded packets |
| A | 0 | 17246 | 0 |
| B | 0 | 16993 | 0 |
| C | 0 | 17723 | 0 |
| D | 0 | 26167 | 0 |
| Mode M9 | |||
|---|---|---|---|
| Quadrant | BADHDUFLAG | Total packets | Discarded packets |
| A | 0 | 6 | 0 |
| B | 0 | 6 | 0 |
| C | 0 | 6 | 0 |
| D | 0 | 6 | 0 |
| Quadrant | Total seconds | Saturated seconds | Saturation percentage |
|---|---|---|---|
| A | 8057 | 173 | 2.147201% |
| B | 8056 | 222 | 2.755710% |
| C | 8056 | 293 | 3.637041% |
| D | 8057 | 1078 | 13.379670% |
Noise dominated data is calculated using 1-second bins in cleaned event files. If a bin has >2000 counts, and if more than 50% of those come from <1% of pixels, then it is considered to be noise-dominated and hence unusable.
| Quadrant | # 1 sec bins | Bins with >0 counts | Bins with >2000 counts | High rate bins dominated by noise | Noise dominated (total time) | Noise dominated (detector-on time) | Marked lightcurve |
|---|---|---|---|---|---|---|---|
| A | 8667 | 8059 | 2 | 2 | 0.02% | 0.02% |  |
| B | 8666 | 8056 | 5 | 5 | 0.06% | 0.06% |  |
| C | 8666 | 8057 | 26 | 26 | 0.30% | 0.32% |  |
| D | 8667 | 8060 | 826 | 826 | 9.53% | 10.25% | 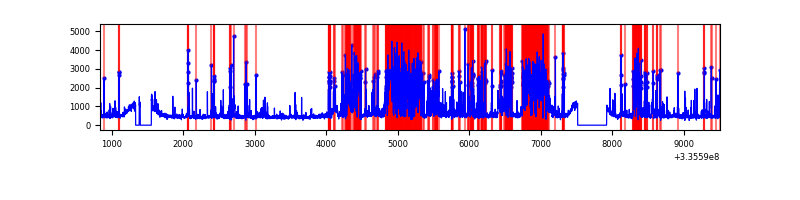 |
Top three noisy pixels from each quadrant. If the there are fewer than three noisy pixels in the level2.evt file, extra rows are filled as -1
| Pixel properties | Quadrant properties | ||||||
|---|---|---|---|---|---|---|---|
| Quadrant | DetID | PixID | Counts | Sigma | Mean | Median | Sigma |
| A | 6 | 16 | 118405 | 573.18 | 1006 | 983 | 204.9 |
| A | 13 | 254 | 13194 | 59.61 | 1006 | 983 | 204.9 |
| A | 3 | 137 | 9553 | 41.83 | 1006 | 983 | 204.9 |
| B | 0 | 244 | 26030 | 127.8 | 1004 | 979 | 196.0 |
| B | 12 | 111 | 24464 | 119.81 | 1004 | 979 | 196.0 |
| B | 0 | 230 | 21918 | 106.83 | 1004 | 979 | 196.0 |
| C | 2 | 16 | 260060 | 1130.85 | 965 | 973 | 229.1 |
| C | 14 | 238 | 150378 | 652.12 | 965 | 973 | 229.1 |
| C | 3 | 233 | 82859 | 357.41 | 965 | 973 | 229.1 |
| D | 7 | 80 | 2740630 | 12207.38 | 928 | 906 | 224.4 |
| D | 1 | 52 | 282539 | 1254.87 | 928 | 906 | 224.4 |
| D | 12 | 233 | 231551 | 1027.68 | 928 | 906 | 224.4 |
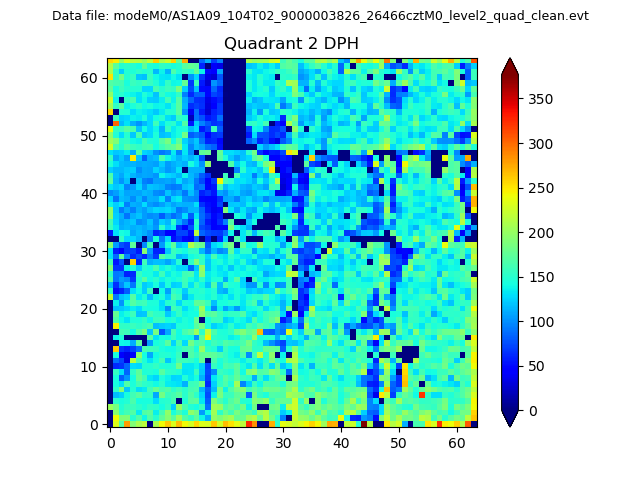
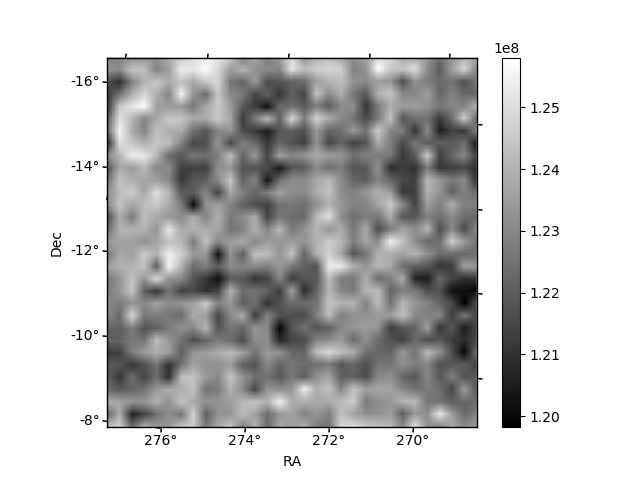
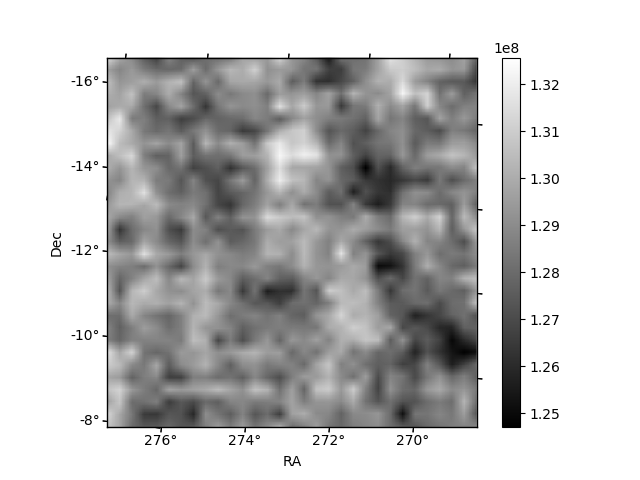
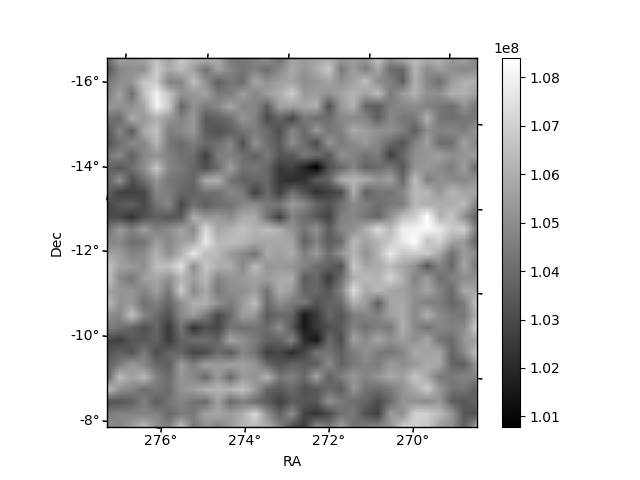
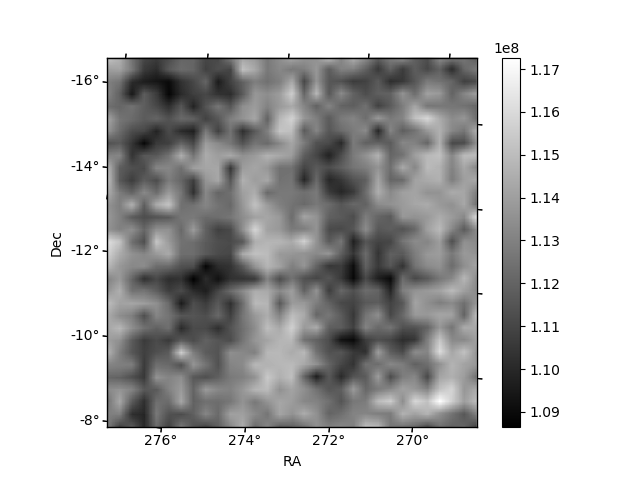
Histogram calculated using DETX and DETY for each event in the final _common_clean file
| Quadrant A | 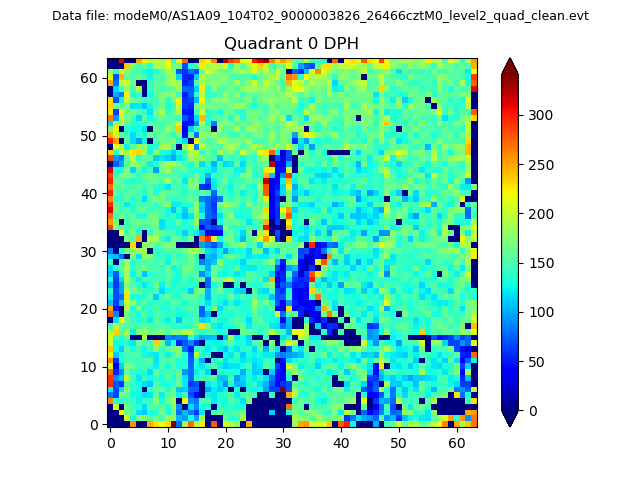 |
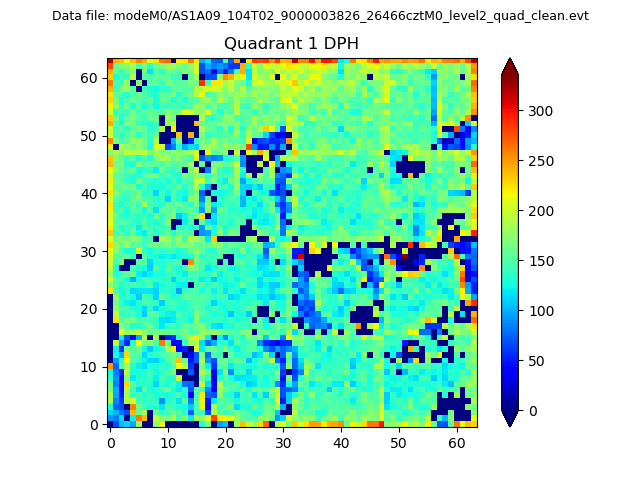 |
Quadrant B |
|---|---|---|---|
| Quadrant D | 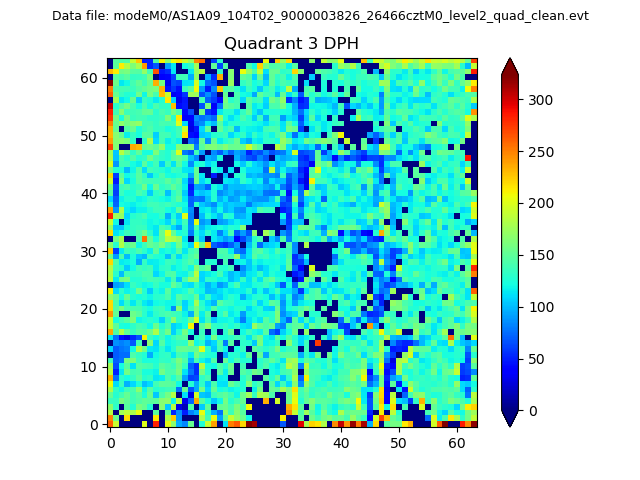 |
 |
Quadrant C |
| Plot type | Count rate plots | Images |
|---|---|---|
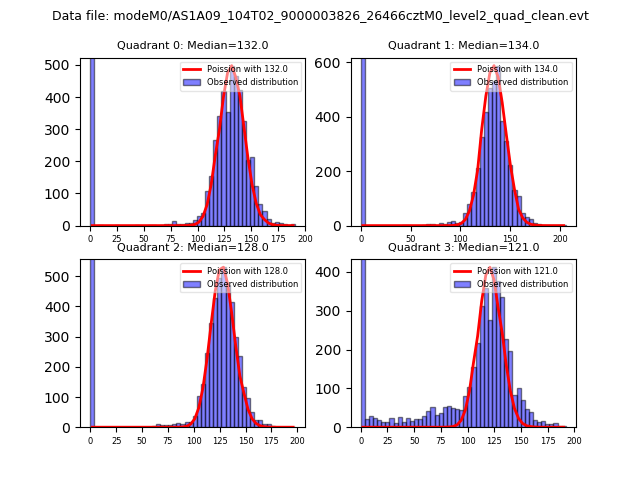
| Comparison with Poisson distribution Blue bars denote a histogram of data divided into 1 sec bins. Red curve is a Poisson curve with rate = median count rate of data. |
 |
 |
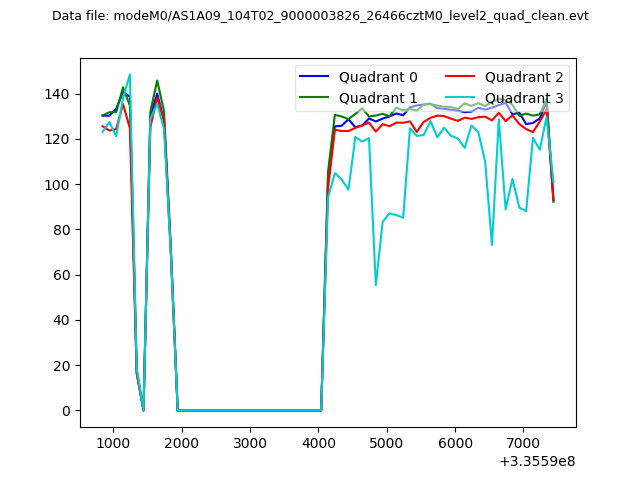
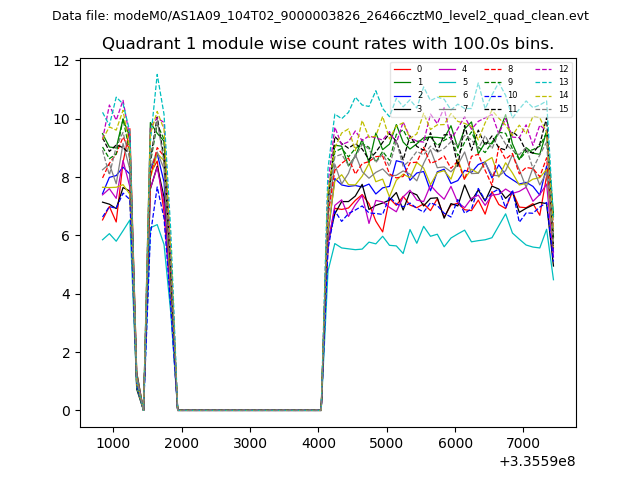
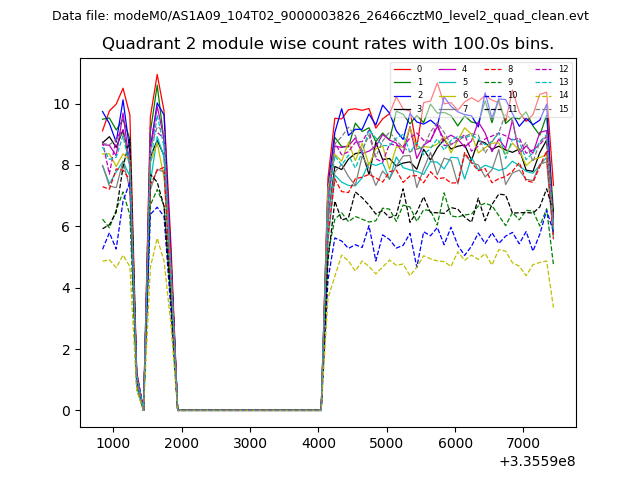
| Quadrant-wise count rates Data is divided into 100 sec bins |
 |
|
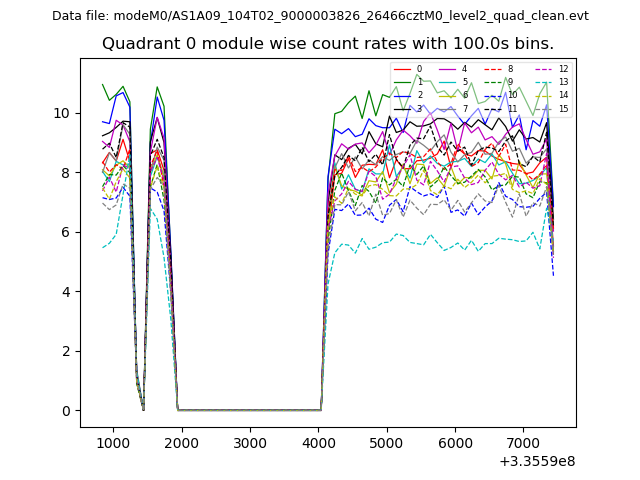
| Module-wise count rates for Quadrant A Data is divided into 100 sec bins |
 |
 |
| Module-wise count rates for Quadrant B Data is divided into 100 sec bins |
 |
 |
| Module-wise count rates for Quadrant C Data is divided into 100 sec bins |
 |
 |
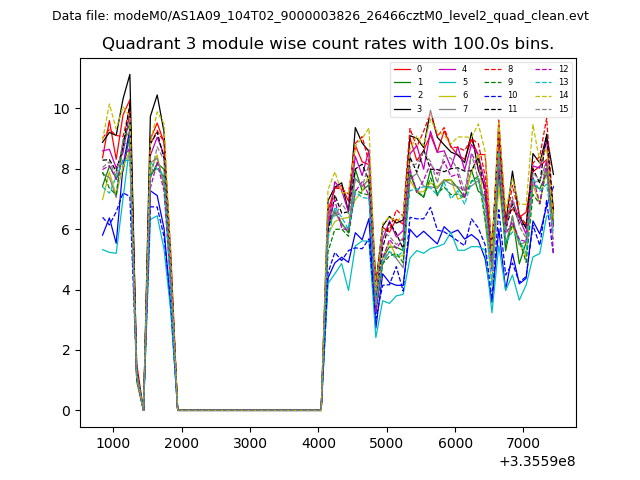
| Module-wise count rates for Quadrant D Data is divided into 100 sec bins |
 |
 |
| Parameter | Plot |
|---|---|
| CZT HV Monitor | 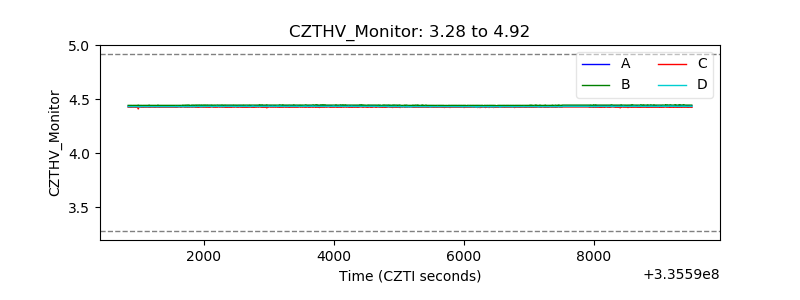 |
| D_VDD | 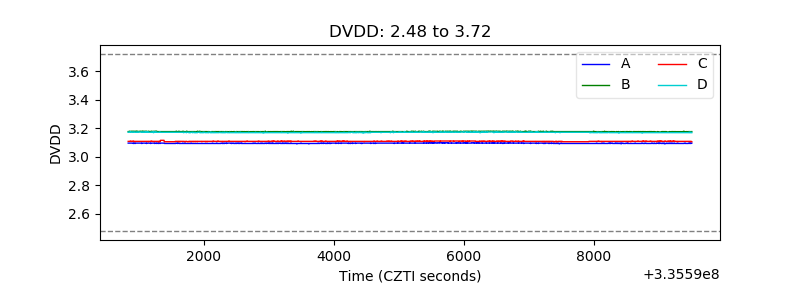 |
| Temperature 1 | 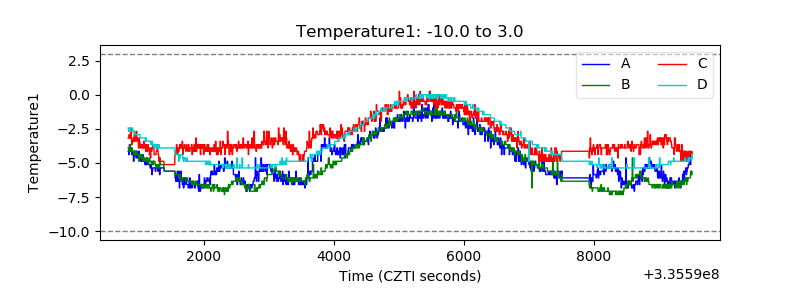 |
| Veto HV Monitor | 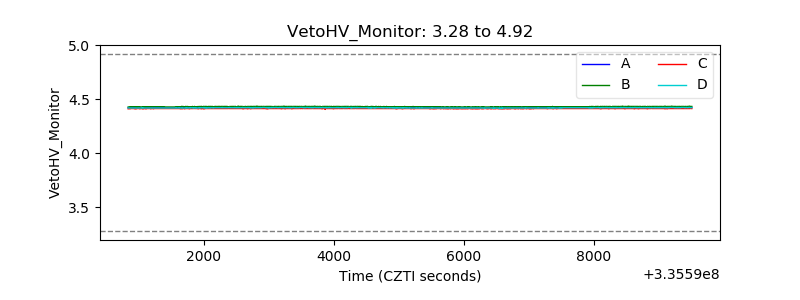 |
| Veto LLD | 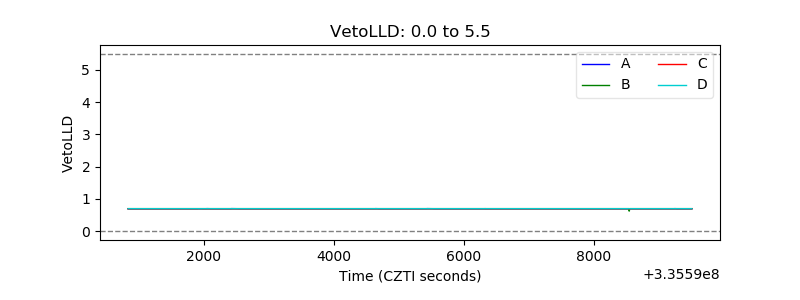 |
| Alpha Counter | 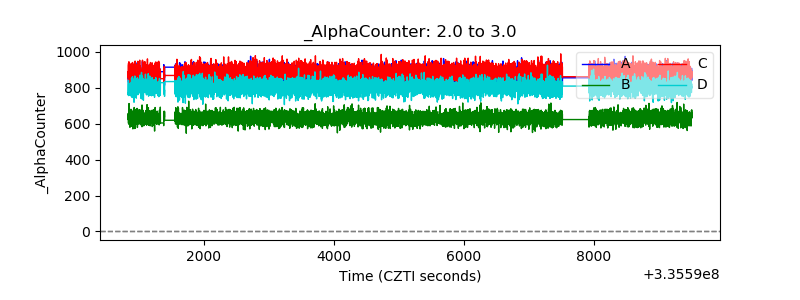 |
| _CPM_Rate | 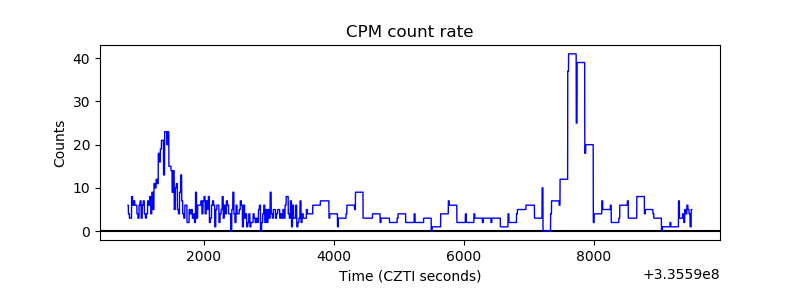 |
| CZT Counter | 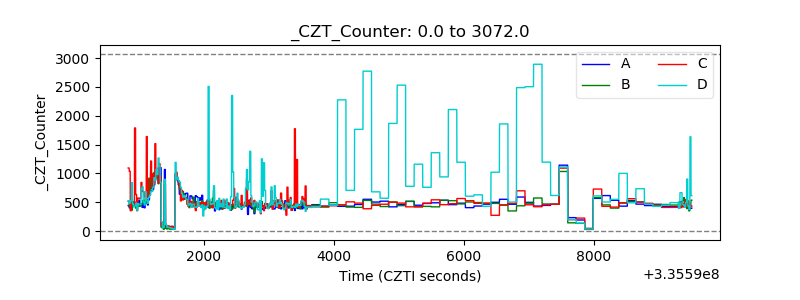 |
| +2.5 Volts monitor | 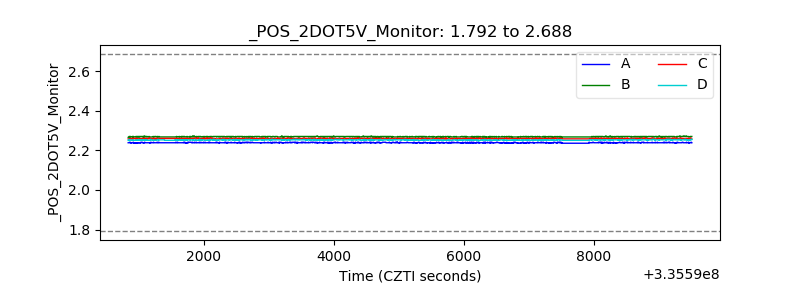 |
| +5 Volts monitor | 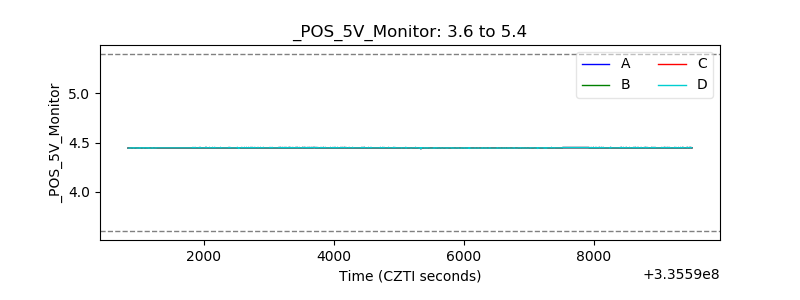 |
| _ROLL_ROT | 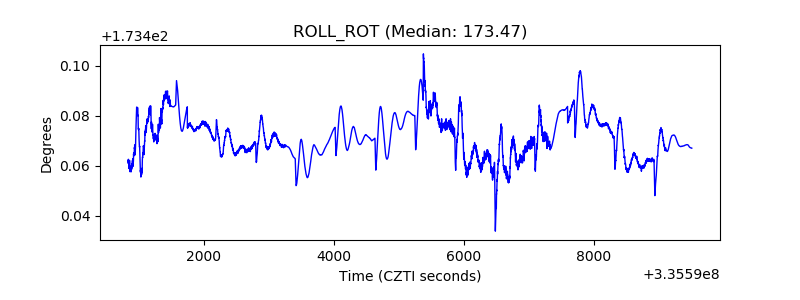 |
| _Roll_DEC | 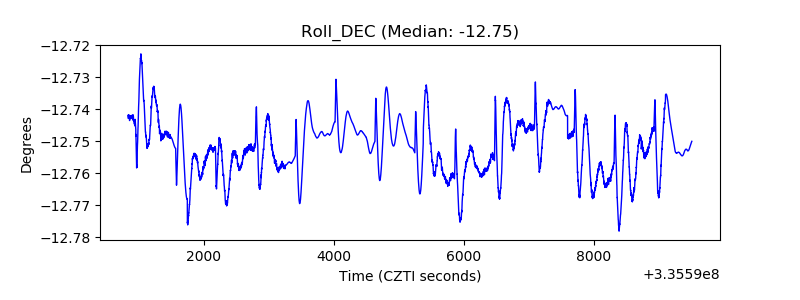 |
| _Roll_RA | 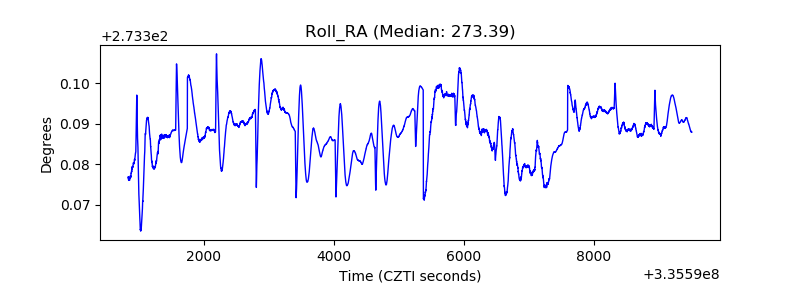 |
| Veto Counter |  |