| Param | Original file | Final file |
|---|---|---|
| Filename | modeM0/AS1A09_104T02_9000003826_26468cztM0_level2.evt | modeM0/AS1A09_104T02_9000003826_26468cztM0_level2_quad_clean.evt |
| Size (bytes) | 1,097,449,920 | 149,808,960 |
| Size | 1.0 GB | 142.9 MB |
| Events in quadrant A | 6,018,102 | 970,757 |
| Events in quadrant B | 6,238,186 | 984,547 |
| Events in quadrant C | 6,632,693 | 938,522 |
| Events in quadrant D | 13,490,907 | 766,329 |
| Mode M0 | |||
|---|---|---|---|
| Quadrant | BADHDUFLAG | Total packets | Discarded packets |
| A | 0 | 25855 | 0 |
| B | 0 | 26204 | 0 |
| C | 0 | 27377 | 0 |
| D | 0 | 48559 | 0 |
| Mode M9 | |||
|---|---|---|---|
| Quadrant | BADHDUFLAG | Total packets | Discarded packets |
| A | 0 | 14 | 0 |
| B | 0 | 14 | 0 |
| C | 0 | 14 | 0 |
| D | 0 | 14 | 0 |
| Quadrant | Total seconds | Saturated seconds | Saturation percentage |
|---|---|---|---|
| A | 12680 | 140 | 1.104101% |
| B | 12680 | 195 | 1.537855% |
| C | 12681 | 302 | 2.381516% |
| D | 12680 | 2681 | 21.143533% |
Noise dominated data is calculated using 1-second bins in cleaned event files. If a bin has >2000 counts, and if more than 50% of those come from <1% of pixels, then it is considered to be noise-dominated and hence unusable.
| Quadrant | # 1 sec bins | Bins with >0 counts | Bins with >2000 counts | High rate bins dominated by noise | Noise dominated (total time) | Noise dominated (detector-on time) | Marked lightcurve |
|---|---|---|---|---|---|---|---|
| A | 13996 | 12681 | 0 | 0 | 0.00% | 0.00% | 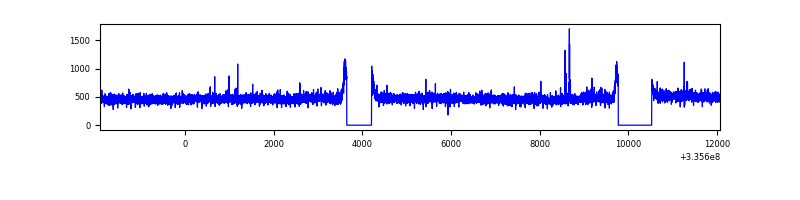 |
| B | 13996 | 12681 | 14 | 14 | 0.10% | 0.11% | 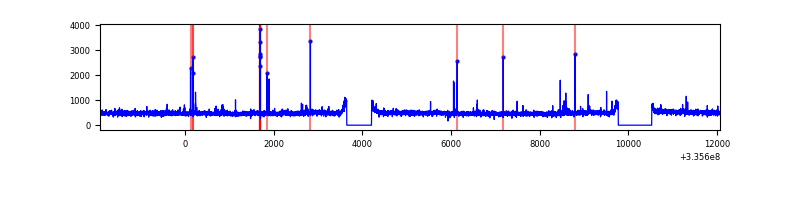 |
| C | 13997 | 12682 | 61 | 61 | 0.44% | 0.48% | 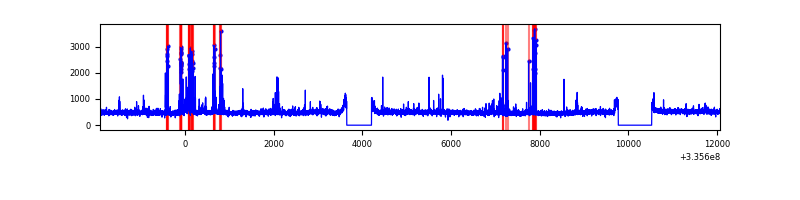 |
| D | 13996 | 12681 | 2176 | 2176 | 15.55% | 17.16% | 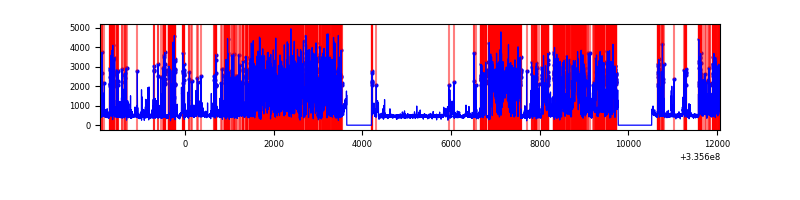 |
Top three noisy pixels from each quadrant. If the there are fewer than three noisy pixels in the level2.evt file, extra rows are filled as -1
| Pixel properties | Quadrant properties | ||||||
|---|---|---|---|---|---|---|---|
| Quadrant | DetID | PixID | Counts | Sigma | Mean | Median | Sigma |
| A | 13 | 254 | 19976 | 59.0 | 1556 | 1522 | 312.8 |
| A | 6 | 16 | 16894 | 49.14 | 1556 | 1522 | 312.8 |
| A | 3 | 137 | 15039 | 43.21 | 1556 | 1522 | 312.8 |
| B | 12 | 111 | 37319 | 120.15 | 1552 | 1514 | 298.0 |
| B | 11 | 111 | 33099 | 105.99 | 1552 | 1514 | 298.0 |
| B | 0 | 230 | 32443 | 103.79 | 1552 | 1514 | 298.0 |
| C | 2 | 16 | 445136 | 1267.43 | 1488 | 1499 | 350.0 |
| C | 14 | 238 | 236131 | 670.32 | 1488 | 1499 | 350.0 |
| C | 3 | 233 | 150012 | 424.29 | 1488 | 1499 | 350.0 |
| D | 7 | 80 | 7437812 | 22976.85 | 1353 | 1319 | 323.7 |
| D | 11 | 176 | 283935 | 873.21 | 1353 | 1319 | 323.7 |
| D | 12 | 233 | 249698 | 767.43 | 1353 | 1319 | 323.7 |
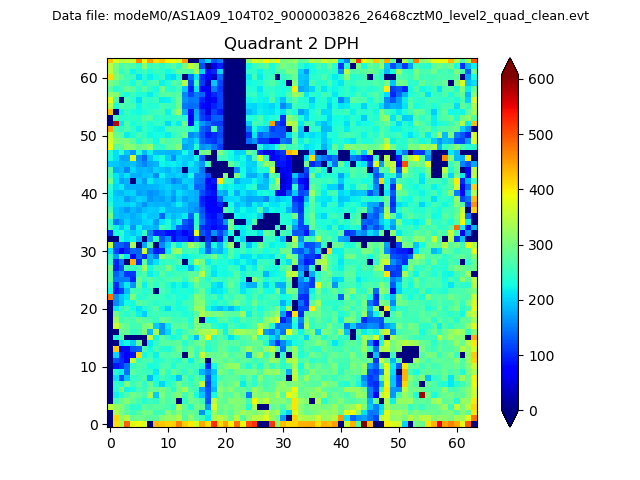
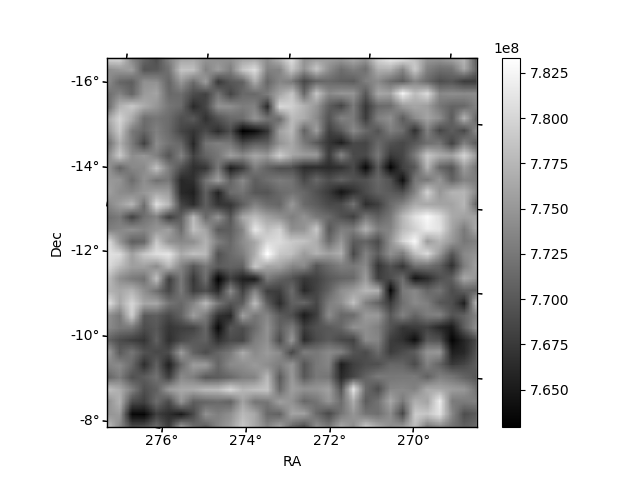
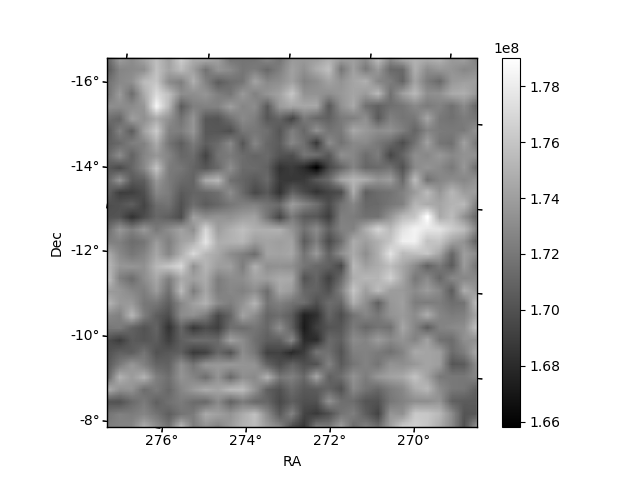
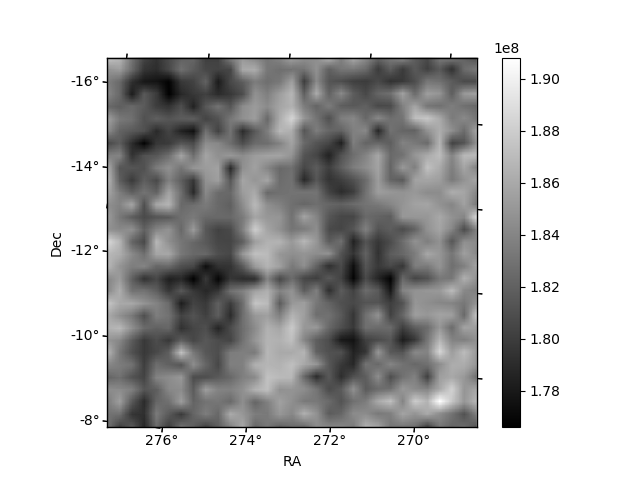
Histogram calculated using DETX and DETY for each event in the final _common_clean file
| Quadrant A | 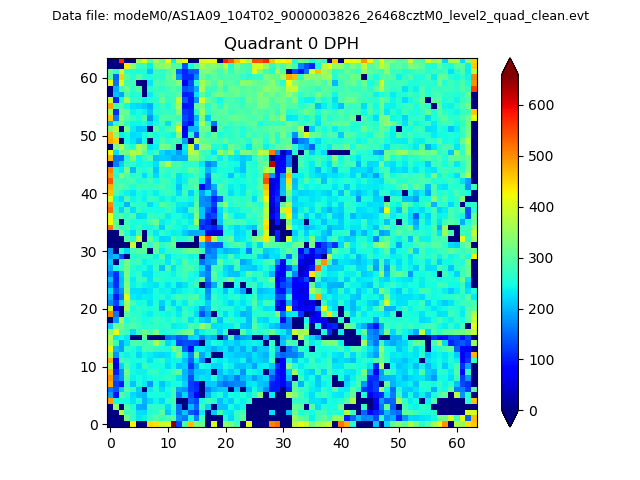 |
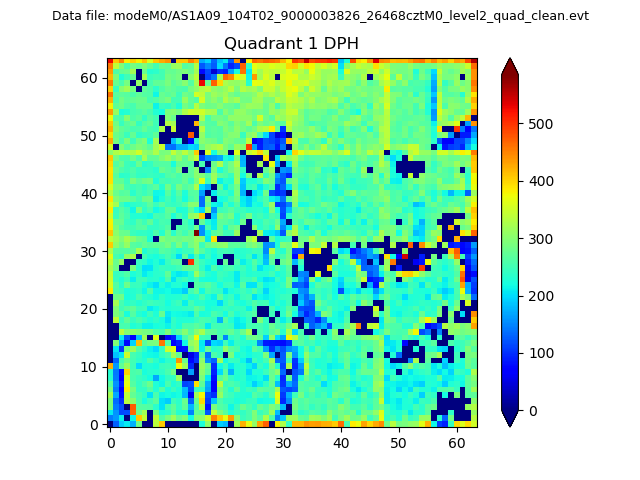 |
Quadrant B |
|---|---|---|---|
| Quadrant D | 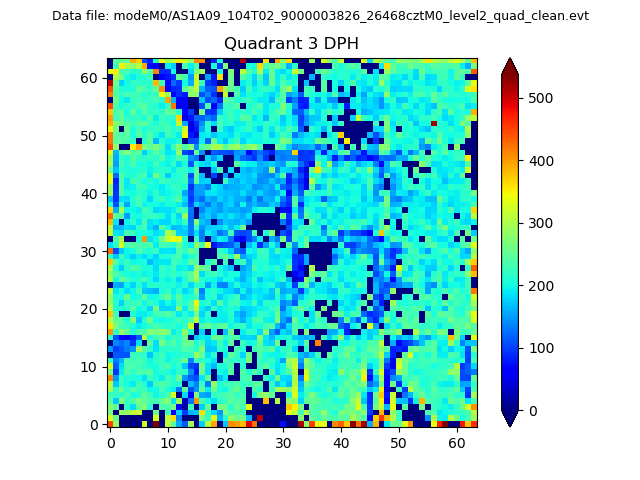 |
 |
Quadrant C |
| Plot type | Count rate plots | Images |
|---|---|---|
| Comparison with Poisson distribution Blue bars denote a histogram of data divided into 1 sec bins. Red curve is a Poisson curve with rate = median count rate of data. |
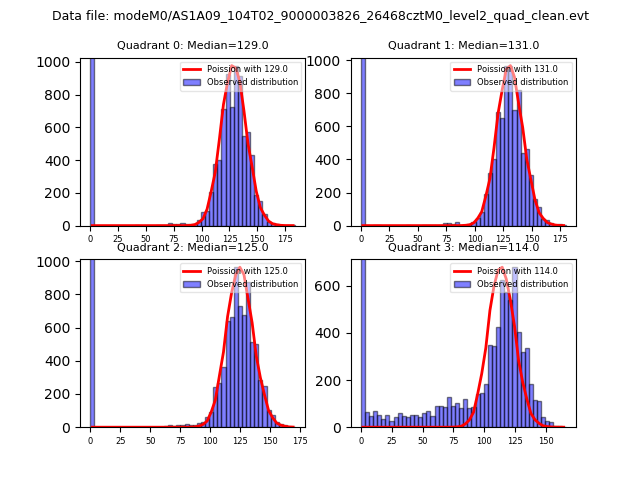 |
 |
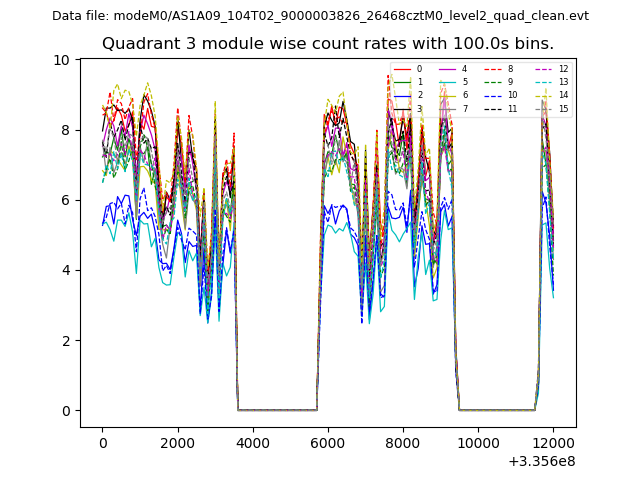
| Quadrant-wise count rates Data is divided into 100 sec bins |
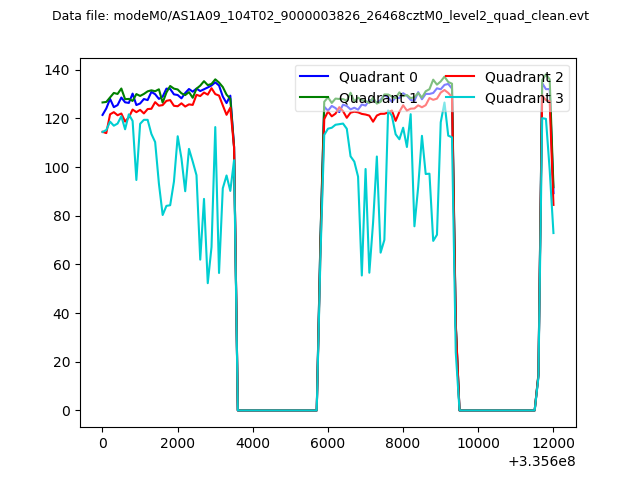 |
|
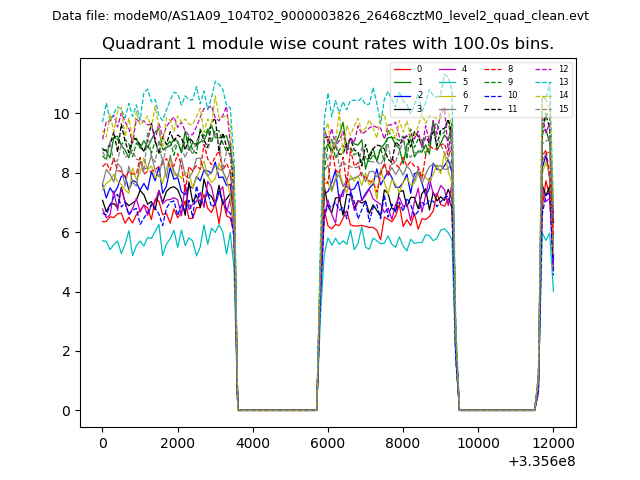
| Module-wise count rates for Quadrant A Data is divided into 100 sec bins |
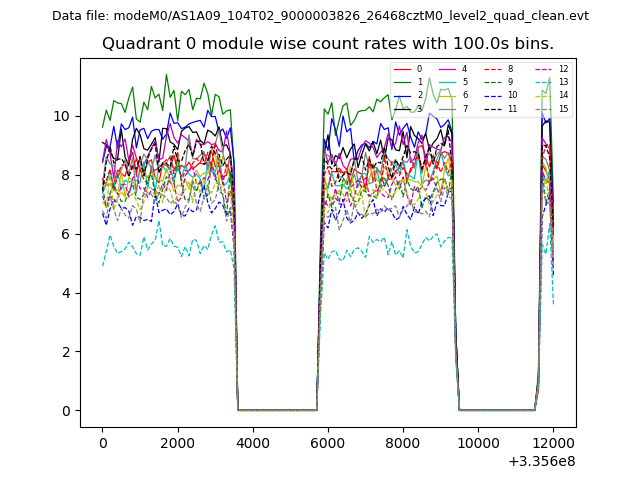 |
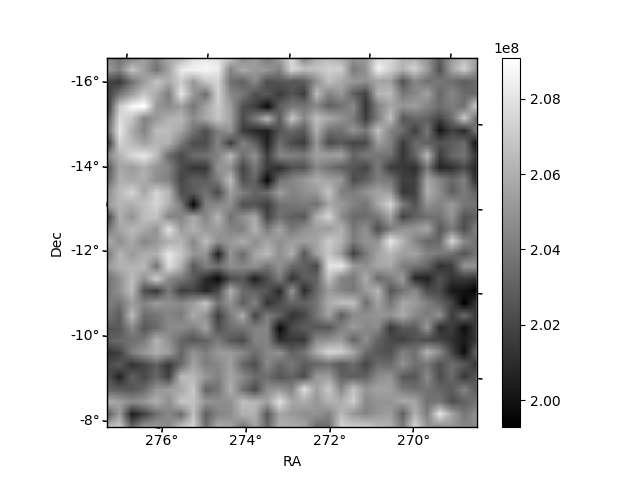 |
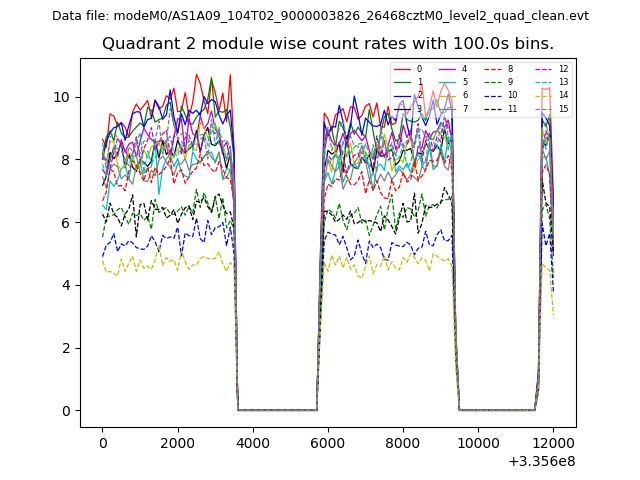
| Module-wise count rates for Quadrant B Data is divided into 100 sec bins |
 |
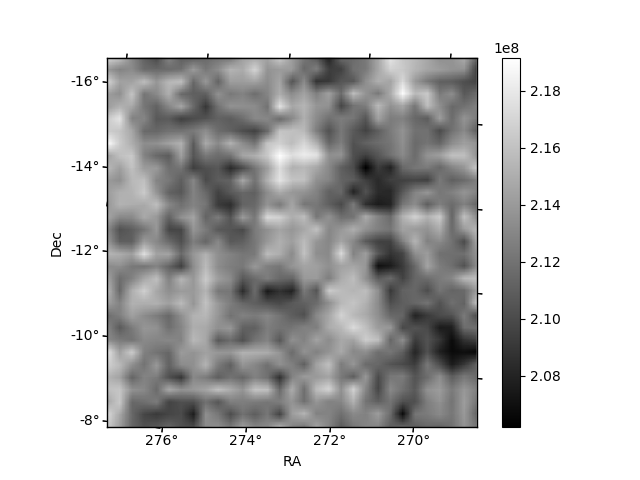 |
| Module-wise count rates for Quadrant C Data is divided into 100 sec bins |
 |
 |
| Module-wise count rates for Quadrant D Data is divided into 100 sec bins |
 |
 |
| Parameter | Plot |
|---|---|
| CZT HV Monitor | 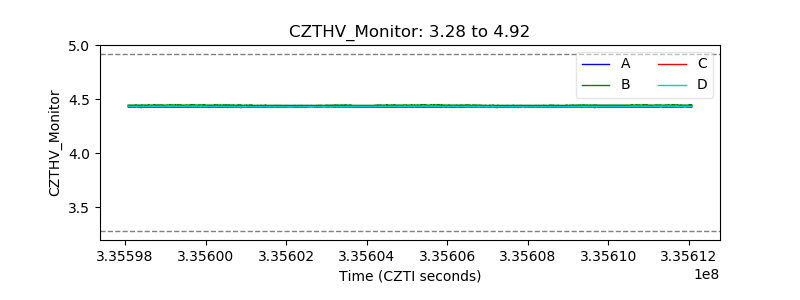 |
| D_VDD | 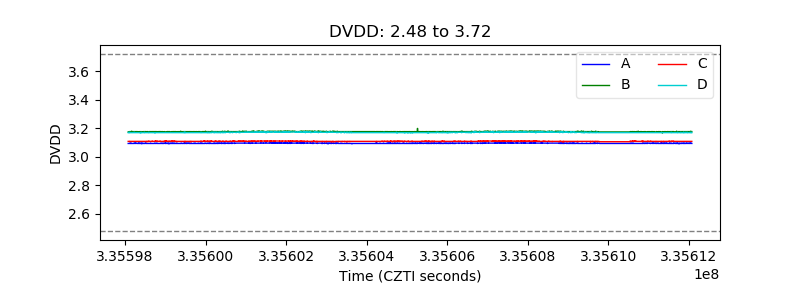 |
| Temperature 1 | 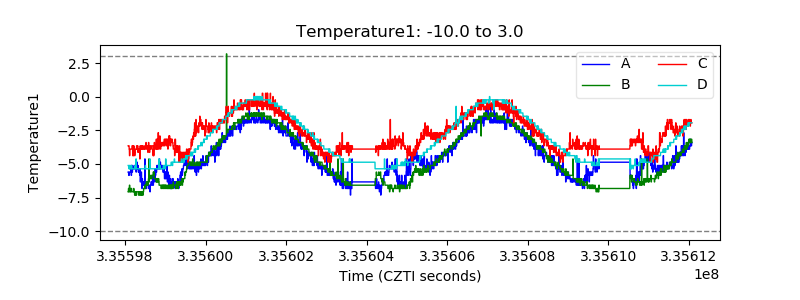 |
| Veto HV Monitor | 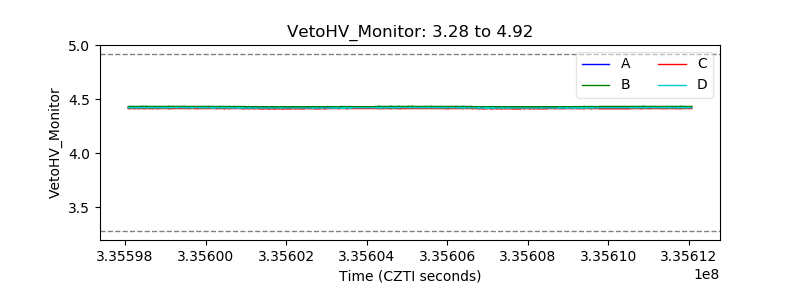 |
| Veto LLD | 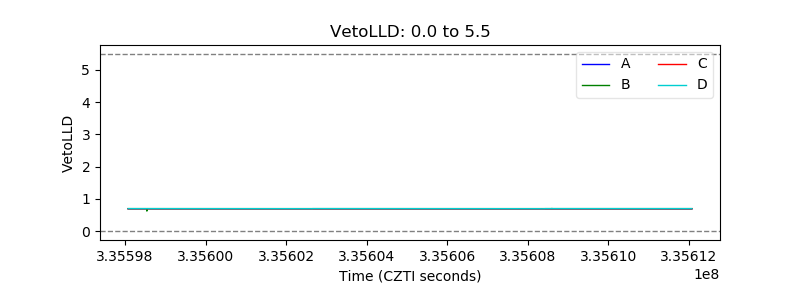 |
| Alpha Counter | 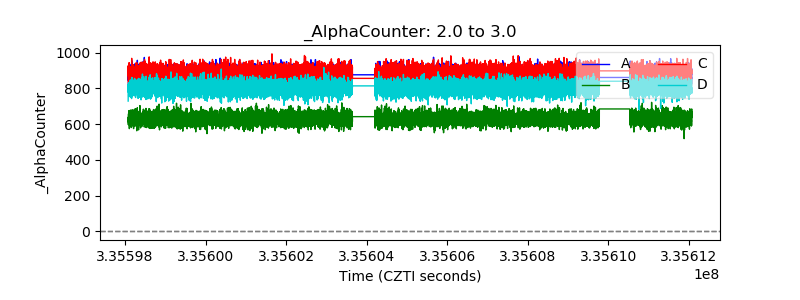 |
| _CPM_Rate |  |
| CZT Counter | 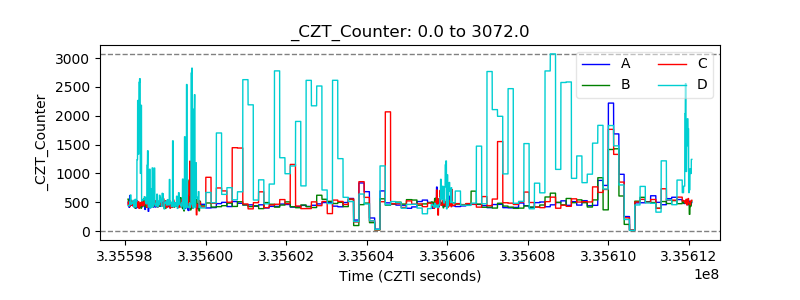 |
| +2.5 Volts monitor |  |
| +5 Volts monitor |  |
| _ROLL_ROT | 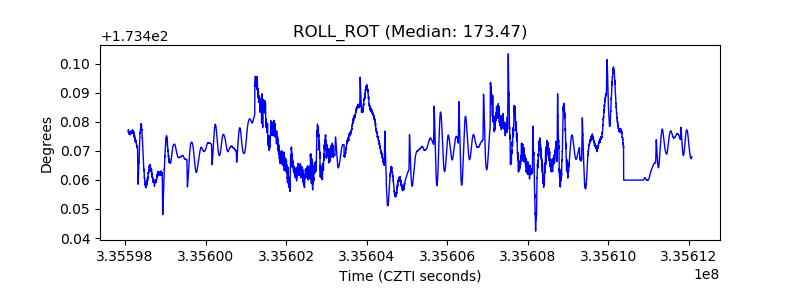 |
| _Roll_DEC | 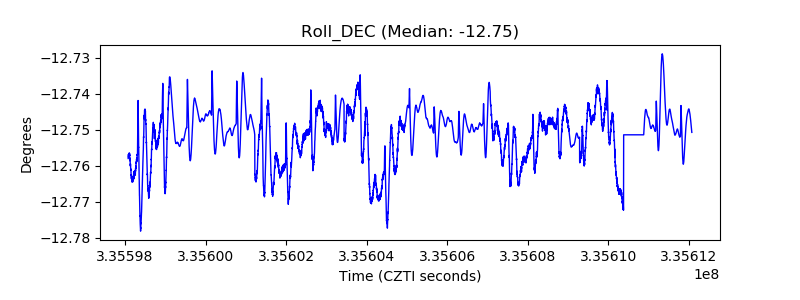 |
| _Roll_RA | 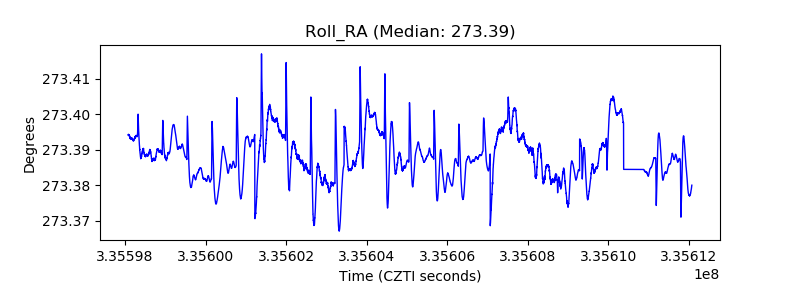 |
| Veto Counter | 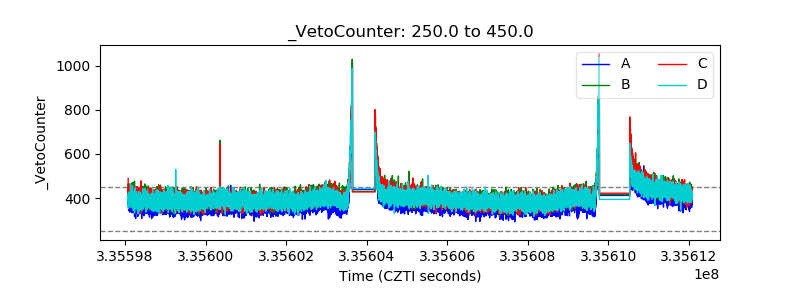 |