| Param | Original file | Final file |
|---|---|---|
| Filename | modeM0/AS1A09_104T02_9000003826_26469cztM0_level2.evt | modeM0/AS1A09_104T02_9000003826_26469cztM0_level2_quad_clean.evt |
| Size (bytes) | 559,307,520 | 85,057,920 |
| Size | 533.4 MB | 81.1 MB |
| Events in quadrant A | 3,015,905 | 570,877 |
| Events in quadrant B | 3,053,353 | 579,458 |
| Events in quadrant C | 3,158,738 | 548,036 |
| Events in quadrant D | 7,293,675 | 447,511 |
| Mode M0 | |||
|---|---|---|---|
| Quadrant | BADHDUFLAG | Total packets | Discarded packets |
| A | 0 | 12778 | 0 |
| B | 0 | 12829 | 0 |
| C | 0 | 13092 | 0 |
| D | 0 | 25783 | 0 |
| Mode M9 | |||
|---|---|---|---|
| Quadrant | BADHDUFLAG | Total packets | Discarded packets |
| A | 0 | 9 | 0 |
| B | 0 | 9 | 0 |
| C | 0 | 9 | 0 |
| D | 0 | 9 | 0 |
| Quadrant | Total seconds | Saturated seconds | Saturation percentage |
|---|---|---|---|
| A | 6152 | 71 | 1.154096% |
| B | 6152 | 77 | 1.251625% |
| C | 6152 | 111 | 1.804291% |
| D | 6153 | 1451 | 23.581993% |
Noise dominated data is calculated using 1-second bins in cleaned event files. If a bin has >2000 counts, and if more than 50% of those come from <1% of pixels, then it is considered to be noise-dominated and hence unusable.
| Quadrant | # 1 sec bins | Bins with >0 counts | Bins with >2000 counts | High rate bins dominated by noise | Noise dominated (total time) | Noise dominated (detector-on time) | Marked lightcurve |
|---|---|---|---|---|---|---|---|
| A | 7077 | 6152 | 0 | 0 | 0.00% | 0.00% | 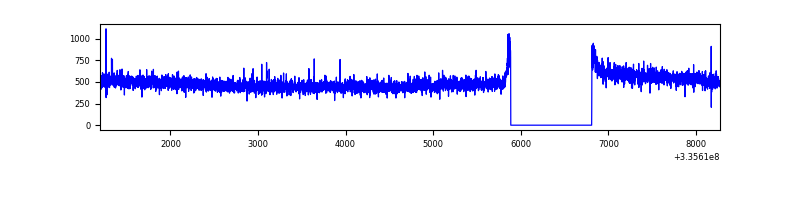 |
| B | 7077 | 6152 | 0 | 0 | 0.00% | 0.00% | 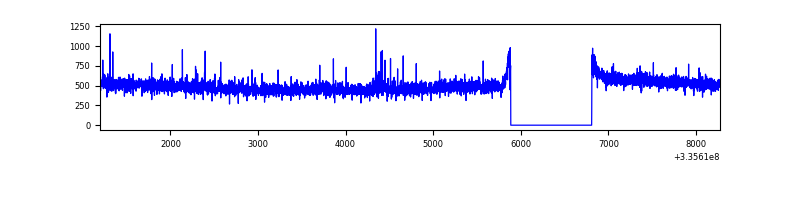 |
| C | 7077 | 6152 | 18 | 18 | 0.25% | 0.29% | 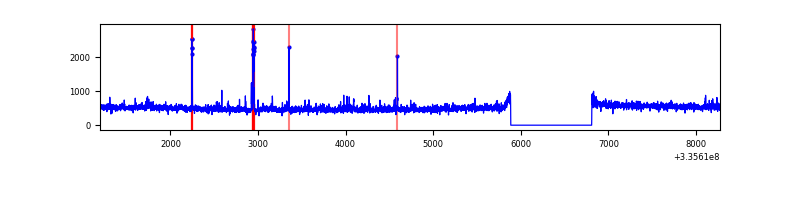 |
| D | 7078 | 6154 | 1288 | 1288 | 18.20% | 20.93% | 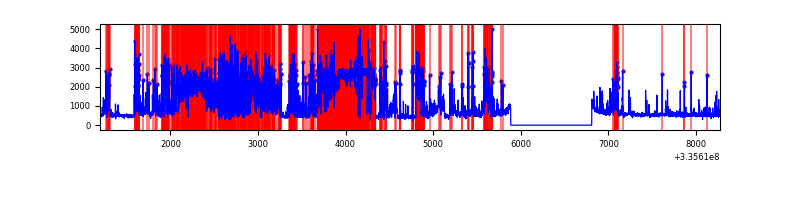 |
Top three noisy pixels from each quadrant. If the there are fewer than three noisy pixels in the level2.evt file, extra rows are filled as -1
| Pixel properties | Quadrant properties | ||||||
|---|---|---|---|---|---|---|---|
| Quadrant | DetID | PixID | Counts | Sigma | Mean | Median | Sigma |
| A | 13 | 254 | 9010 | 52.39 | 782 | 766 | 157.4 |
| A | 3 | 137 | 7228 | 41.06 | 782 | 766 | 157.4 |
| A | 0 | 226 | 6696 | 37.68 | 782 | 766 | 157.4 |
| B | 12 | 111 | 18418 | 119.4 | 771 | 753 | 147.9 |
| B | 11 | 111 | 16200 | 104.41 | 771 | 753 | 147.9 |
| B | 14 | 111 | 14638 | 93.85 | 771 | 753 | 147.9 |
| C | 14 | 238 | 118471 | 681.2 | 738 | 742 | 172.8 |
| C | 3 | 233 | 82935 | 475.58 | 738 | 742 | 172.8 |
| C | 2 | 16 | 66442 | 380.15 | 738 | 742 | 172.8 |
| D | 7 | 80 | 4214207 | 26150.06 | 676 | 662 | 161.1 |
| D | 11 | 176 | 189856 | 1174.17 | 676 | 662 | 161.1 |
| D | 12 | 233 | 154436 | 954.35 | 676 | 662 | 161.1 |
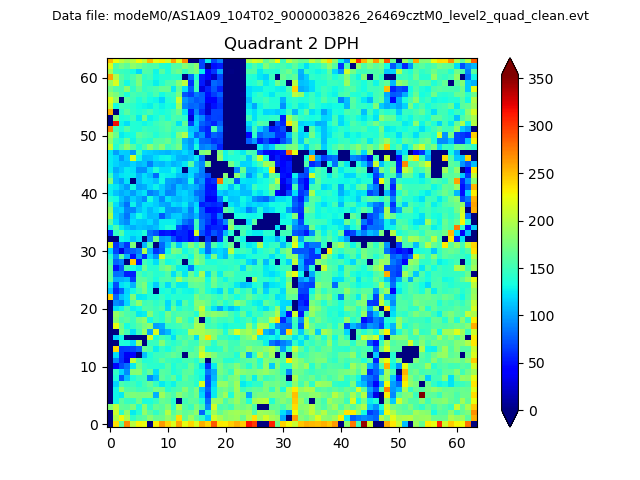
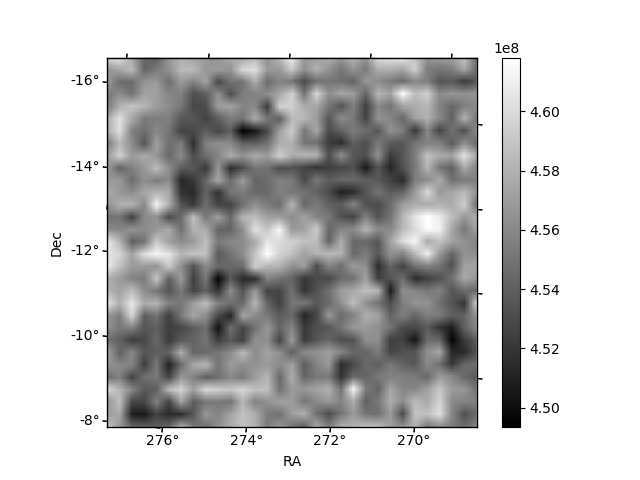
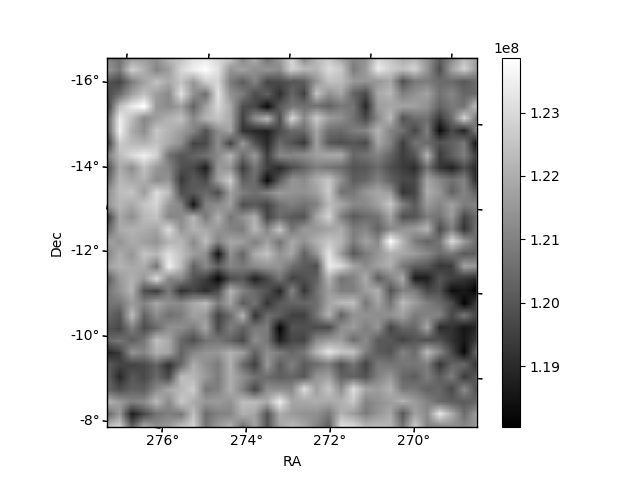
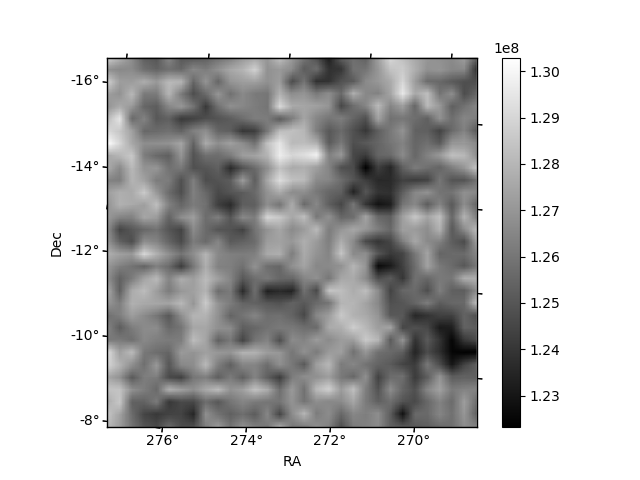
Histogram calculated using DETX and DETY for each event in the final _common_clean file
| Quadrant A | 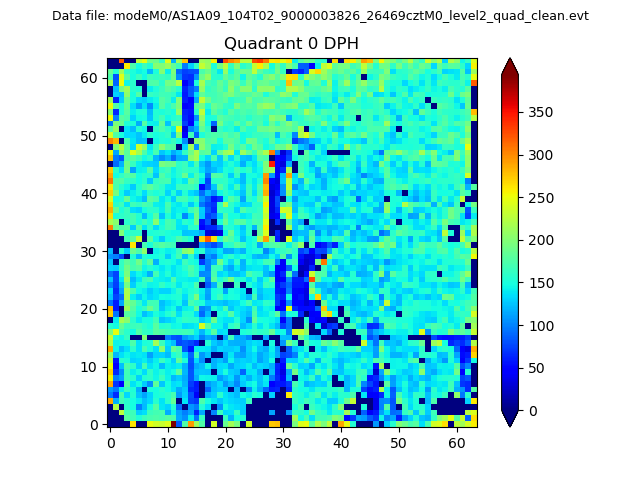 |
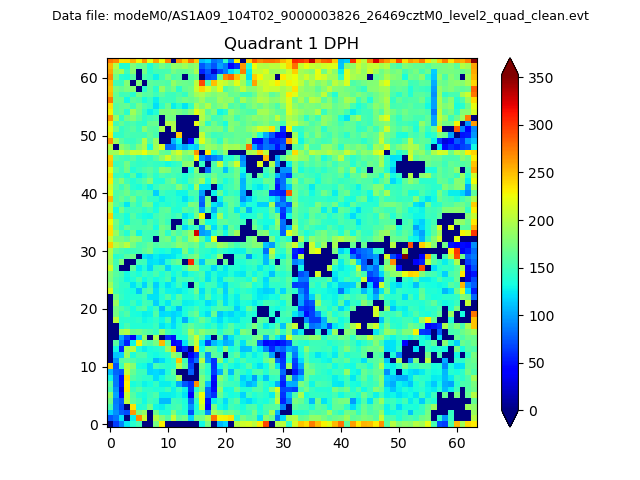 |
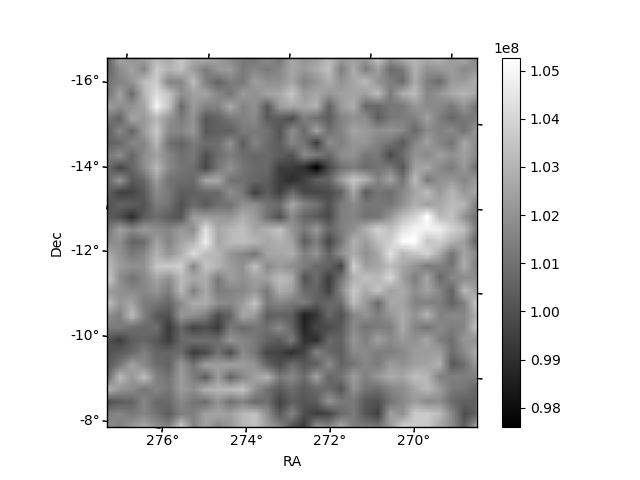
Quadrant B |
|---|---|---|---|
| Quadrant D | 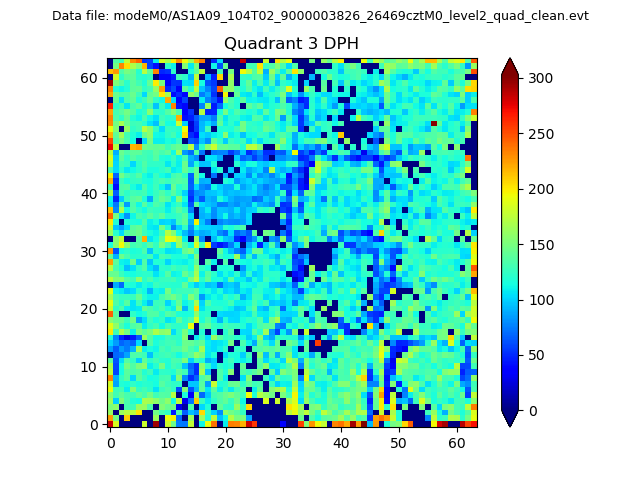 |
 |
Quadrant C |
| Plot type | Count rate plots | Images |
|---|---|---|
| Comparison with Poisson distribution Blue bars denote a histogram of data divided into 1 sec bins. Red curve is a Poisson curve with rate = median count rate of data. |
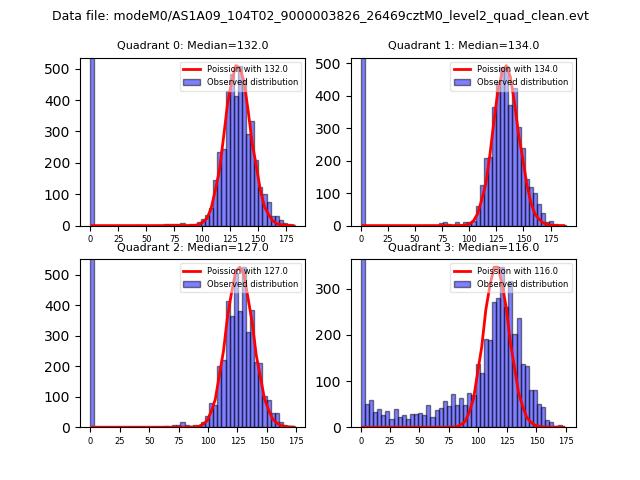 |
 |
| Quadrant-wise count rates Data is divided into 100 sec bins |
 |
|
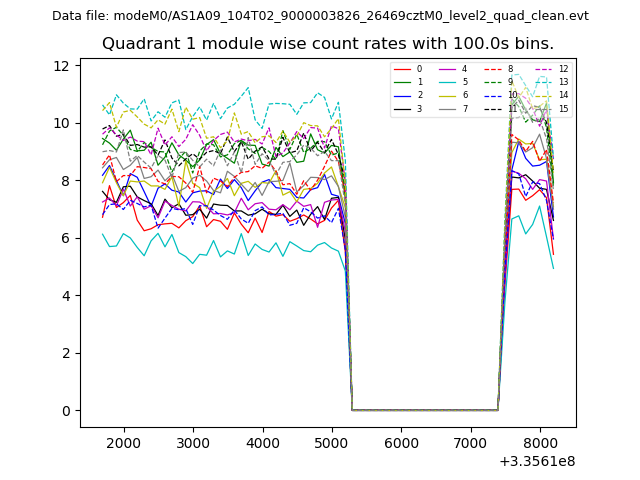
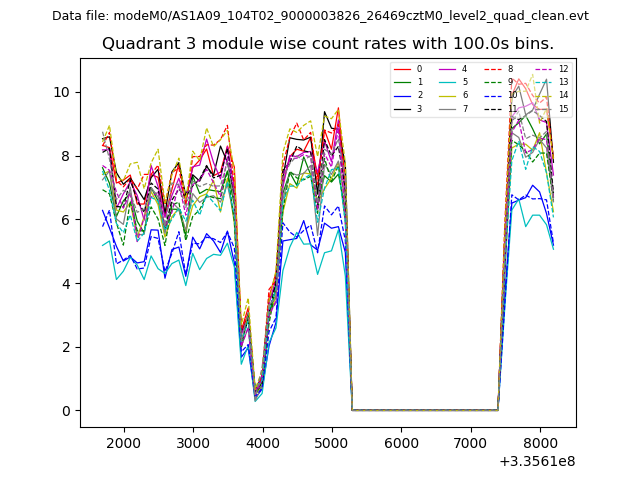
| Module-wise count rates for Quadrant A Data is divided into 100 sec bins |
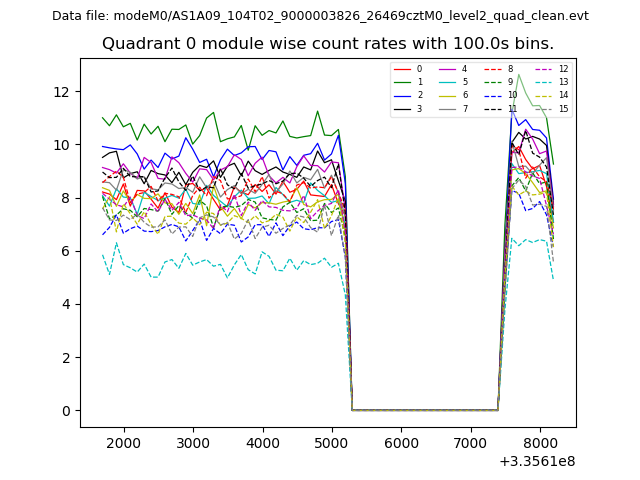 |
 |
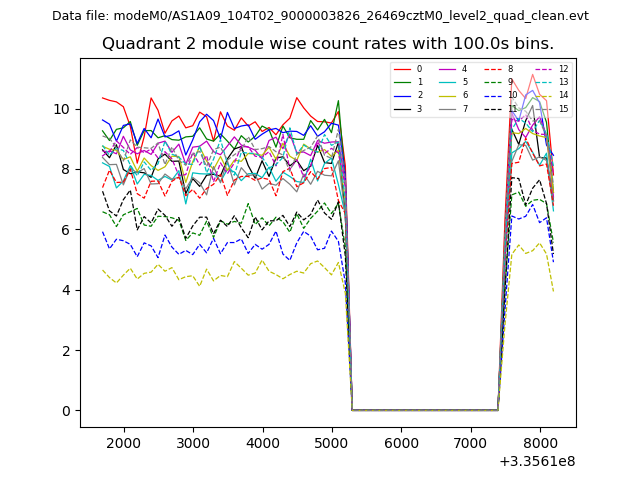
| Module-wise count rates for Quadrant B Data is divided into 100 sec bins |
 |
 |
| Module-wise count rates for Quadrant C Data is divided into 100 sec bins |
 |
 |
| Module-wise count rates for Quadrant D Data is divided into 100 sec bins |
 |
 |
| Parameter | Plot |
|---|---|
| CZT HV Monitor | 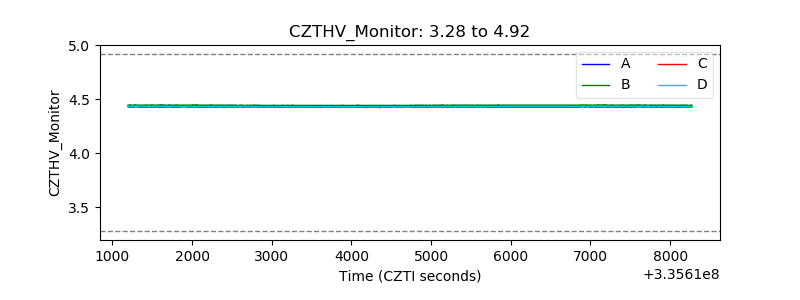 |
| D_VDD | 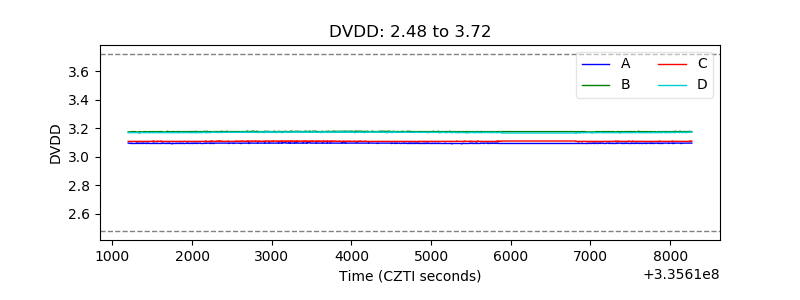 |
| Temperature 1 | 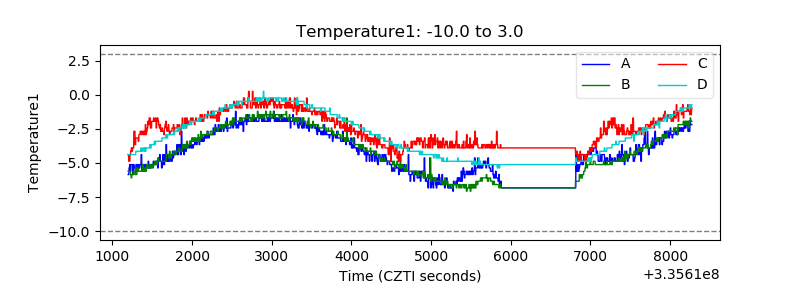 |
| Veto HV Monitor | 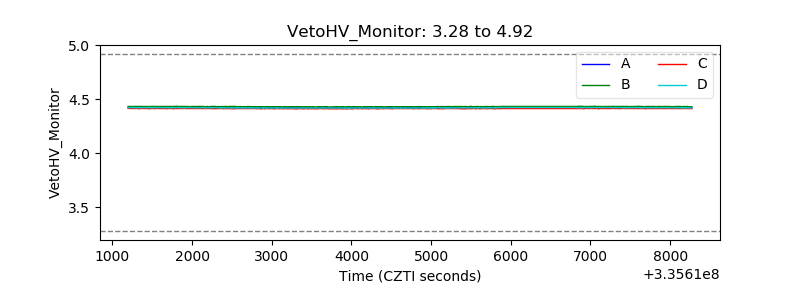 |
| Veto LLD | 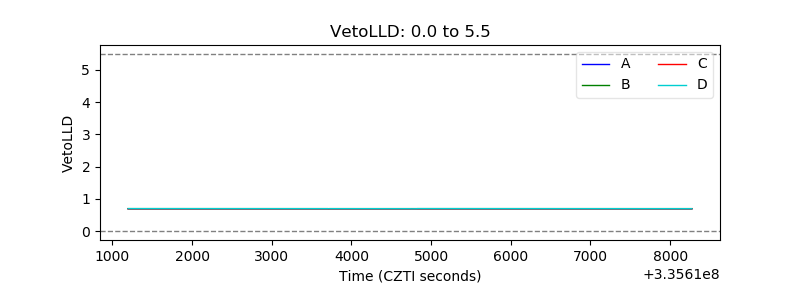 |
| Alpha Counter | 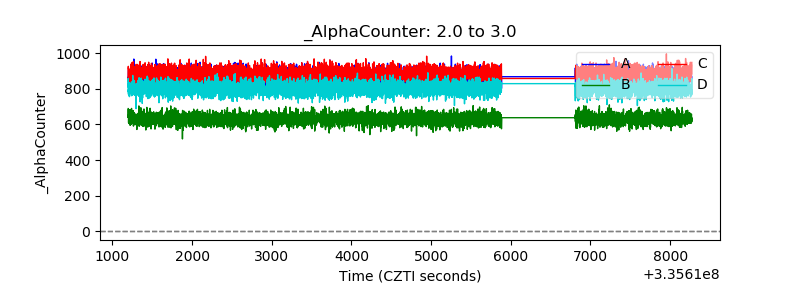 |
| _CPM_Rate | 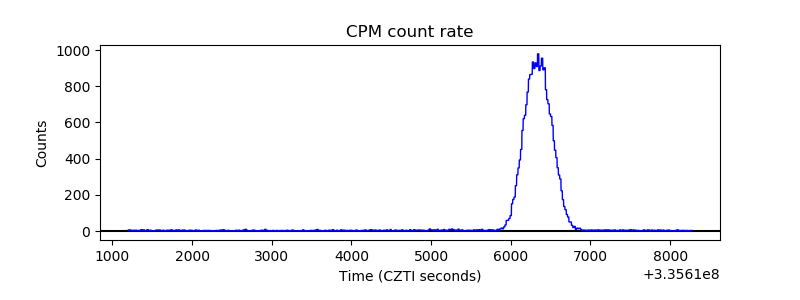 |
| CZT Counter | 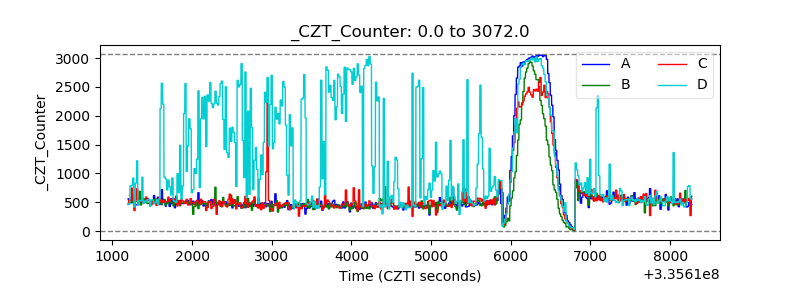 |
| +2.5 Volts monitor |  |
| +5 Volts monitor |  |
| _ROLL_ROT | 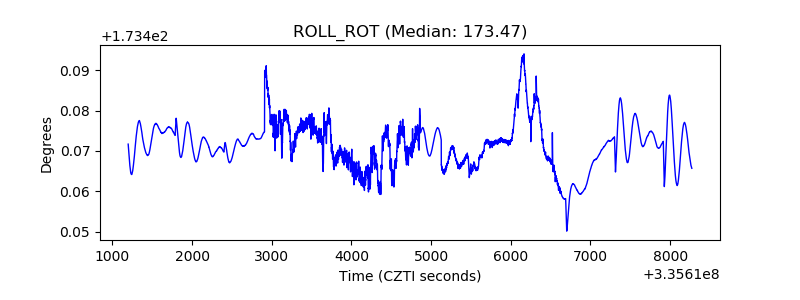 |
| _Roll_DEC | 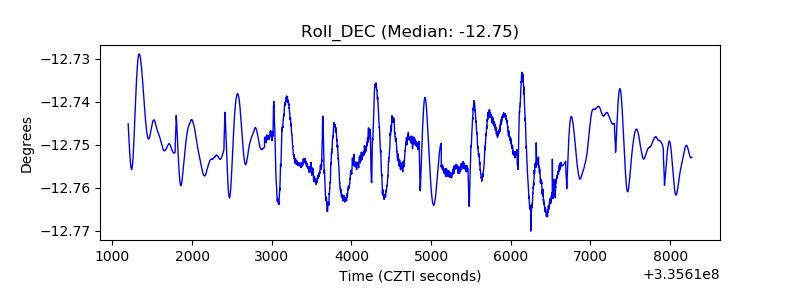 |
| _Roll_RA | 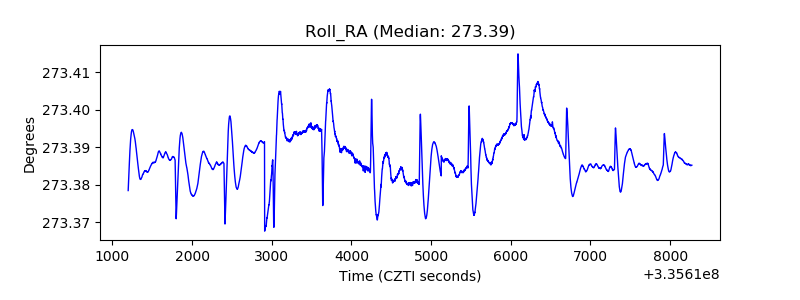 |
| Veto Counter | 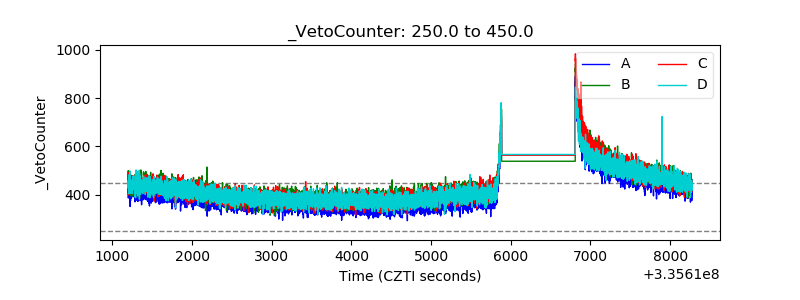 |