| Param | Original file | Final file |
|---|---|---|
| Filename | modeM0/AS1A09_104T02_9000003826_26470cztM0_level2.evt | modeM0/AS1A09_104T02_9000003826_26470cztM0_level2_quad_clean.evt |
| Size (bytes) | 487,128,960 | 99,552,960 |
| Size | 464.6 MB | 94.9 MB |
| Events in quadrant A | 3,173,976 | 665,873 |
| Events in quadrant B | 3,199,648 | 672,257 |
| Events in quadrant C | 3,331,129 | 633,112 |
| Events in quadrant D | 4,624,592 | 608,331 |
| Mode M0 | |||
|---|---|---|---|
| Quadrant | BADHDUFLAG | Total packets | Discarded packets |
| A | 0 | 13494 | 0 |
| B | 0 | 13438 | 0 |
| C | 0 | 13802 | 0 |
| D | 0 | 17851 | 0 |
| Mode M9 | |||
|---|---|---|---|
| Quadrant | BADHDUFLAG | Total packets | Discarded packets |
| A | 0 | 11 | 0 |
| B | 0 | 11 | 0 |
| C | 0 | 11 | 0 |
| D | 0 | 11 | 0 |
| Quadrant | Total seconds | Saturated seconds | Saturation percentage |
|---|---|---|---|
| A | 6239 | 76 | 1.218144% |
| B | 6240 | 88 | 1.410256% |
| C | 6240 | 117 | 1.875000% |
| D | 6240 | 423 | 6.778846% |
Noise dominated data is calculated using 1-second bins in cleaned event files. If a bin has >2000 counts, and if more than 50% of those come from <1% of pixels, then it is considered to be noise-dominated and hence unusable.
| Quadrant | # 1 sec bins | Bins with >0 counts | Bins with >2000 counts | High rate bins dominated by noise | Noise dominated (total time) | Noise dominated (detector-on time) | Marked lightcurve |
|---|---|---|---|---|---|---|---|
| A | 7304 | 6239 | 0 | 0 | 0.00% | 0.00% | 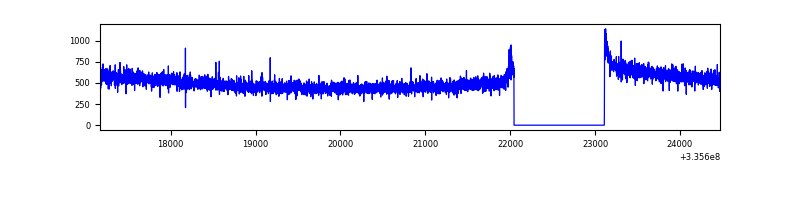 |
| B | 7305 | 6240 | 2 | 2 | 0.03% | 0.03% | 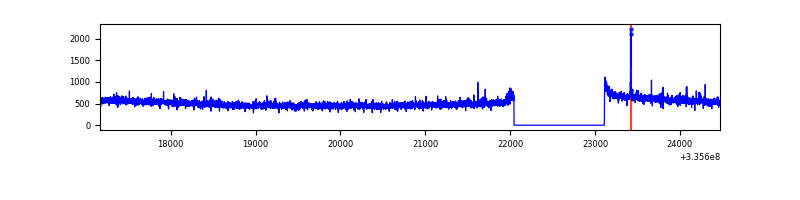 |
| C | 7305 | 6240 | 2 | 2 | 0.03% | 0.03% | 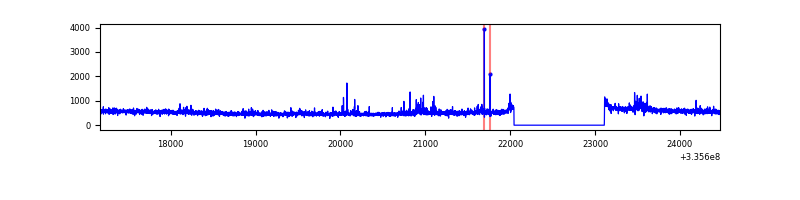 |
| D | 7305 | 6240 | 372 | 372 | 5.09% | 5.96% | 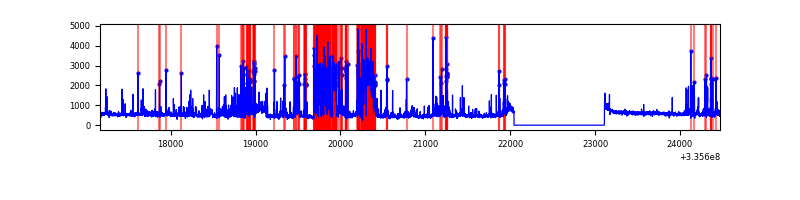 |
Top three noisy pixels from each quadrant. If the there are fewer than three noisy pixels in the level2.evt file, extra rows are filled as -1
| Pixel properties | Quadrant properties | ||||||
|---|---|---|---|---|---|---|---|
| Quadrant | DetID | PixID | Counts | Sigma | Mean | Median | Sigma |
| A | 13 | 254 | 10471 | 58.23 | 823 | 808 | 165.9 |
| A | 3 | 137 | 7253 | 38.84 | 823 | 808 | 165.9 |
| A | 0 | 226 | 7167 | 38.32 | 823 | 808 | 165.9 |
| B | 12 | 111 | 18500 | 113.88 | 809 | 789 | 155.5 |
| B | 11 | 111 | 16657 | 102.03 | 809 | 789 | 155.5 |
| B | 10 | 249 | 16536 | 101.25 | 809 | 789 | 155.5 |
| C | 14 | 238 | 123842 | 678.3 | 776 | 780 | 181.4 |
| C | 3 | 233 | 97895 | 535.28 | 776 | 780 | 181.4 |
| C | 4 | 254 | 73149 | 398.89 | 776 | 780 | 181.4 |
| D | 7 | 80 | 1313660 | 7055.99 | 779 | 762 | 186.1 |
| D | 12 | 233 | 220367 | 1180.24 | 779 | 762 | 186.1 |
| D | 11 | 176 | 89642 | 477.67 | 779 | 762 | 186.1 |
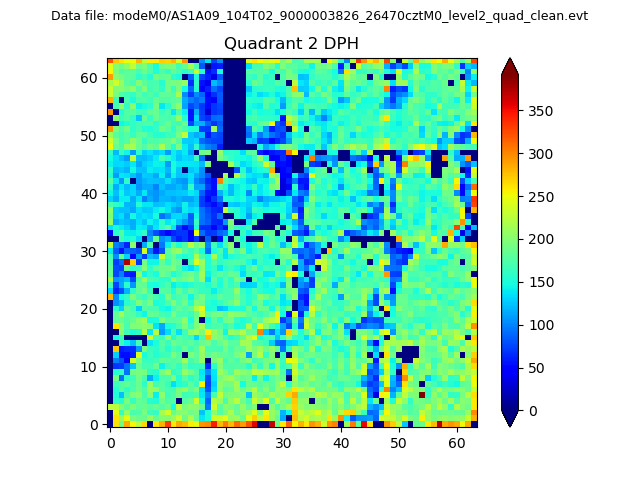
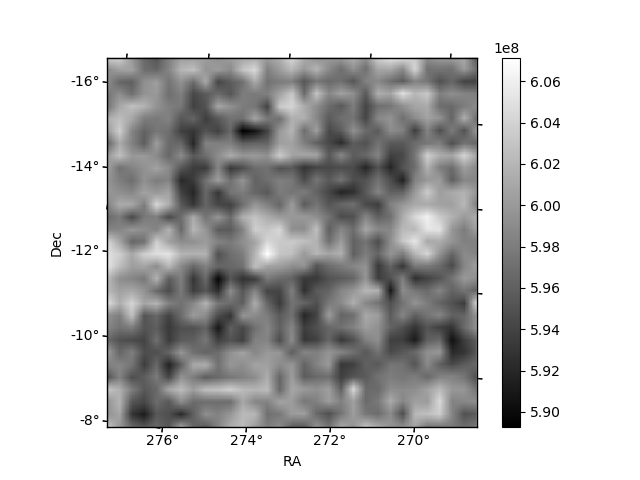
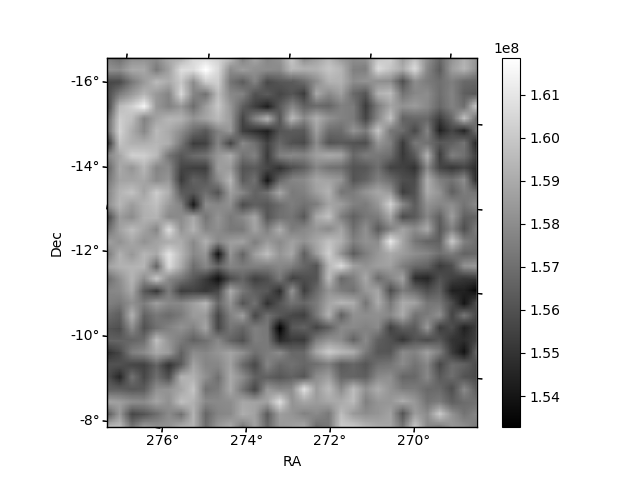
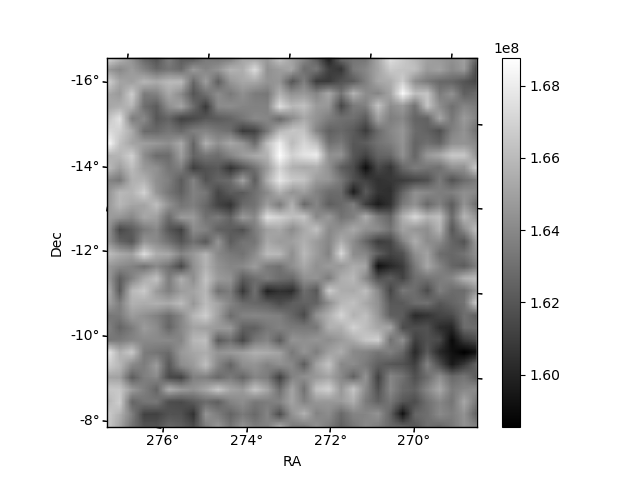
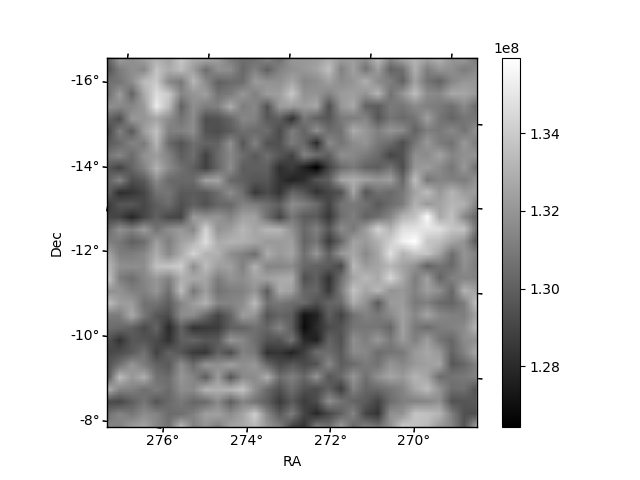
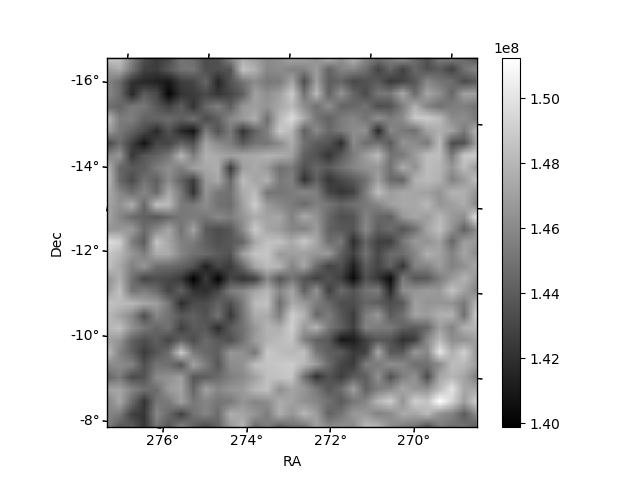
Histogram calculated using DETX and DETY for each event in the final _common_clean file
| Quadrant A | 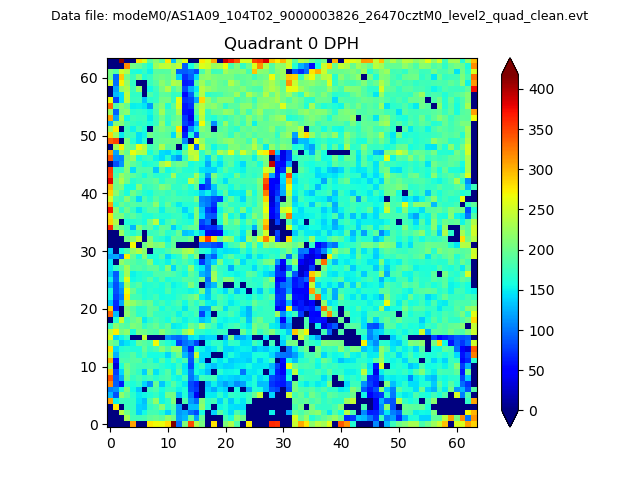 |
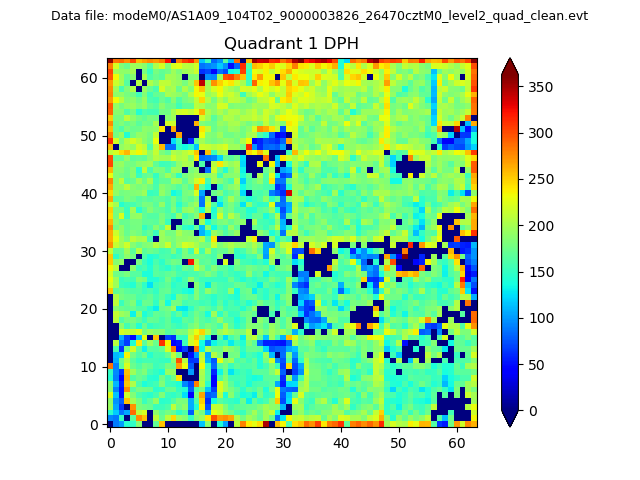 |
Quadrant B |
|---|---|---|---|
| Quadrant D | 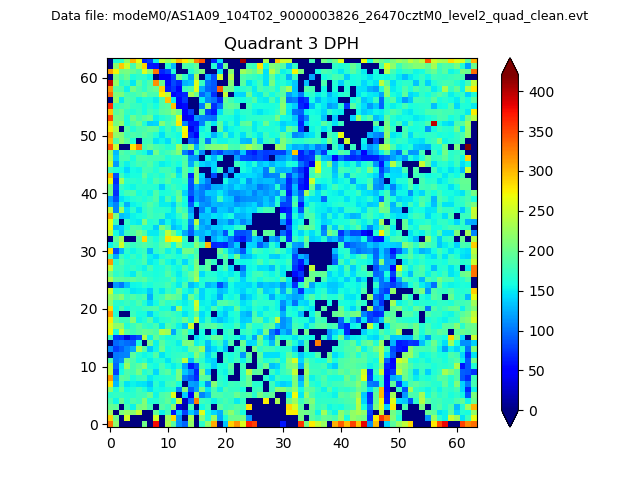 |
 |
Quadrant C |
| Plot type | Count rate plots | Images |
|---|---|---|
| Comparison with Poisson distribution Blue bars denote a histogram of data divided into 1 sec bins. Red curve is a Poisson curve with rate = median count rate of data. |
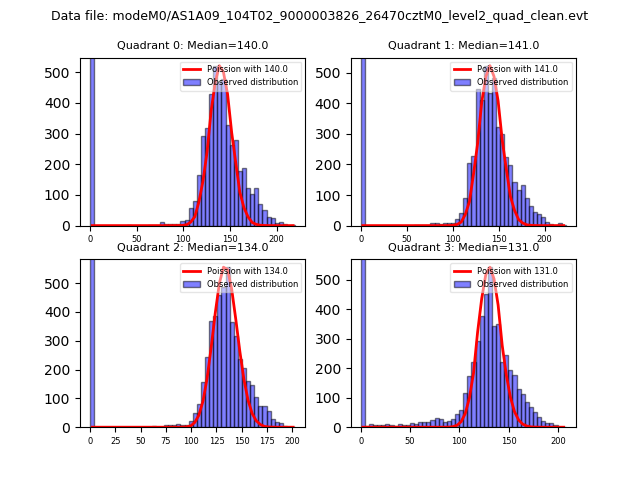 |
 |
| Quadrant-wise count rates Data is divided into 100 sec bins |
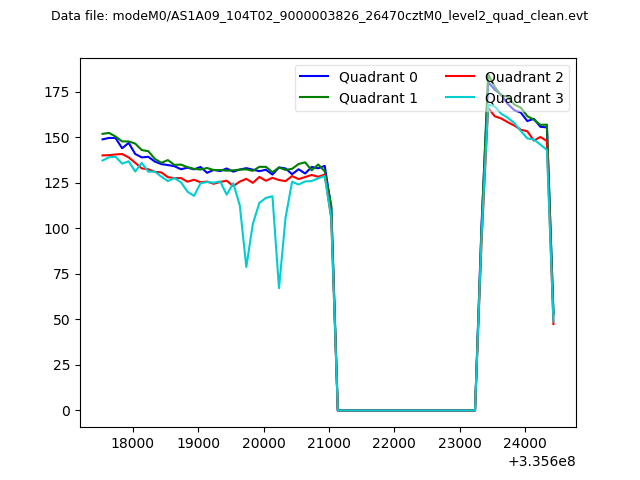 |
|
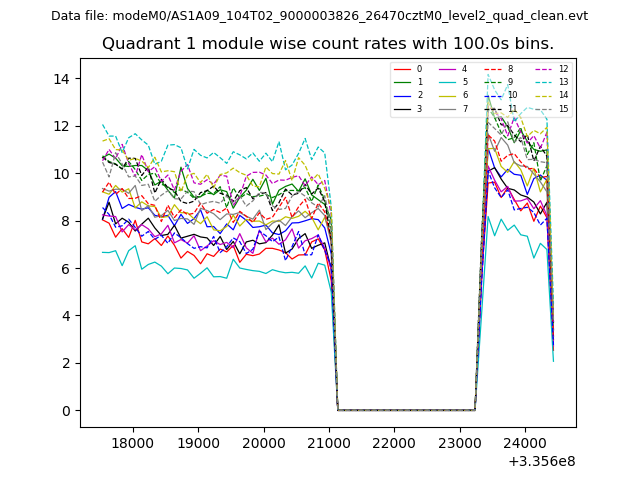
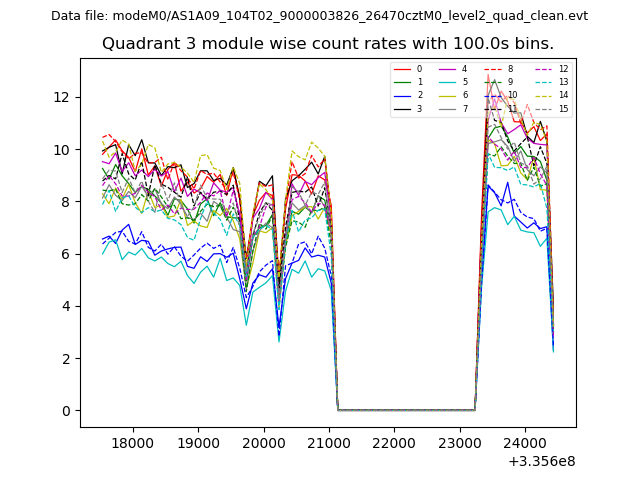
| Module-wise count rates for Quadrant A Data is divided into 100 sec bins |
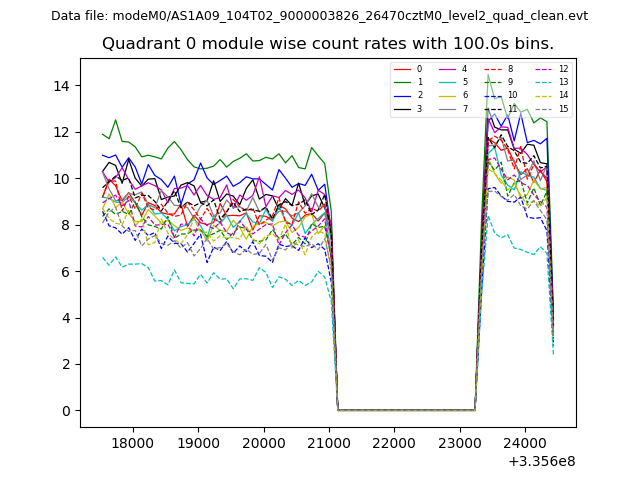 |
 |
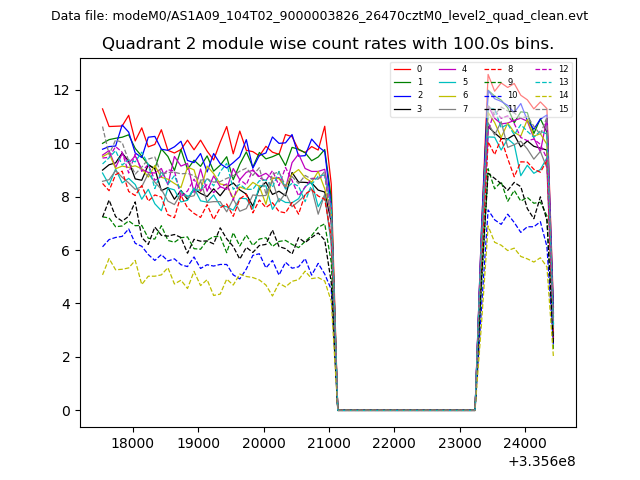
| Module-wise count rates for Quadrant B Data is divided into 100 sec bins |
 |
 |
| Module-wise count rates for Quadrant C Data is divided into 100 sec bins |
 |
 |
| Module-wise count rates for Quadrant D Data is divided into 100 sec bins |
 |
 |
| Parameter | Plot |
|---|---|
| CZT HV Monitor | 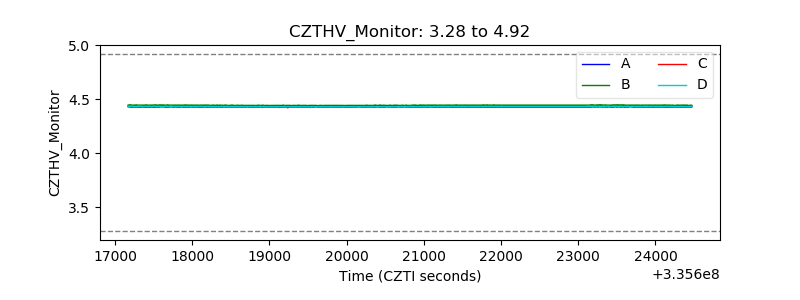 |
| D_VDD | 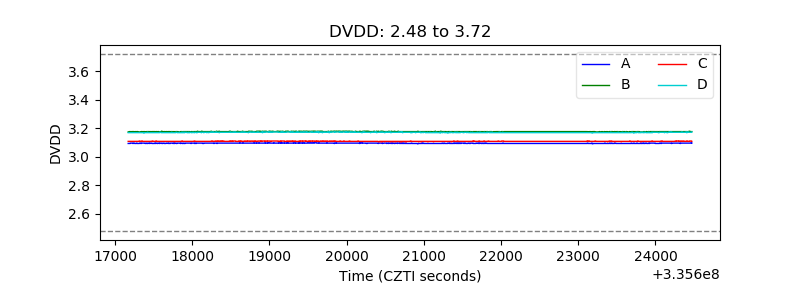 |
| Temperature 1 | 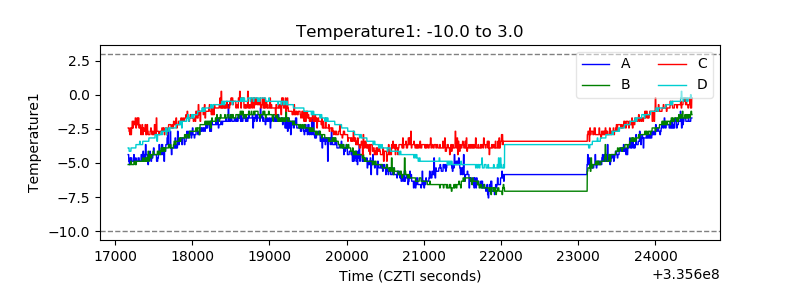 |
| Veto HV Monitor | 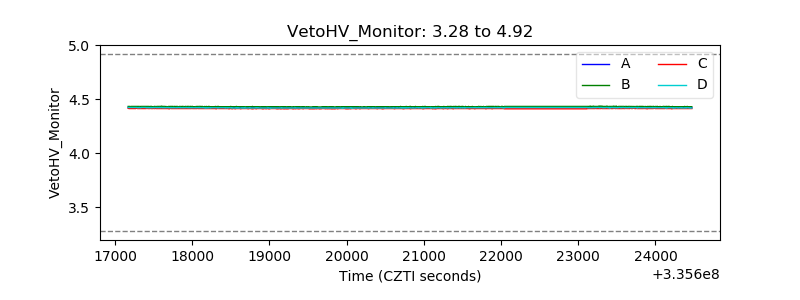 |
| Veto LLD | 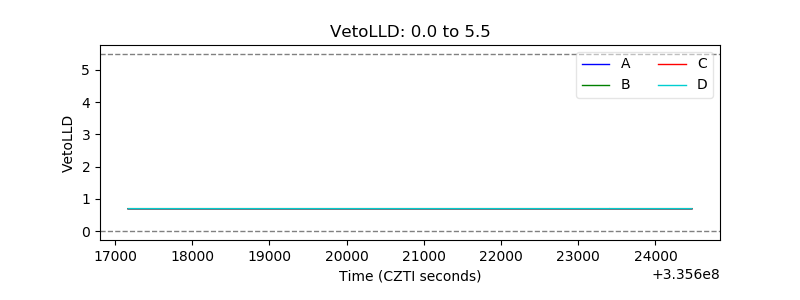 |
| Alpha Counter | 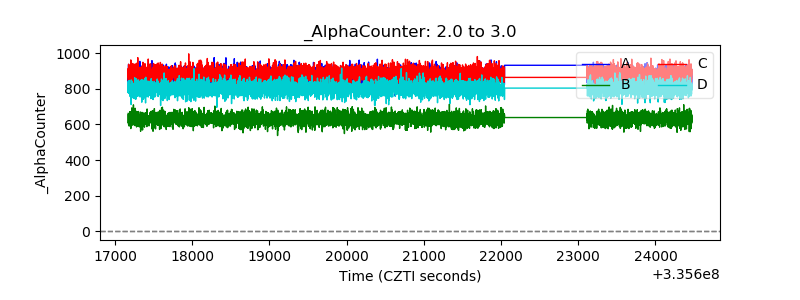 |
| _CPM_Rate | 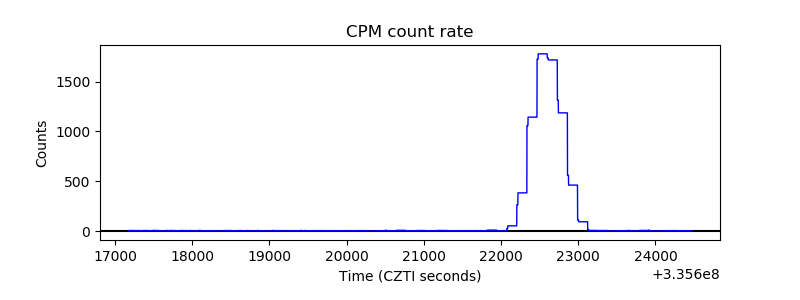 |
| CZT Counter | 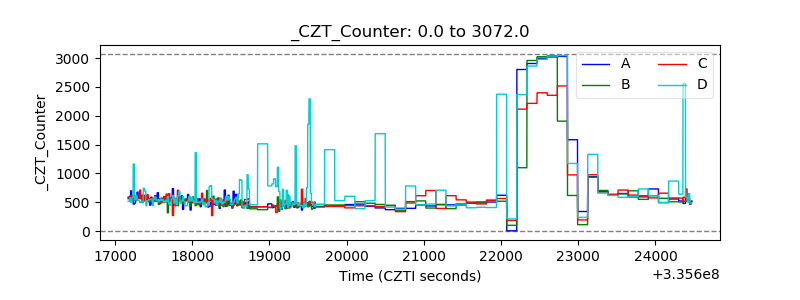 |
| +2.5 Volts monitor | 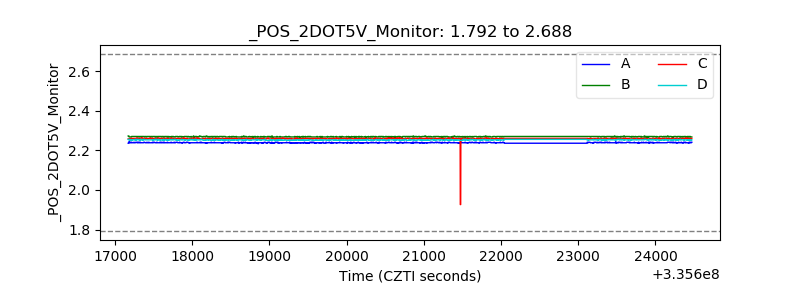 |
| +5 Volts monitor | 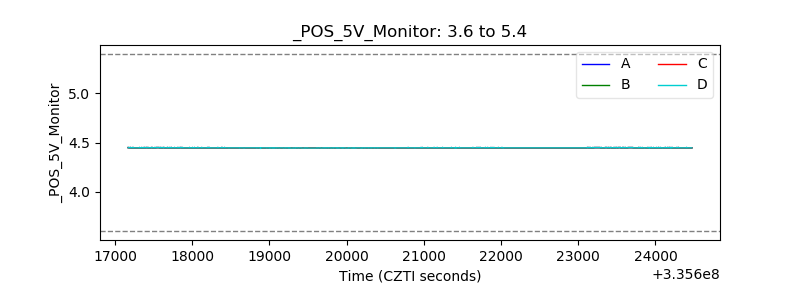 |
| _ROLL_ROT | 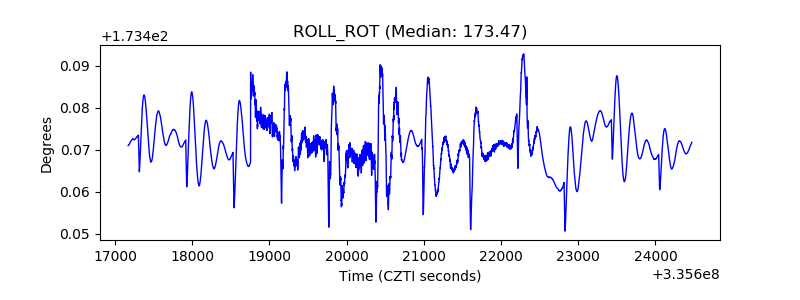 |
| _Roll_DEC | 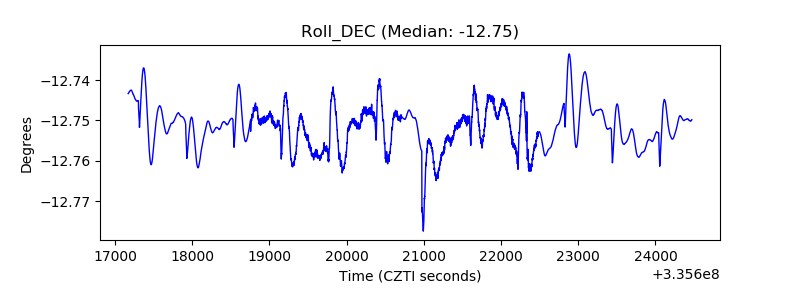 |
| _Roll_RA | 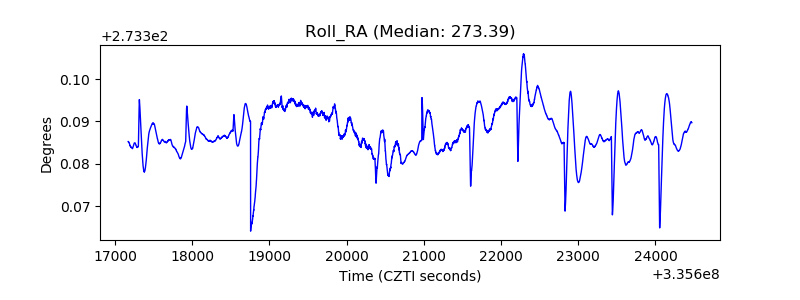 |
| Veto Counter | 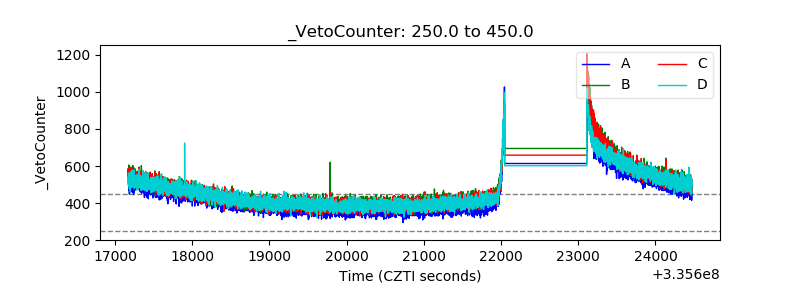 |