| Param | Original file | Final file |
|---|---|---|
| Filename | modeM0/AS1A09_104T02_9000003826_26472cztM0_level2.evt | modeM0/AS1A09_104T02_9000003826_26472cztM0_level2_quad_clean.evt |
| Size (bytes) | 477,766,080 | 111,360,960 |
| Size | 455.6 MB | 106.2 MB |
| Events in quadrant A | 3,191,542 | 764,172 |
| Events in quadrant B | 3,215,129 | 767,952 |
| Events in quadrant C | 3,473,105 | 714,847 |
| Events in quadrant D | 4,177,635 | 702,030 |
| Mode M0 | |||
|---|---|---|---|
| Quadrant | BADHDUFLAG | Total packets | Discarded packets |
| A | 0 | 13481 | 0 |
| B | 0 | 13431 | 0 |
| C | 0 | 14287 | 0 |
| D | 0 | 16455 | 0 |
| Mode M9 | |||
|---|---|---|---|
| Quadrant | BADHDUFLAG | Total packets | Discarded packets |
| A | 0 | 12 | 0 |
| B | 0 | 12 | 0 |
| C | 0 | 12 | 0 |
| D | 0 | 12 | 0 |
| Quadrant | Total seconds | Saturated seconds | Saturation percentage |
|---|---|---|---|
| A | 6065 | 64 | 1.055235% |
| B | 6066 | 67 | 1.104517% |
| C | 6065 | 117 | 1.929101% |
| D | 6065 | 335 | 5.523495% |
Noise dominated data is calculated using 1-second bins in cleaned event files. If a bin has >2000 counts, and if more than 50% of those come from <1% of pixels, then it is considered to be noise-dominated and hence unusable.
| Quadrant | # 1 sec bins | Bins with >0 counts | Bins with >2000 counts | High rate bins dominated by noise | Noise dominated (total time) | Noise dominated (detector-on time) | Marked lightcurve |
|---|---|---|---|---|---|---|---|
| A | 7270 | 6065 | 0 | 0 | 0.00% | 0.00% | 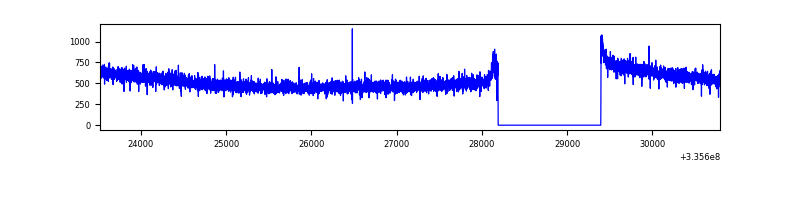 |
| B | 7271 | 6066 | 1 | 1 | 0.01% | 0.02% | 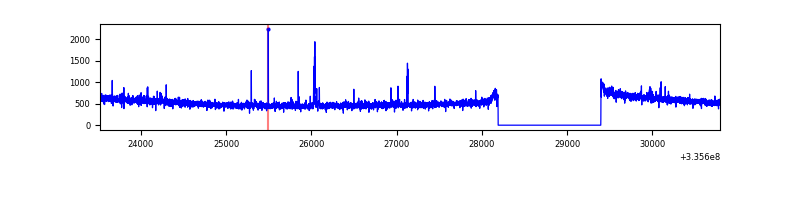 |
| C | 7270 | 6065 | 11 | 11 | 0.15% | 0.18% | 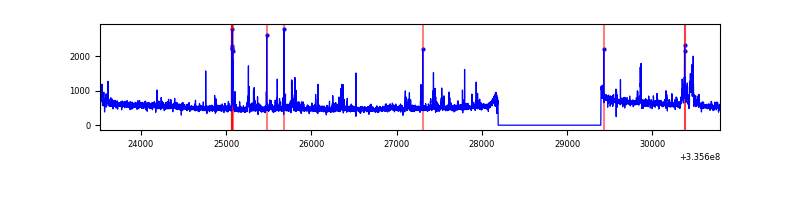 |
| D | 7270 | 6065 | 260 | 260 | 3.58% | 4.29% | 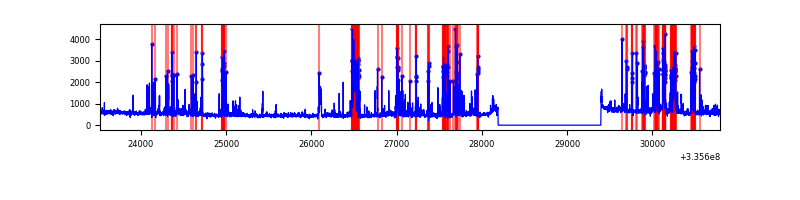 |
Top three noisy pixels from each quadrant. If the there are fewer than three noisy pixels in the level2.evt file, extra rows are filled as -1
| Pixel properties | Quadrant properties | ||||||
|---|---|---|---|---|---|---|---|
| Quadrant | DetID | PixID | Counts | Sigma | Mean | Median | Sigma |
| A | 13 | 254 | 9453 | 52.59 | 827 | 811 | 164.3 |
| A | 0 | 226 | 7129 | 38.44 | 827 | 811 | 164.3 |
| A | 3 | 137 | 7009 | 37.71 | 827 | 811 | 164.3 |
| B | 0 | 190 | 23131 | 146.07 | 809 | 791 | 152.9 |
| B | 10 | 249 | 19681 | 123.51 | 809 | 791 | 152.9 |
| B | 12 | 111 | 17816 | 111.31 | 809 | 791 | 152.9 |
| C | 3 | 233 | 161616 | 898.22 | 773 | 780 | 179.1 |
| C | 14 | 238 | 125860 | 698.54 | 773 | 780 | 179.1 |
| C | 4 | 254 | 117592 | 652.36 | 773 | 780 | 179.1 |
| D | 7 | 80 | 802285 | 4308.8 | 779 | 762 | 186.0 |
| D | 12 | 233 | 346732 | 1859.85 | 779 | 762 | 186.0 |
| D | 11 | 176 | 29154 | 152.63 | 779 | 762 | 186.0 |
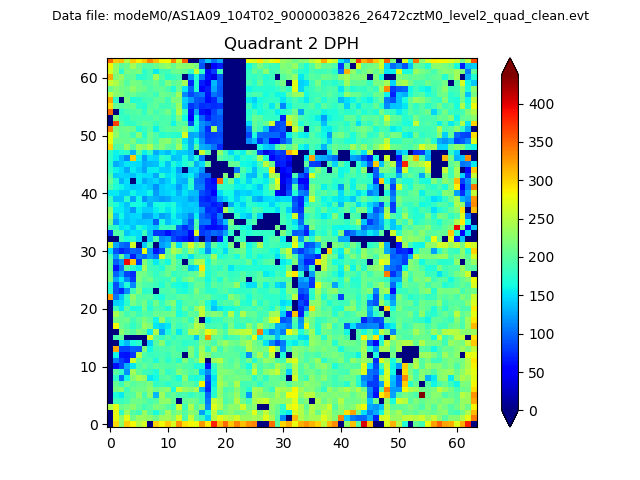
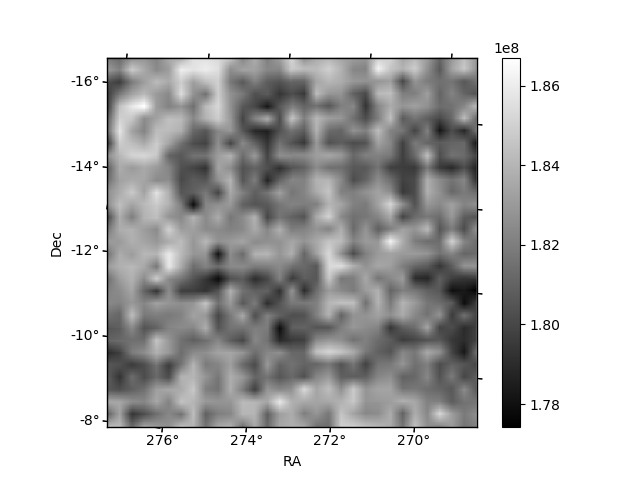
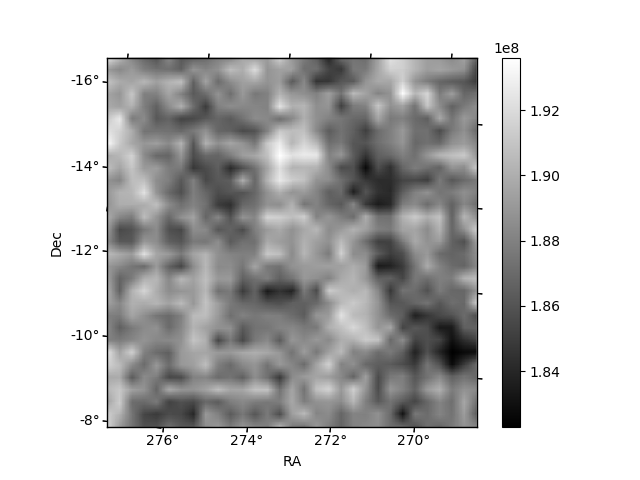
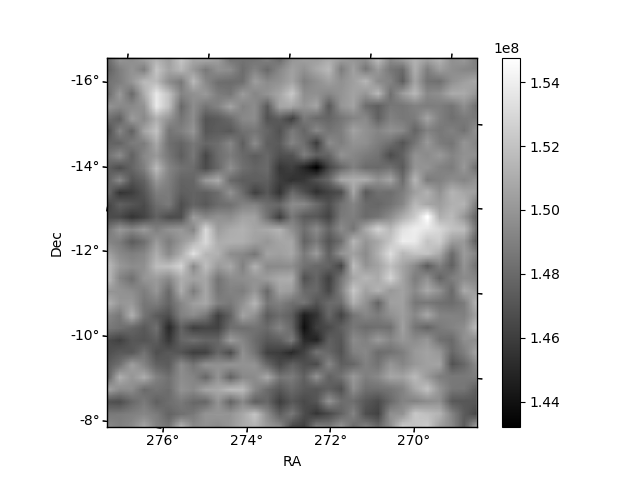
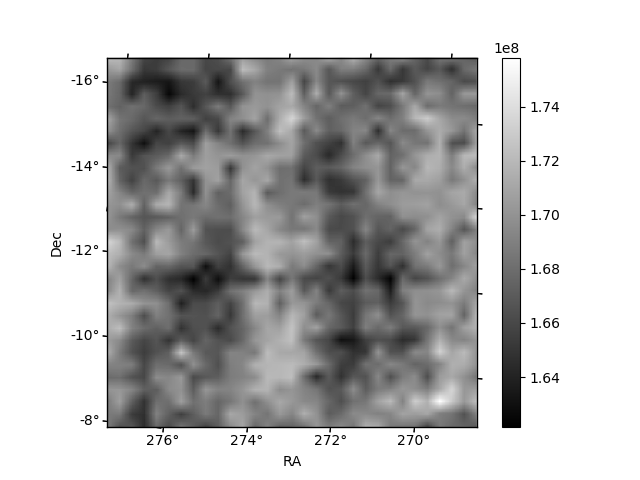
Histogram calculated using DETX and DETY for each event in the final _common_clean file
| Quadrant A | 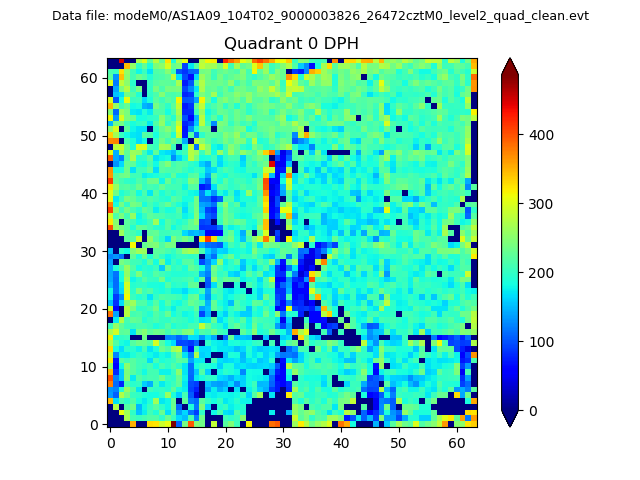 |
 |
Quadrant B |
|---|---|---|---|
| Quadrant D |  |
 |
Quadrant C |
| Plot type | Count rate plots | Images |
|---|---|---|
| Comparison with Poisson distribution Blue bars denote a histogram of data divided into 1 sec bins. Red curve is a Poisson curve with rate = median count rate of data. |
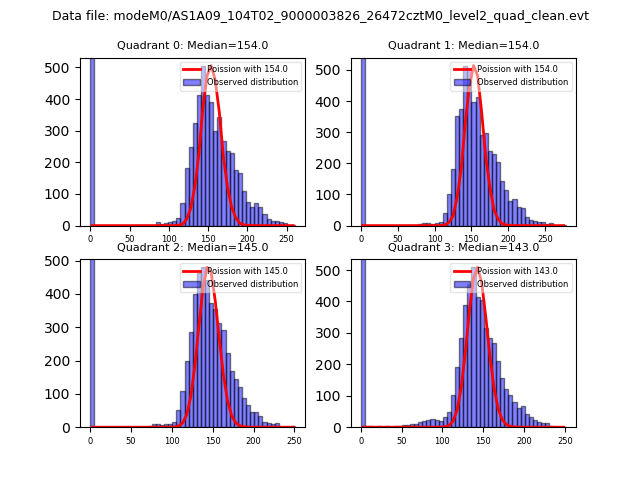 |
 |
| Quadrant-wise count rates Data is divided into 100 sec bins |
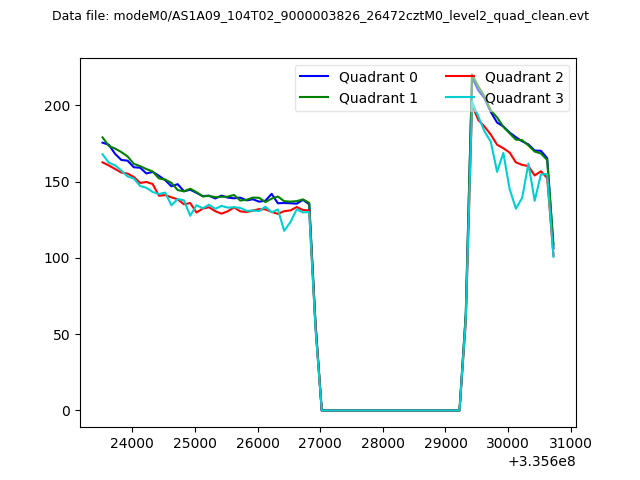 |
|
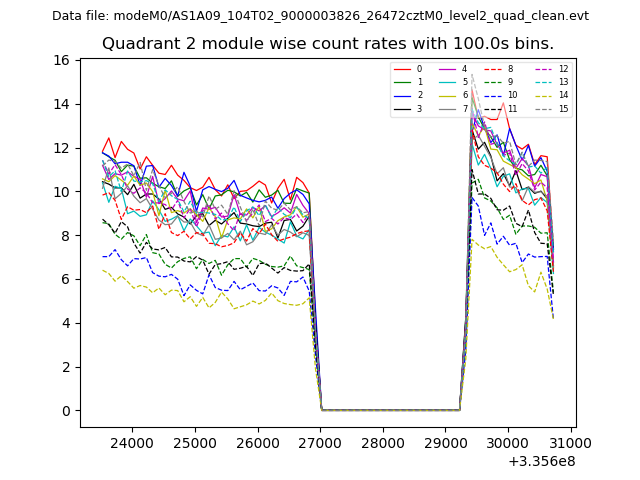
| Module-wise count rates for Quadrant A Data is divided into 100 sec bins |
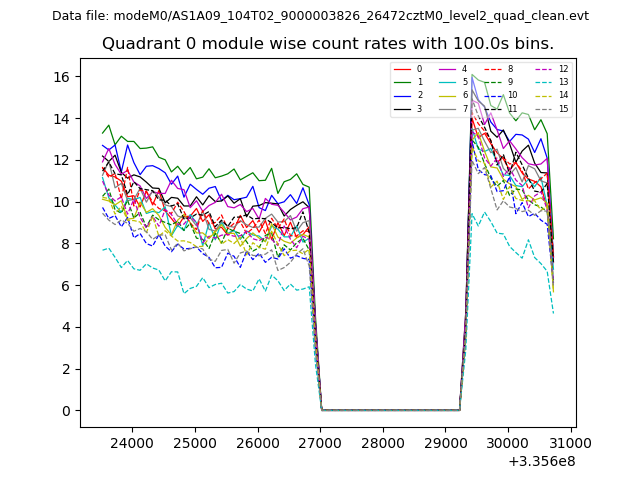 |
 |
| Module-wise count rates for Quadrant B Data is divided into 100 sec bins |
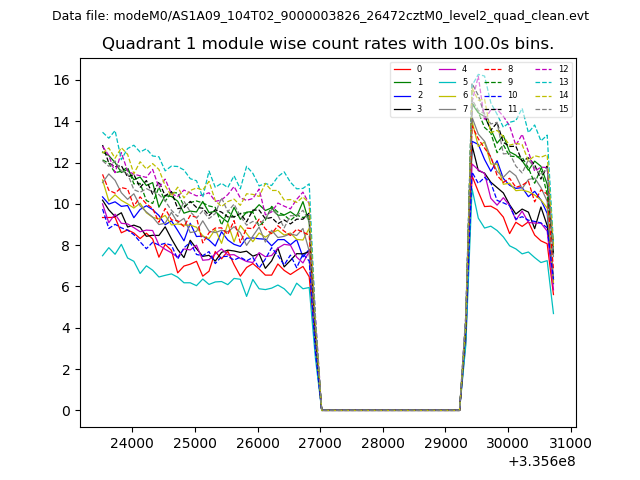 |
 |
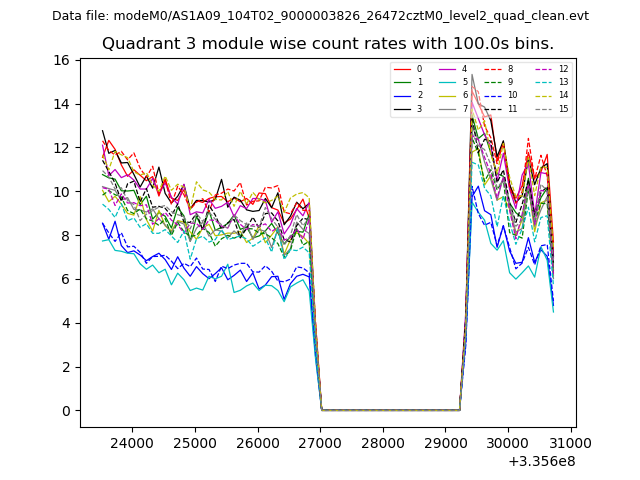
| Module-wise count rates for Quadrant C Data is divided into 100 sec bins |
 |
 |
| Module-wise count rates for Quadrant D Data is divided into 100 sec bins |
 |
 |
| Parameter | Plot |
|---|---|
| CZT HV Monitor | 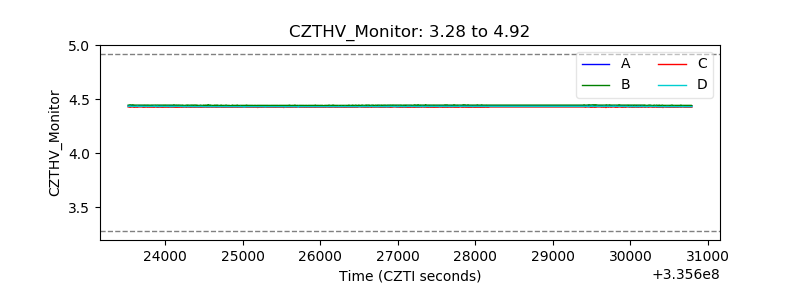 |
| D_VDD | 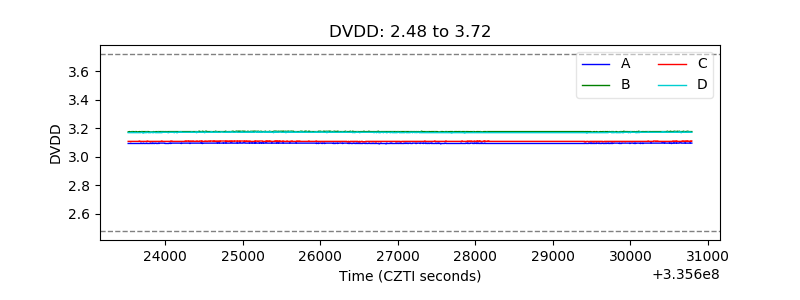 |
| Temperature 1 | 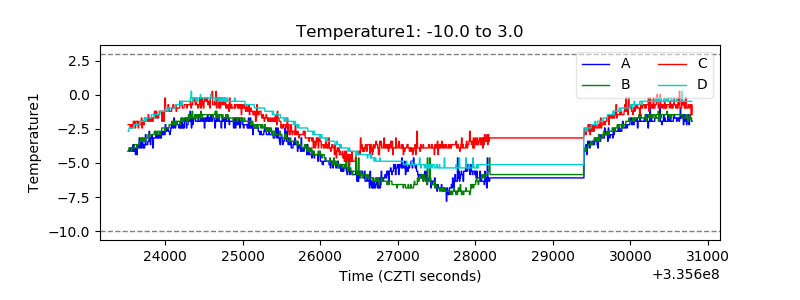 |
| Veto HV Monitor | 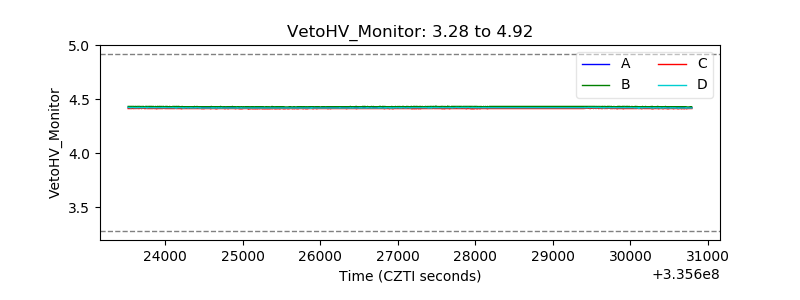 |
| Veto LLD | 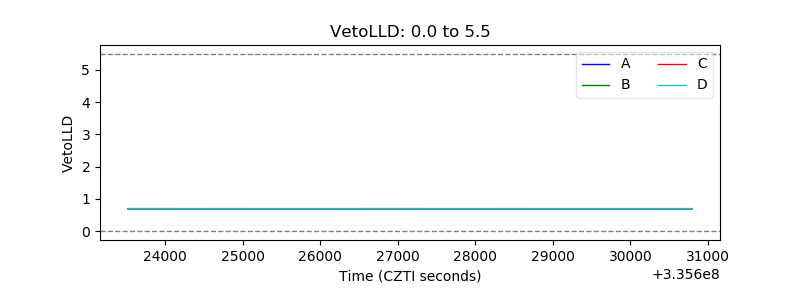 |
| Alpha Counter | 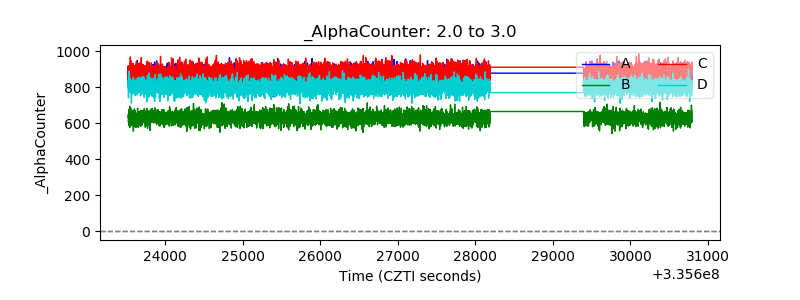 |
| _CPM_Rate | 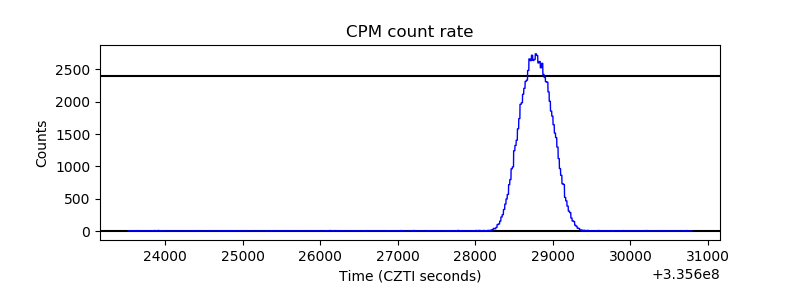 |
| CZT Counter | 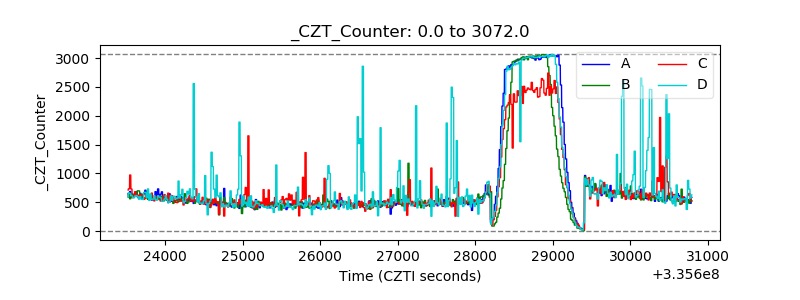 |
| +2.5 Volts monitor | 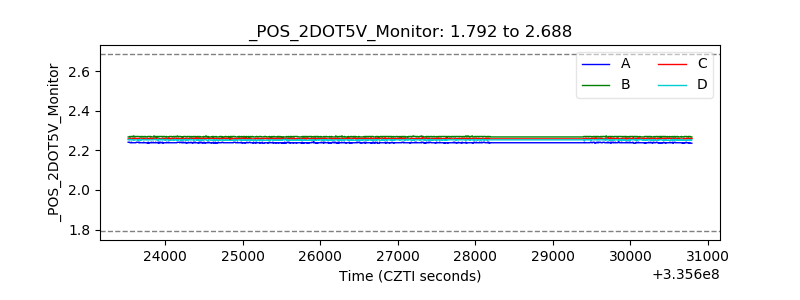 |
| +5 Volts monitor |  |
| _ROLL_ROT | 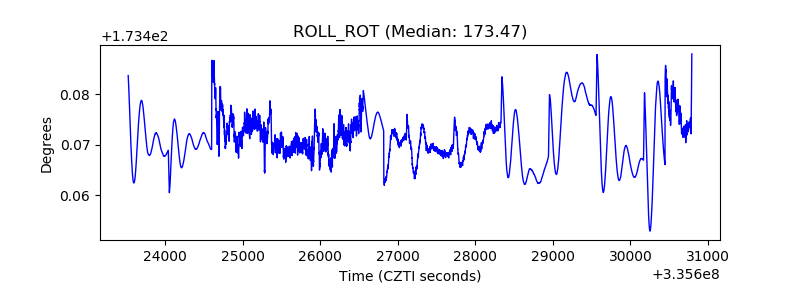 |
| _Roll_DEC | 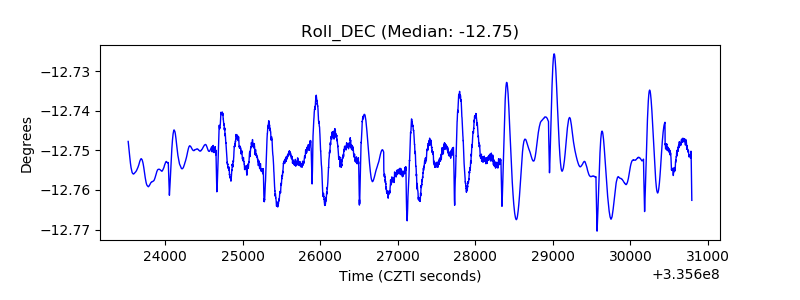 |
| _Roll_RA | 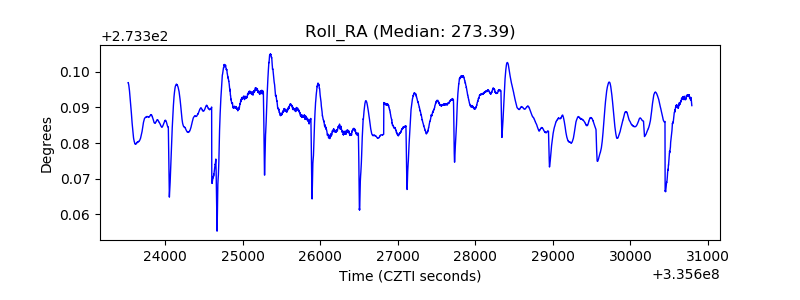 |
| Veto Counter | 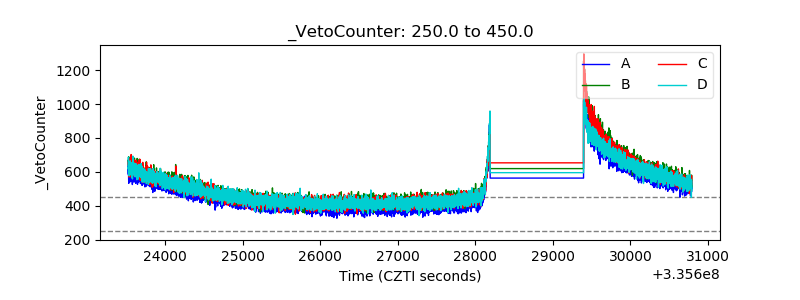 |